seurat 单细胞数据分析中 VariableFeaturePlot函数实现
001、
dat <- pbmc[["RNA"]]@meta.features                            ## 绘图数据
plot(log10(dat$vst.mean), dat$vst.variance.standardized)      ## 绘图使用数据
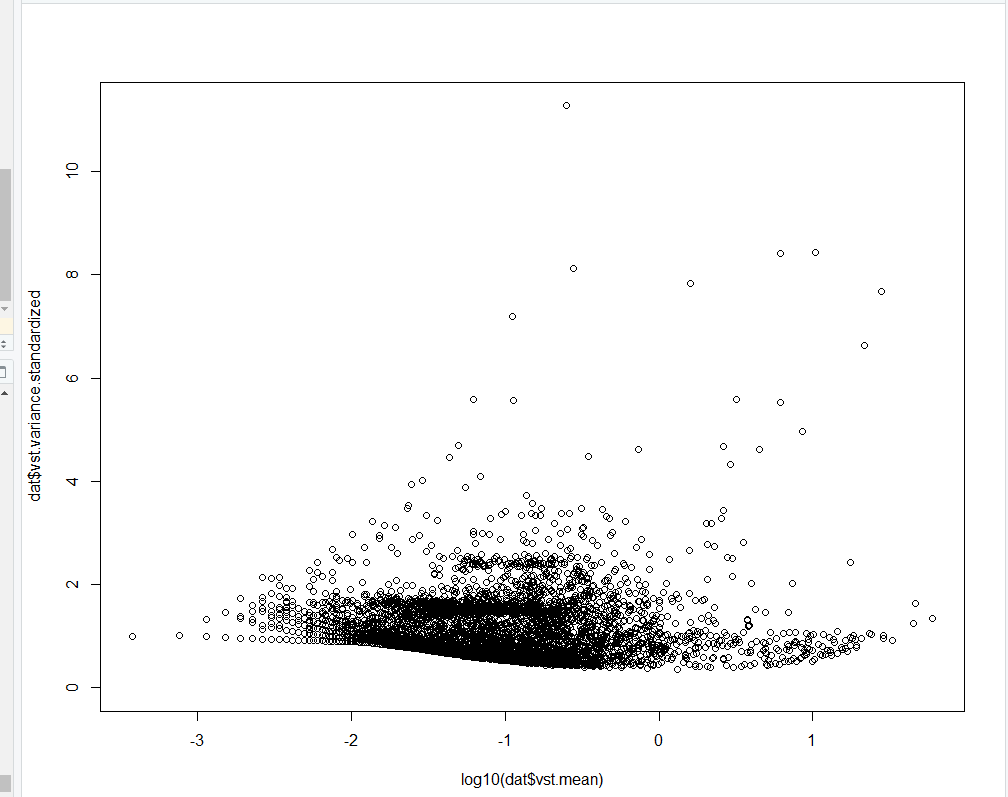
为什么和log10函数和 ggplot2中scale_x_log10() 函数实现的不一致??

001、
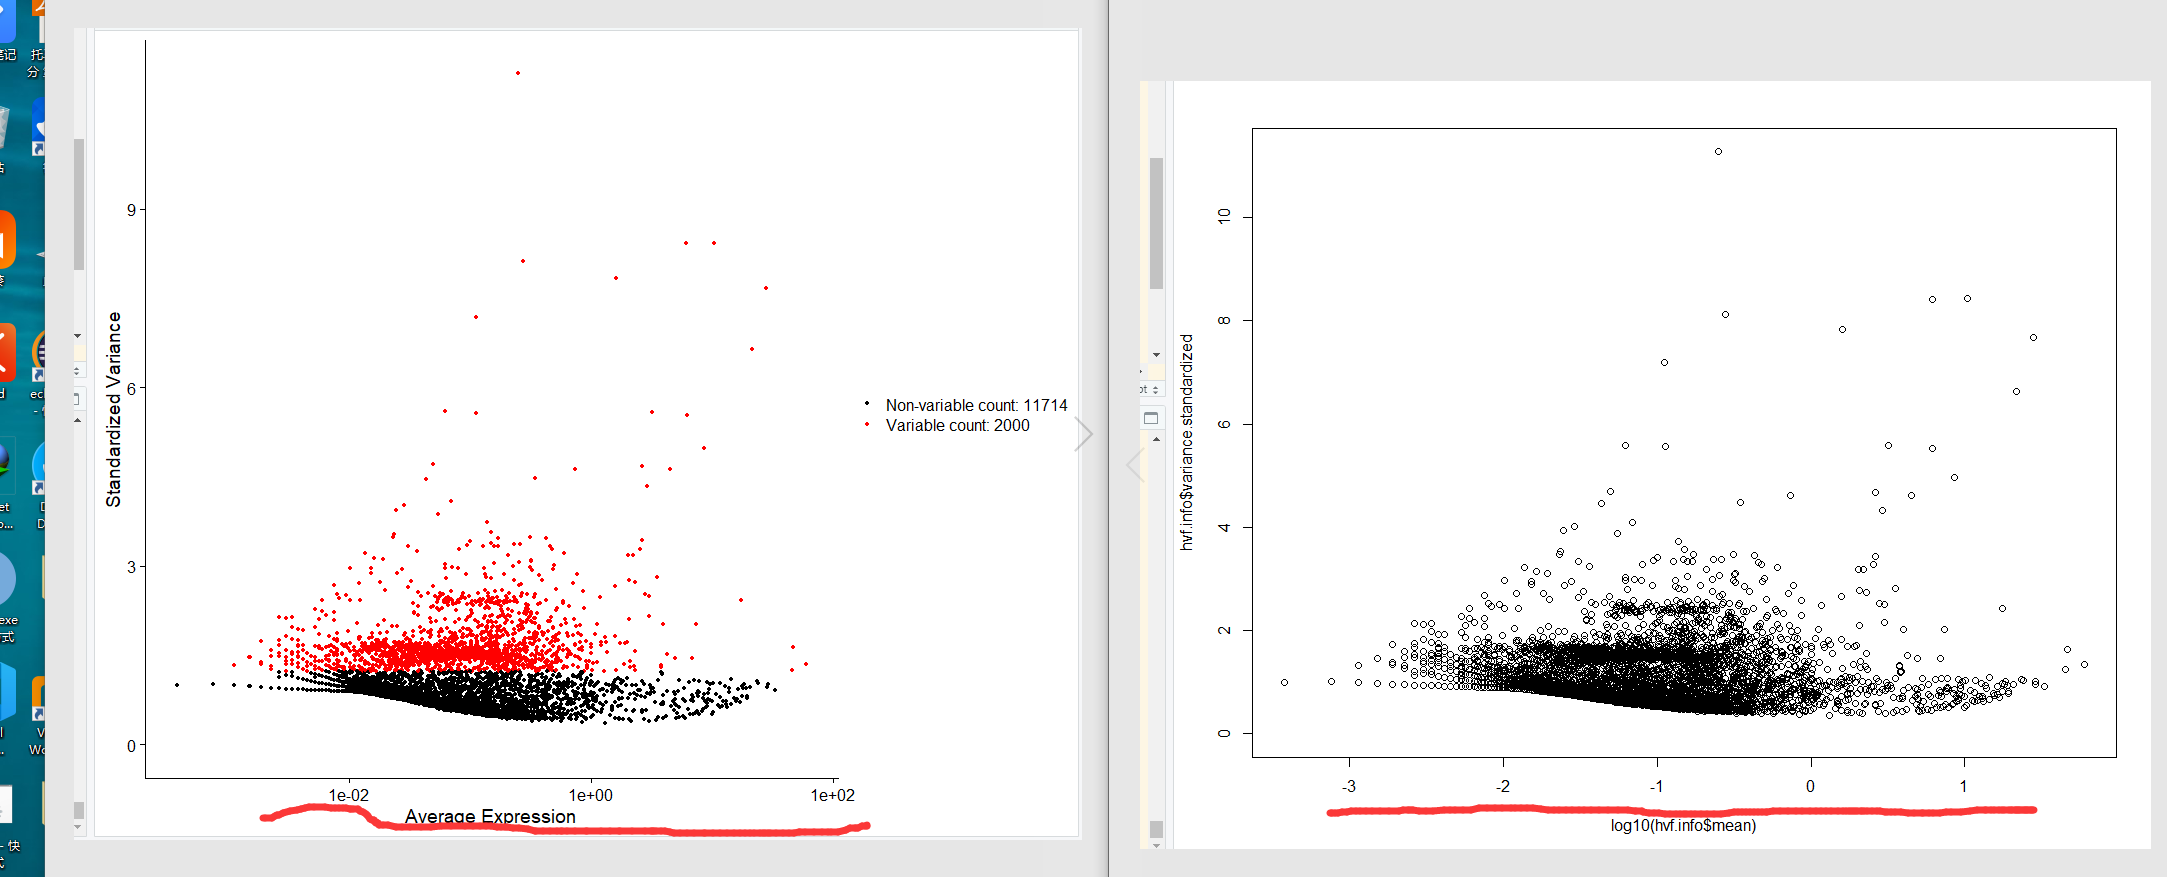
dat <- pbmc[["RNA"]]@meta.features ## 绘图数据 plot(log10(dat$vst.mean), dat$vst.variance.standardized) ## 绘图使用数据
为什么和log10函数和 ggplot2中scale_x_log10() 函数实现的不一致??


【推荐】国内首个AI IDE,深度理解中文开发场景,立即下载体验Trae
【推荐】编程新体验,更懂你的AI,立即体验豆包MarsCode编程助手
【推荐】抖音旗下AI助手豆包,你的智能百科全书,全免费不限次数
【推荐】轻量又高性能的 SSH 工具 IShell:AI 加持,快人一步
· 震惊!C++程序真的从main开始吗?99%的程序员都答错了
· 【硬核科普】Trae如何「偷看」你的代码?零基础破解AI编程运行原理
· 单元测试从入门到精通
· 上周热点回顾(3.3-3.9)
· winform 绘制太阳,地球,月球 运作规律
2021-08-27 c 语言 限制用户的选项(菜单浏览)
2021-08-27 c语言中输入验证程序