

ggplot2 绘图 调整画布的大小
001、

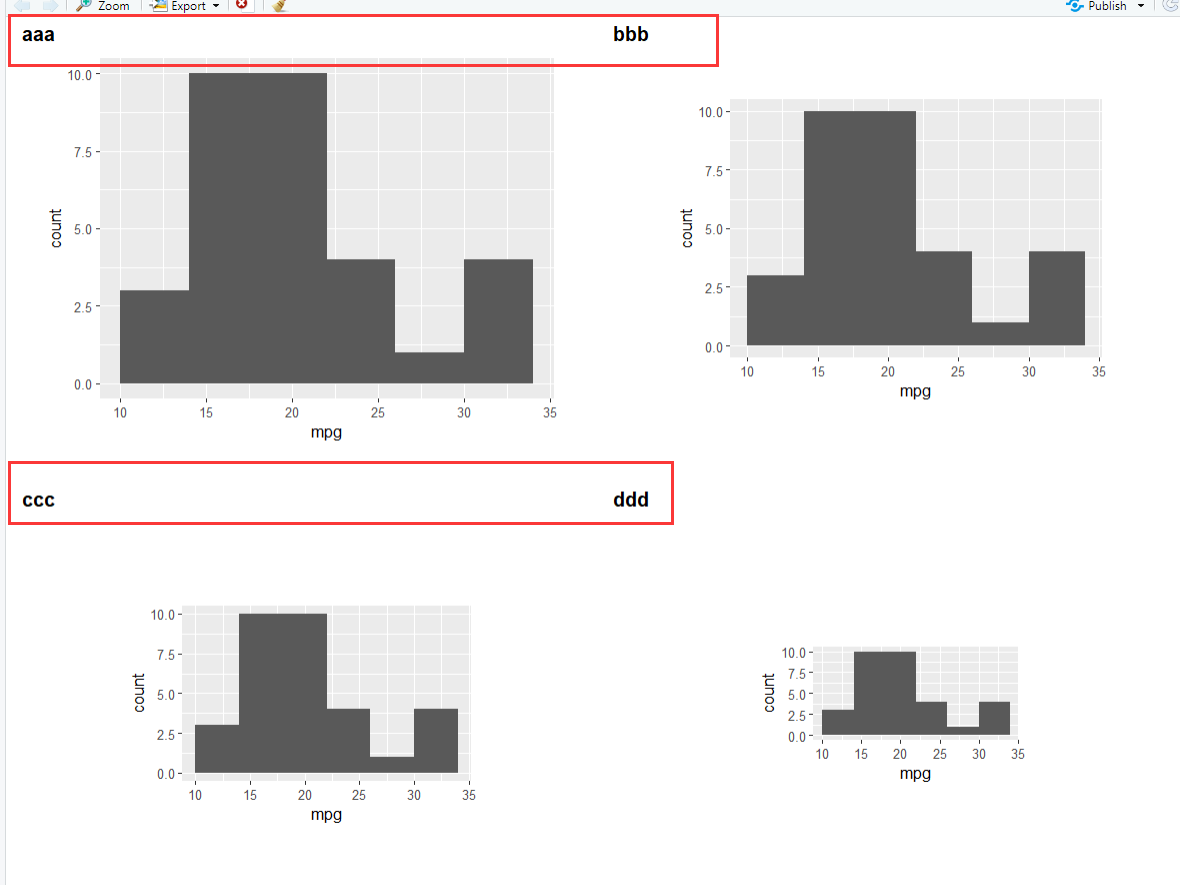
library(cowplot)

library(ggplot2)
a <- ggplot(mtcars, aes(x = mpg)) + geom_histogram(binwidth = 4) +
  theme(plot.margin=unit(c(1, 1, 1, 1),'cm'))

b <- ggplot(mtcars, aes(x = mpg)) + geom_histogram(binwidth = 4) +
  theme(plot.margin=unit(c(2, 2, 2, 2),'cm'))

c <- ggplot(mtcars, aes(x = mpg)) + geom_histogram(binwidth = 4) +
  theme(plot.margin=unit(c(3, 3, 3, 3),'cm'))

d <- ggplot(mtcars, aes(x = mpg)) + geom_histogram(binwidth = 4) +
  theme(plot.margin=unit(c(4, 4, 4, 4),'cm'))

plot_grid(a, b, c, d, nrow=2,labels = c('aaa', 'bbb', 'ccc', 'ddd'))


【推荐】国内首个AI IDE,深度理解中文开发场景,立即下载体验Trae
【推荐】编程新体验,更懂你的AI,立即体验豆包MarsCode编程助手
【推荐】抖音旗下AI助手豆包,你的智能百科全书,全免费不限次数
【推荐】轻量又高性能的 SSH 工具 IShell:AI 加持,快人一步
· winform 绘制太阳,地球,月球 运作规律
· AI与.NET技术实操系列(五):向量存储与相似性搜索在 .NET 中的实现
· 超详细:普通电脑也行Windows部署deepseek R1训练数据并当服务器共享给他人
· 【硬核科普】Trae如何「偷看」你的代码?零基础破解AI编程运行原理
· 上周热点回顾(3.3-3.9)
2018-08-02 linux系统如何将一个文件同时复制多份