
GWAS分析 一般线性模型GLM + 协变量中meta、se、T、p值的计算
001、plink

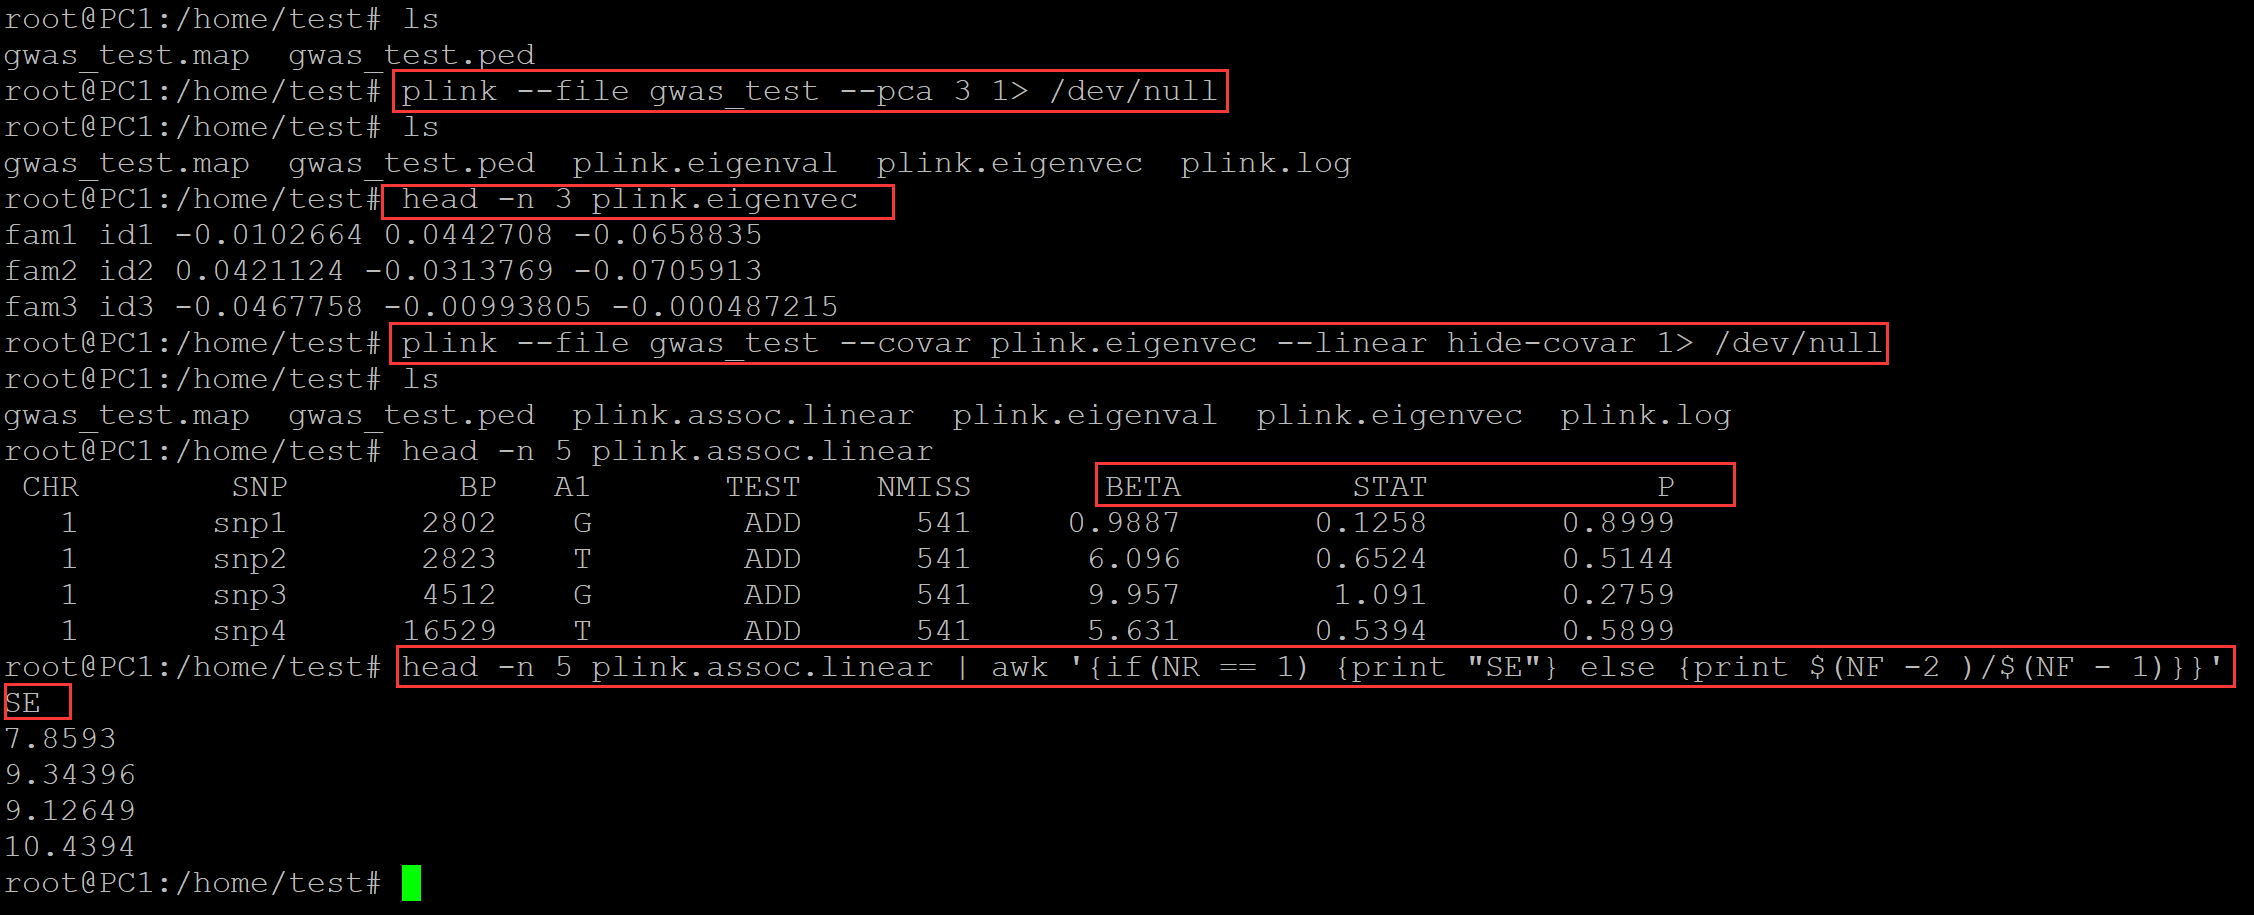
root@PC1:/home/test# ls
gwas_test.map  gwas_test.ped
root@PC1:/home/test# plink --file gwas_test --pca 3 1> /dev/null
root@PC1:/home/test# ls
gwas_test.map  gwas_test.ped  plink.eigenval  plink.eigenvec  plink.log
root@PC1:/home/test# head -n 3 plink.eigenvec
fam1 id1 -0.0102664 0.0442708 -0.0658835
fam2 id2 0.0421124 -0.0313769 -0.0705913
fam3 id3 -0.0467758 -0.00993805 -0.000487215
root@PC1:/home/test# plink --file gwas_test --covar plink.eigenvec --linear hide-covar 1> /dev/null
root@PC1:/home/test# ls
gwas_test.map  gwas_test.ped  plink.assoc.linear  plink.eigenval  plink.eigenvec  plink.log
root@PC1:/home/test# head -n 5 plink.assoc.linear
 CHR        SNP         BP   A1       TEST    NMISS       BETA         STAT            P
   1       snp1       2802    G        ADD      541     0.9887       0.1258       0.8999
   1       snp2       2823    T        ADD      541      6.096       0.6524       0.5144
   1       snp3       4512    G        ADD      541      9.957        1.091       0.2759
   1       snp4      16529    T        ADD      541      5.631       0.5394       0.5899
root@PC1:/home/test# head -n 5 plink.assoc.linear | awk '{if(NR == 1) {print "SE"} else {print $(NF -2 )/$(NF - 1)}}'
SE
7.8593
9.34396
9.12649
10.4394
002、R
root@PC1:/home/test# ls
gwas_test.map  gwas_test.ped
root@PC1:/home/test# plink --file gwas_test --recode A 1> /dev/null
root@PC1:/home/test# ls
gwas_test.map  gwas_test.ped  plink.log  plink.raw
root@PC1:/home/test# plink --file gwas_test --pca 3 header 1> /dev/null
root@PC1:/home/test# ls
gwas_test.map  gwas_test.ped  plink.eigenval  plink.eigenvec  plink.log  plink.raw
root@PC1:/home/test# awk '{print $2, $6}' plink.raw | paste -d " " - <(cut -d " " -f 3- plink.eigenvec ) | paste -d " " - <(cut -d " " -f 7- plink.raw ) > dat.txt
root@PC1:/home/test# head -n 3 dat.txt | cut -d " " -f 1-10 | column -t
IID  PHENOTYPE  PC1         PC2         PC3         snp1_G  snp2_T  snp3_G  snp4_T  snp5_G
id1  580        -0.0102664  0.0442708   -0.0658835  0       1       1       0       1
id2  690        0.0421124   -0.0313769  -0.0705913  0       0       0       0       0
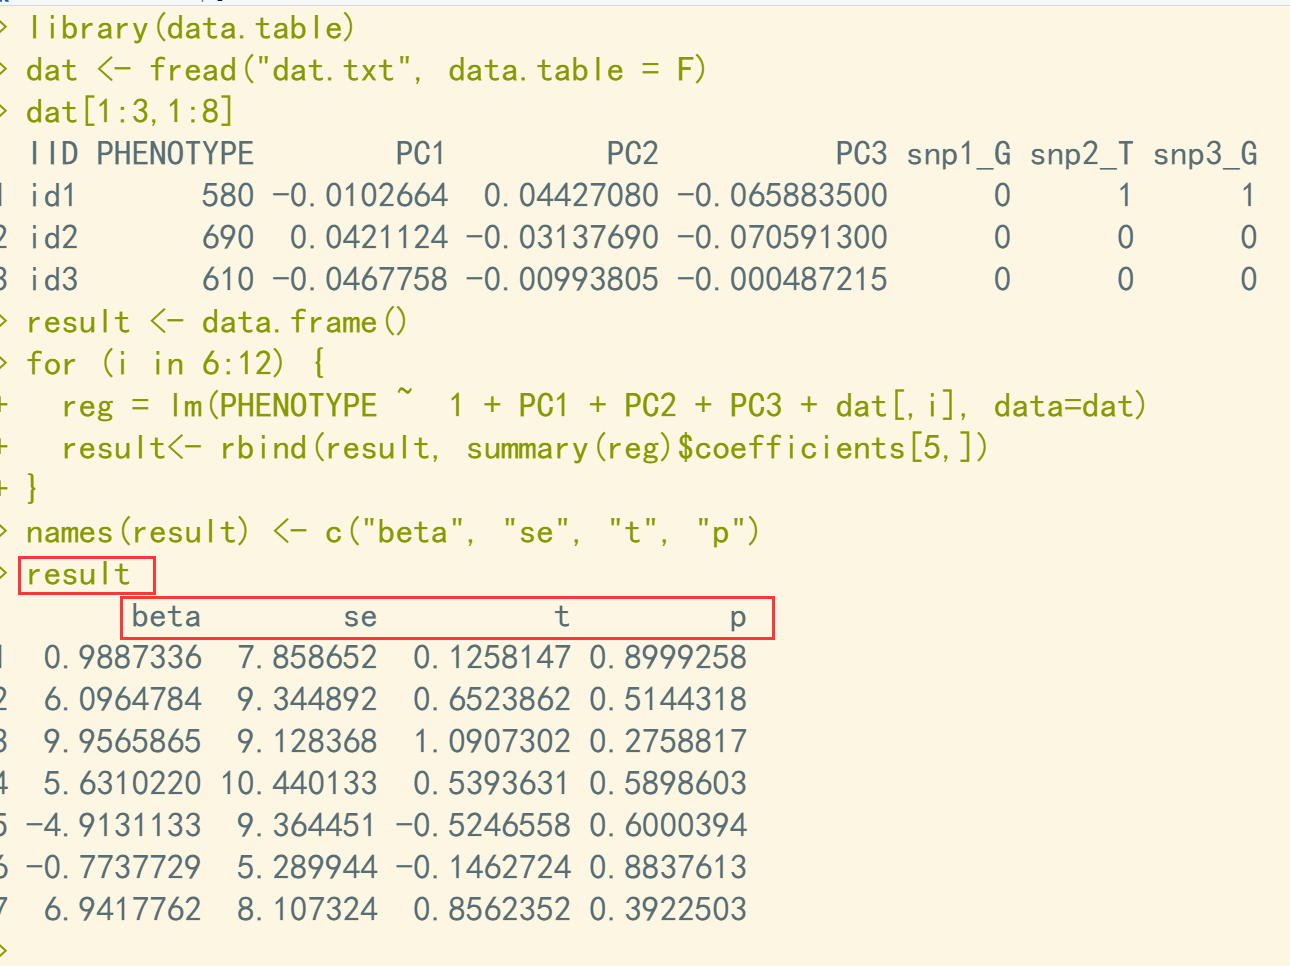
library(data.table)
dat <- fread("dat.txt", data.table = F)
dat[1:3,1:8]

result <- data.frame()
for (i in 6:12) {
  reg = lm(PHENOTYPE ~  1 + PC1 + PC2 + PC3 + dat[,i], data=dat)
  result<- rbind(result, summary(reg)$coefficients[5,])
}
names(result) <- c("beta", "se", "t", "p")
result


【推荐】国内首个AI IDE,深度理解中文开发场景,立即下载体验Trae
【推荐】编程新体验,更懂你的AI,立即体验豆包MarsCode编程助手
【推荐】抖音旗下AI助手豆包,你的智能百科全书,全免费不限次数
【推荐】轻量又高性能的 SSH 工具 IShell:AI 加持,快人一步
· 震惊!C++程序真的从main开始吗?99%的程序员都答错了
· 【硬核科普】Trae如何「偷看」你的代码?零基础破解AI编程运行原理
· 单元测试从入门到精通
· 上周热点回顾(3.3-3.9)
· winform 绘制太阳,地球,月球 运作规律
2021-07-27 c primer plus 3.11-2
2021-07-27 c primer plus 3.11
2021-07-27 c语言中如何处理整数值的上溢和下溢