
R语言绘制样本分布图
1、

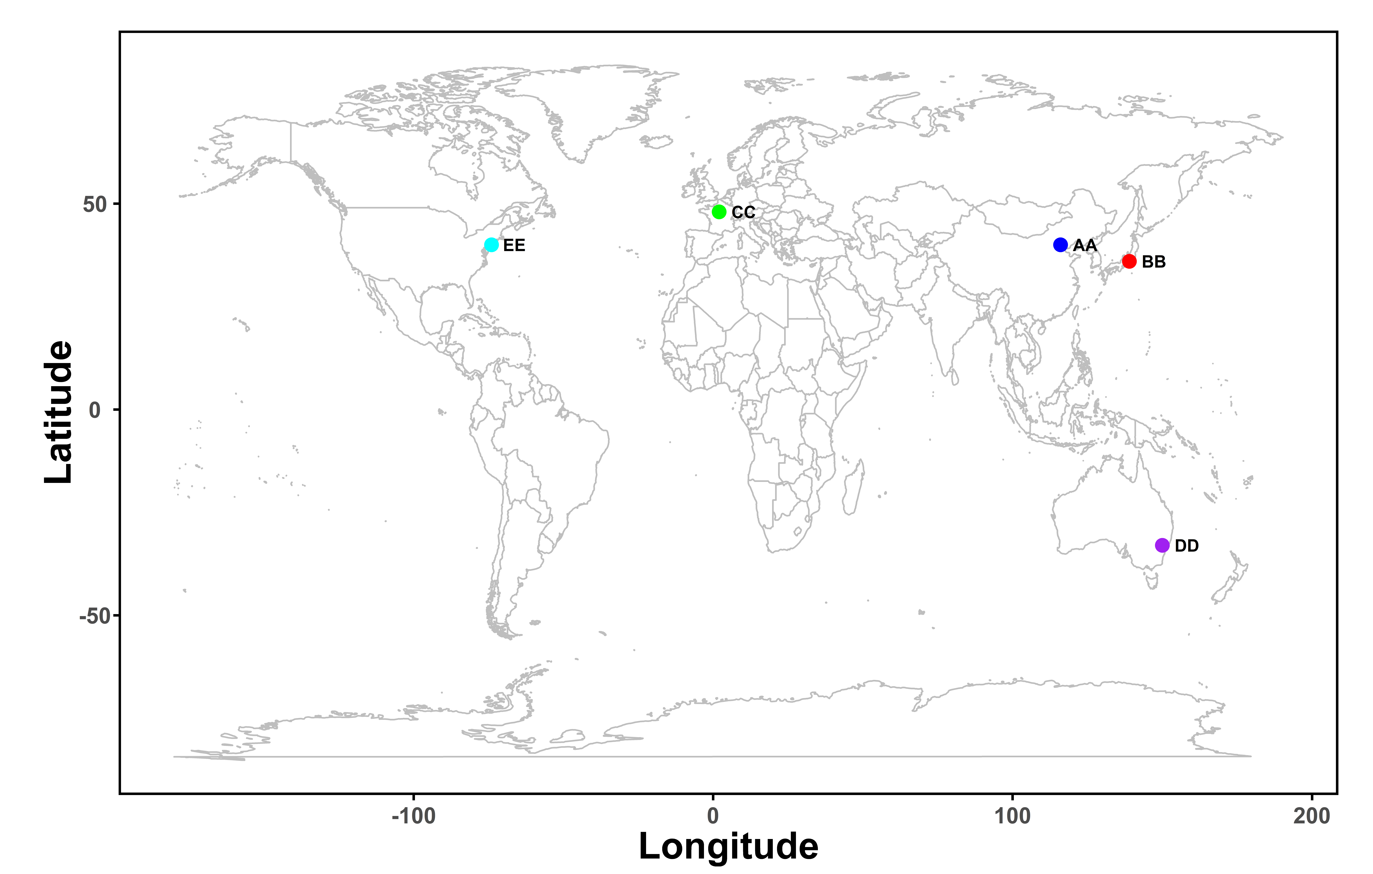
library(ggplot2)
Beijing <- c(116,40)    ## 经纬度信息
Tokyo <- c(139, 36)
Paris <- c(2, 48)
Sydney <- c(150, -33)
Newyork <- c(-74, 40)

dat <- as.data.frame(rbind(Beijing, Tokyo, Paris, Sydney,Newyork))
names(dat) <- c("long","lat")      ## 生成数据框

ggplot(data =  dat, aes(x = long, y = lat)) +
  borders("world", col = "grey",size= 0.5) + geom_point(cex = 4, col = c("blue", "red", "green", "purple", "cyan")) +
  geom_text(label = c("AA", "BB", "CC", "DD","EE"),cex = 4,
            fontface = "bold",family = "sans", hjust= -0.5,vjust=0.5)  + scale_y_continuous("Latitude") +
  scale_x_continuous("Longitude") +  theme_bw()  + theme(panel.grid=element_blank()) +
  theme(panel.border = element_rect(fill=NA,color="black", size=1.5, linetype="solid")) +
  theme(axis.title.y=element_text(vjust=0.5, hjust = 0.5,size=25,face = "bold"),
        axis.text.x=element_text(vjust= 0,hjust = 0.5, size=15,face = "bold"),
        axis.text.y=element_text(vjust=0.5,hjust = 0.5,size=15,face = "bold"),
        axis.title.x=element_text(vjust=0.5,hjust = 0.5, size=25,face = "bold")) +
  theme(axis.ticks.x=element_line(color="black",size=0.8,lineend = 2)) +
  theme(axis.ticks.y=element_line(color="black",size=0.8,lineend = 2)) +
  theme(plot.margin=unit(rep(1,4),'cm'))

ggsave('distribute.png',dpi = 1080)
绘图结果:


【推荐】国内首个AI IDE,深度理解中文开发场景,立即下载体验Trae
【推荐】编程新体验,更懂你的AI,立即体验豆包MarsCode编程助手
【推荐】抖音旗下AI助手豆包,你的智能百科全书,全免费不限次数
【推荐】轻量又高性能的 SSH 工具 IShell:AI 加持,快人一步
· 震惊!C++程序真的从main开始吗?99%的程序员都答错了
· 【硬核科普】Trae如何「偷看」你的代码?零基础破解AI编程运行原理
· 单元测试从入门到精通
· 上周热点回顾(3.3-3.9)
· winform 绘制太阳,地球,月球 运作规律
2021-05-07 R语言中sapply函数
2021-05-07 linux系统 awk命令统计每一个用户进程占用的内存
2021-05-07 linux系统awk命令拆分文件
2021-05-07 c语言 6-5
2021-05-07 c语言 6-4
2021-05-07 c语言 6-3
2021-05-07 c语言 6-2 输出三个数中的最小值