
R语言中控制绘图面板中绘图数目
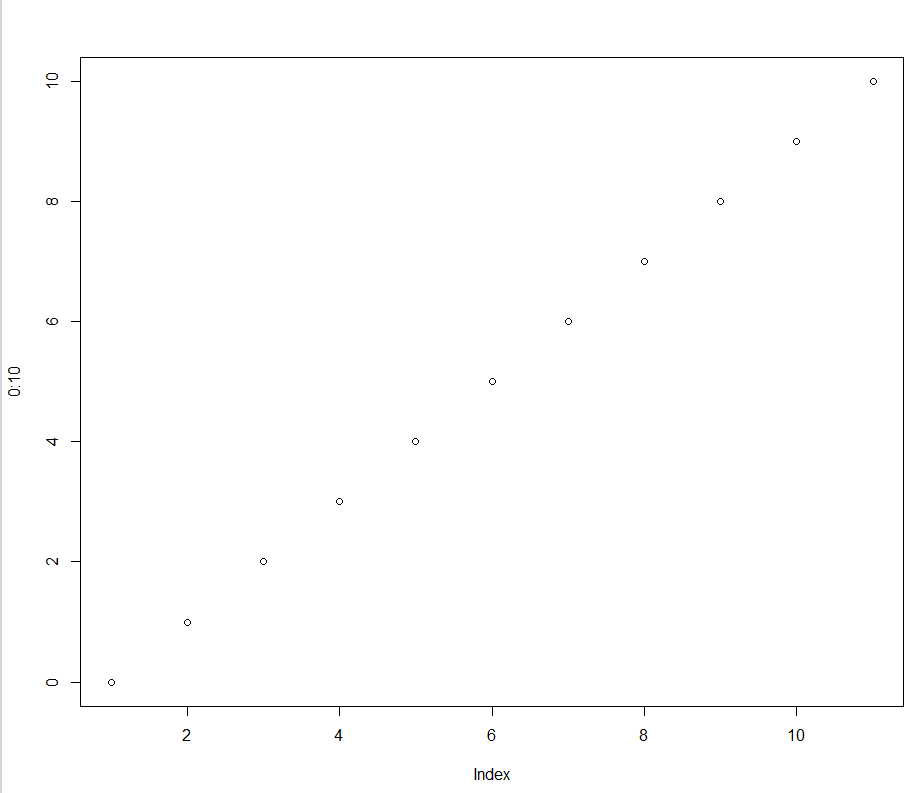
1、一般绘图
> plot(0:10)
2、利用mfrow参数设置
par(mfrow = c(1,2))   ## 设置为一行两列
plot(0:10)
plot(0:10)
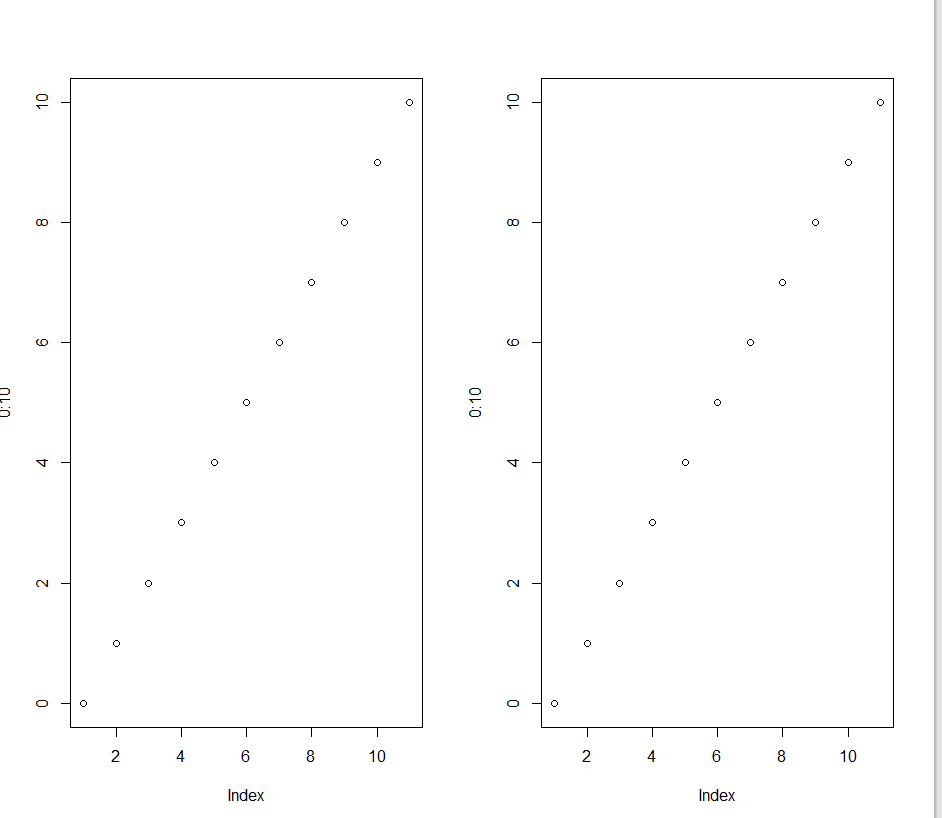
> dev.off()  ## 清空设置
null device
          1
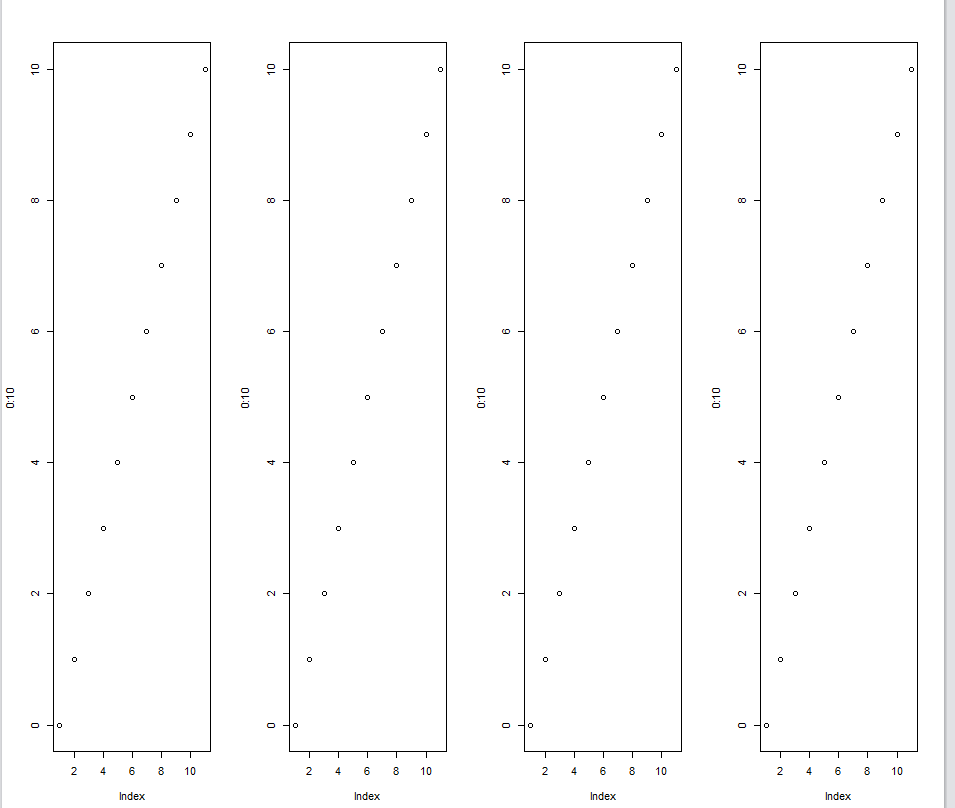
> par(mfrow = c(1,4))   ## 设置为1行4列
> plot(0:10)
> plot(0:10)
> plot(0:10)
> plot(0:10)
> dev.off()     ## 清空设置
null device
          1

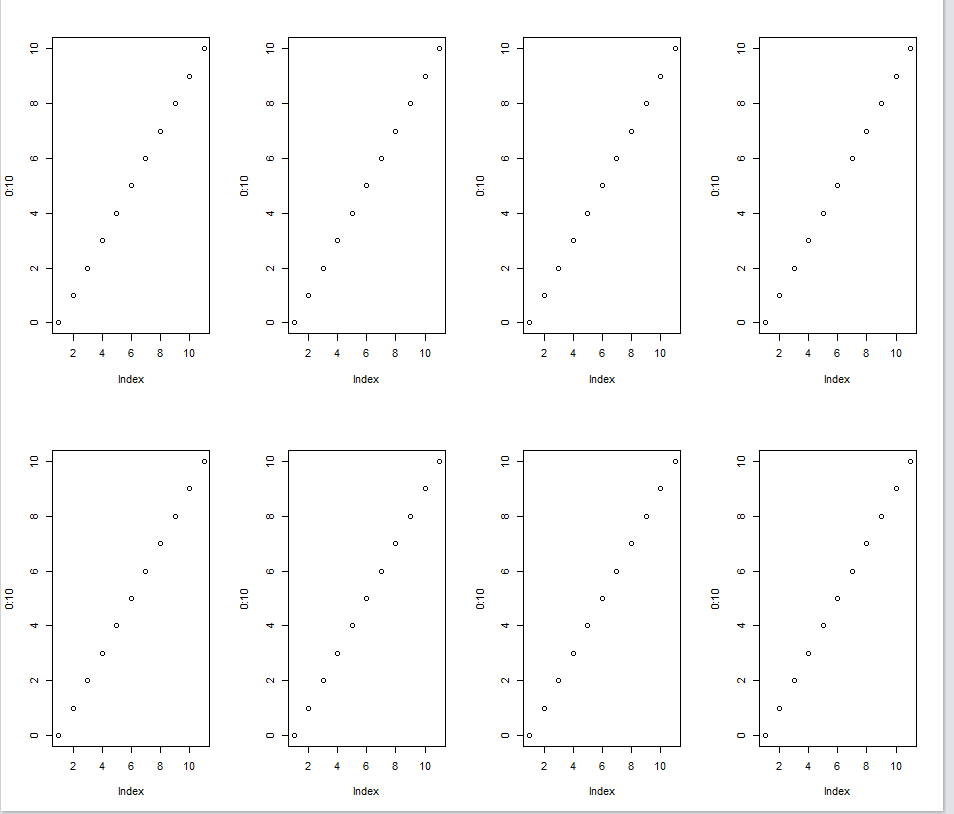
> par(mfrow = c(2,4))    ## 设置为2行4列
> plot(0:10)
> plot(0:10)
> plot(0:10)
> plot(0:10)
> plot(0:10)
> plot(0:10)
> plot(0:10)
> plot(0:10)
> dev.off()          ##关闭绘图
null device
          1
3、利用mfrow VS mfcol
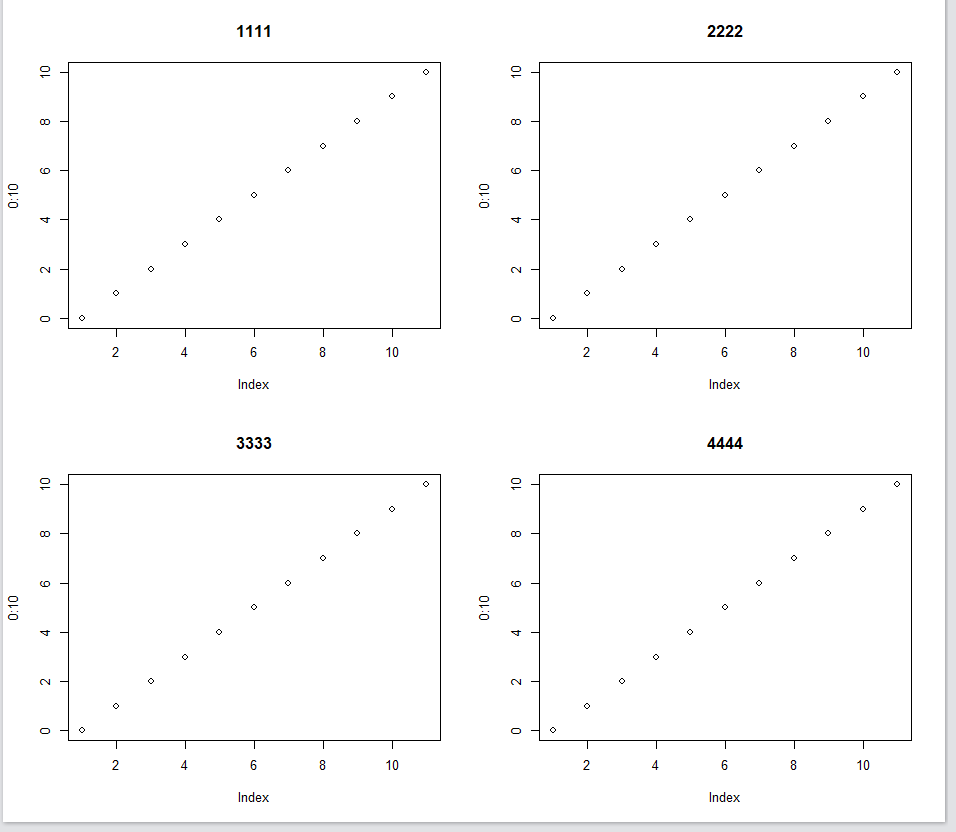
mfrow:先行后列
> par(mfrow = c(2,2))     ## 设置为两行两列
> plot(0:10, main = "1111")
> plot(0:10, main = "2222")
> plot(0:10, main = "3333")
> plot(0:10, main = "4444")
> dev.off()               ## 关闭绘图
null device
          1
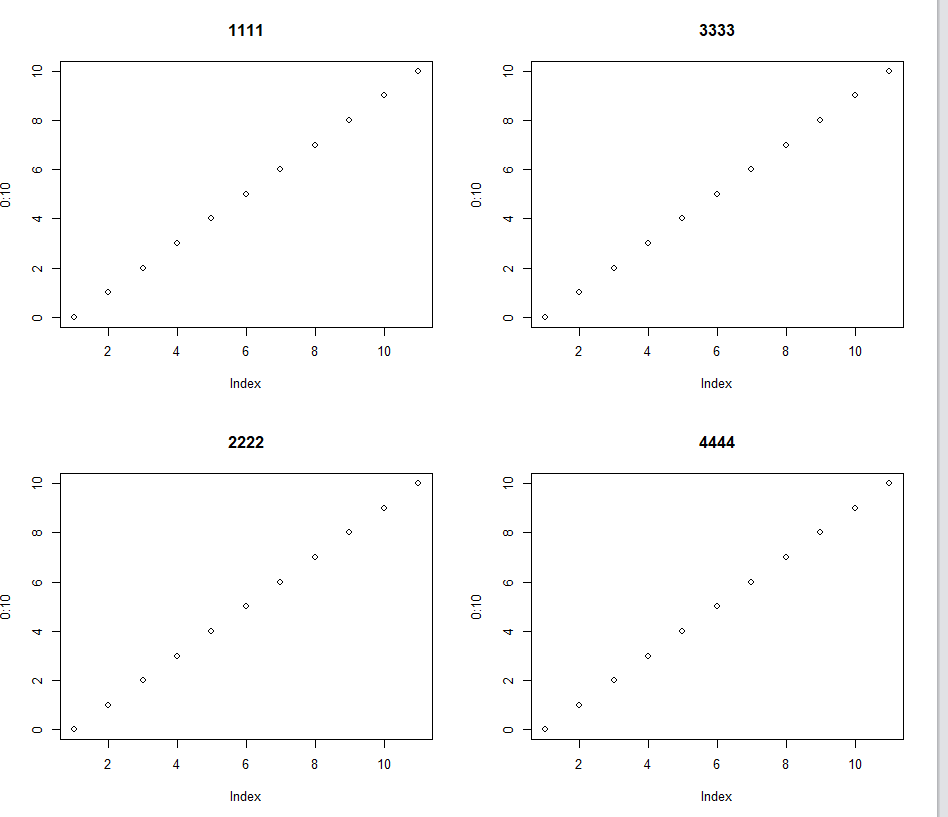
mfcol: 先列后行
> par(mfcol = c(2,2))
> plot(0:10, main = "1111")
> plot(0:10, main = "2222")
> plot(0:10, main = "3333")
> plot(0:10, main = "4444")
> dev.off()
null device
          1


【推荐】国内首个AI IDE,深度理解中文开发场景,立即下载体验Trae
【推荐】编程新体验,更懂你的AI,立即体验豆包MarsCode编程助手
【推荐】抖音旗下AI助手豆包,你的智能百科全书,全免费不限次数
【推荐】轻量又高性能的 SSH 工具 IShell:AI 加持,快人一步
· 震惊!C++程序真的从main开始吗?99%的程序员都答错了
· 【硬核科普】Trae如何「偷看」你的代码?零基础破解AI编程运行原理
· 单元测试从入门到精通
· 上周热点回顾(3.3-3.9)
· winform 绘制太阳,地球,月球 运作规律