
ggplot2绘图调整x轴、y轴标签及刻度标签的大小
1、
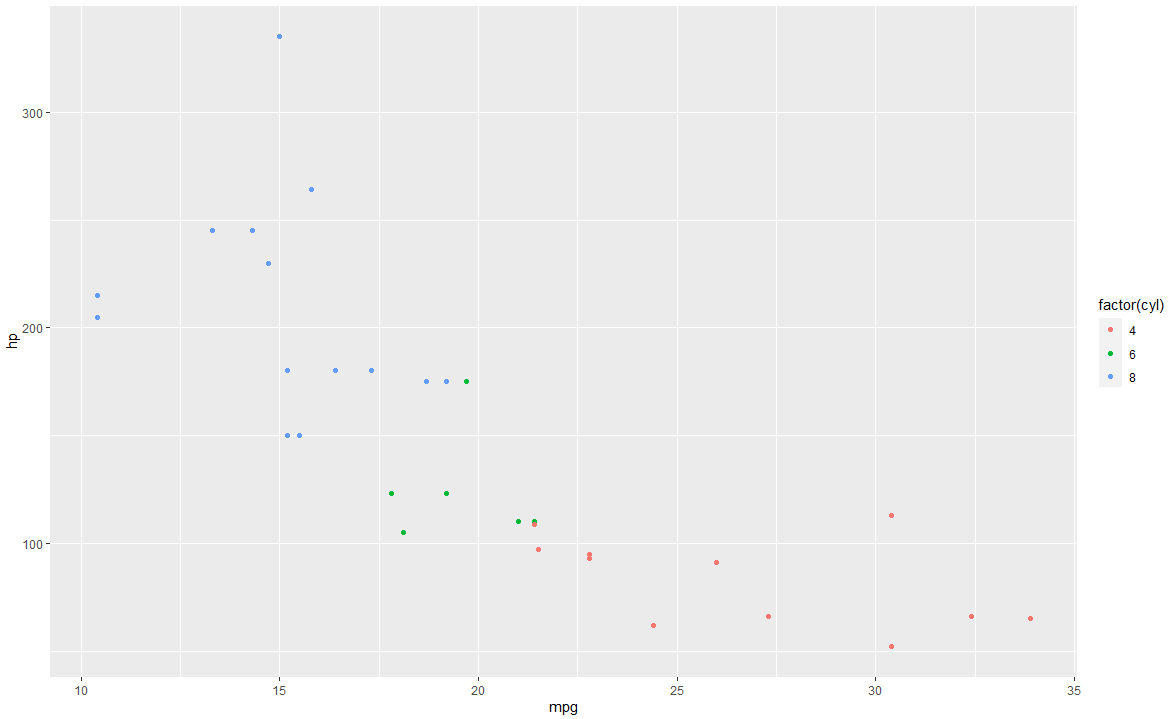
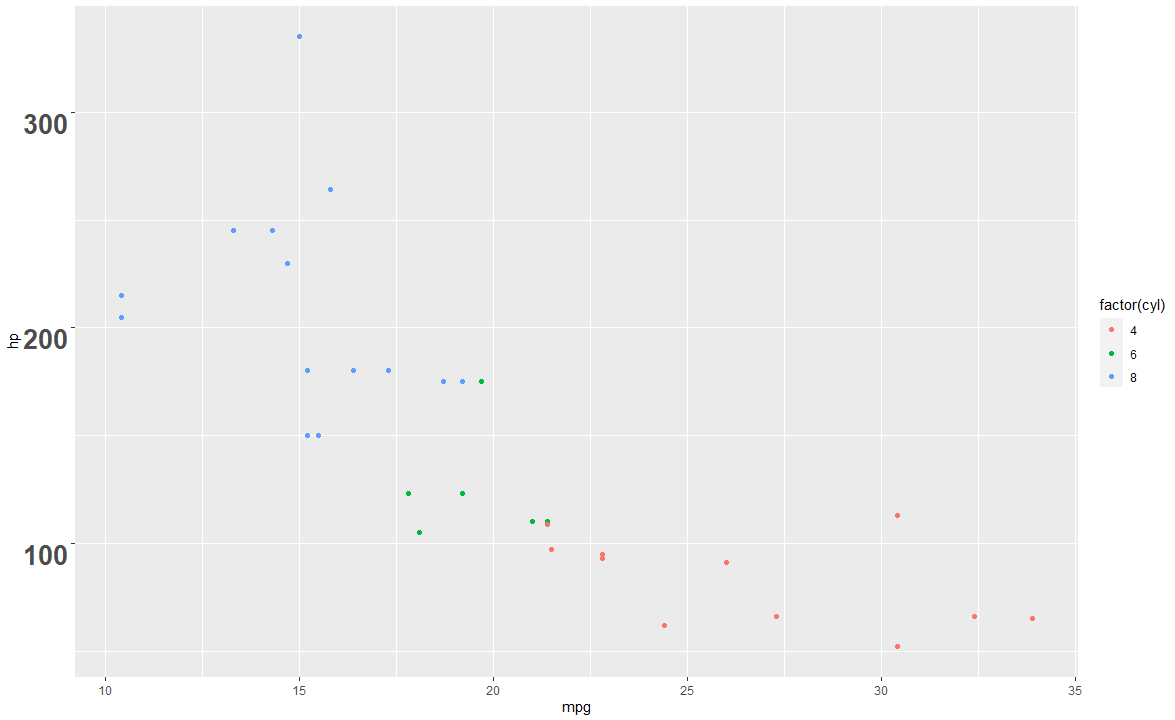
p<-ggplot(mtcars,aes(mpg,hp,colour=factor(cyl)))+geom_point()
p
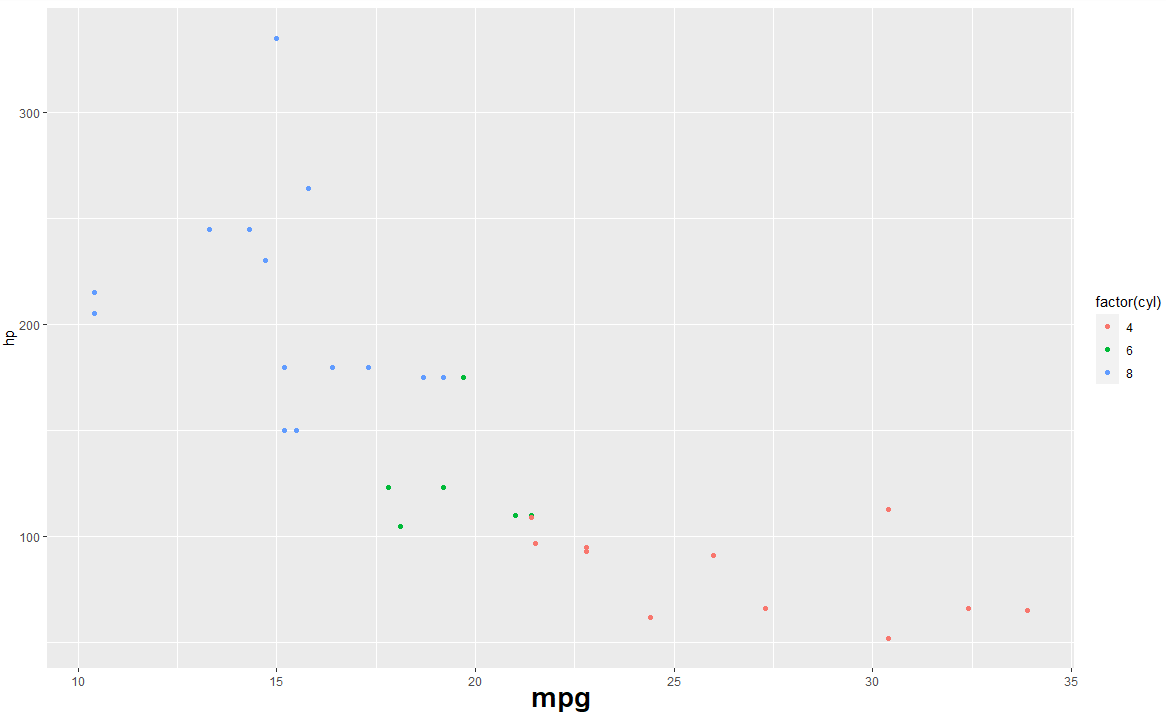
2、调整x轴
p+theme(axis.title.x=element_text(vjust=2, size=20,face = "bold"))
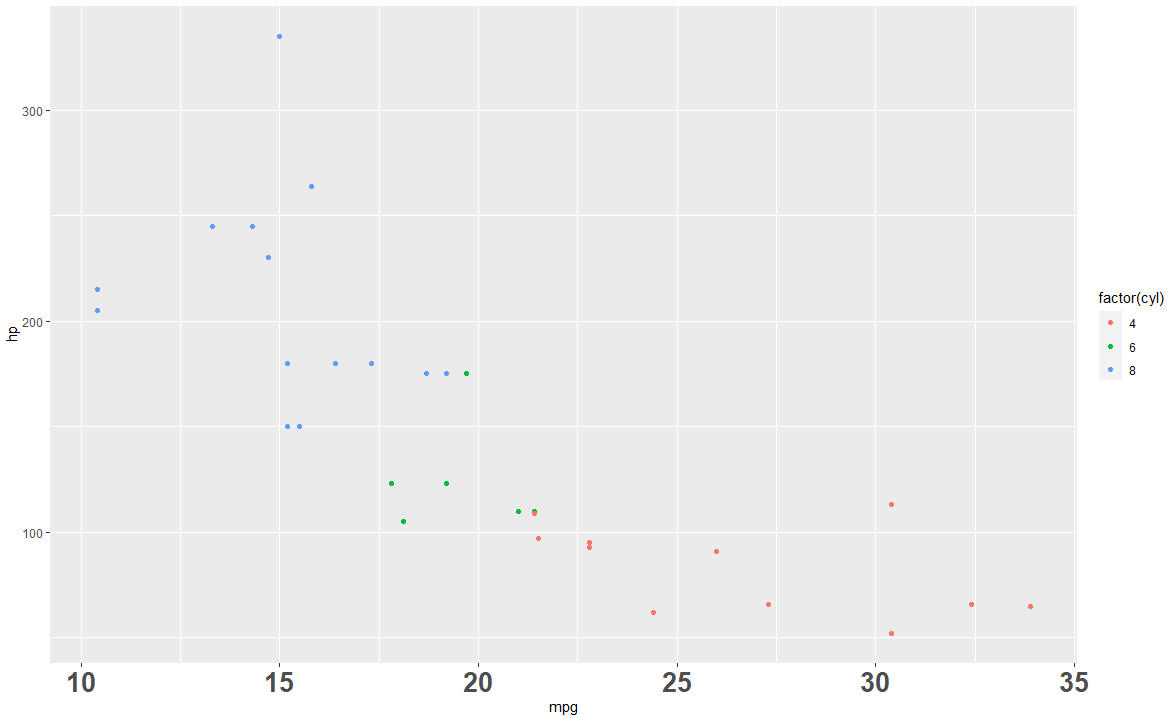
p+theme(axis.text.x=element_text(vjust=1,size=20,face = "bold"))
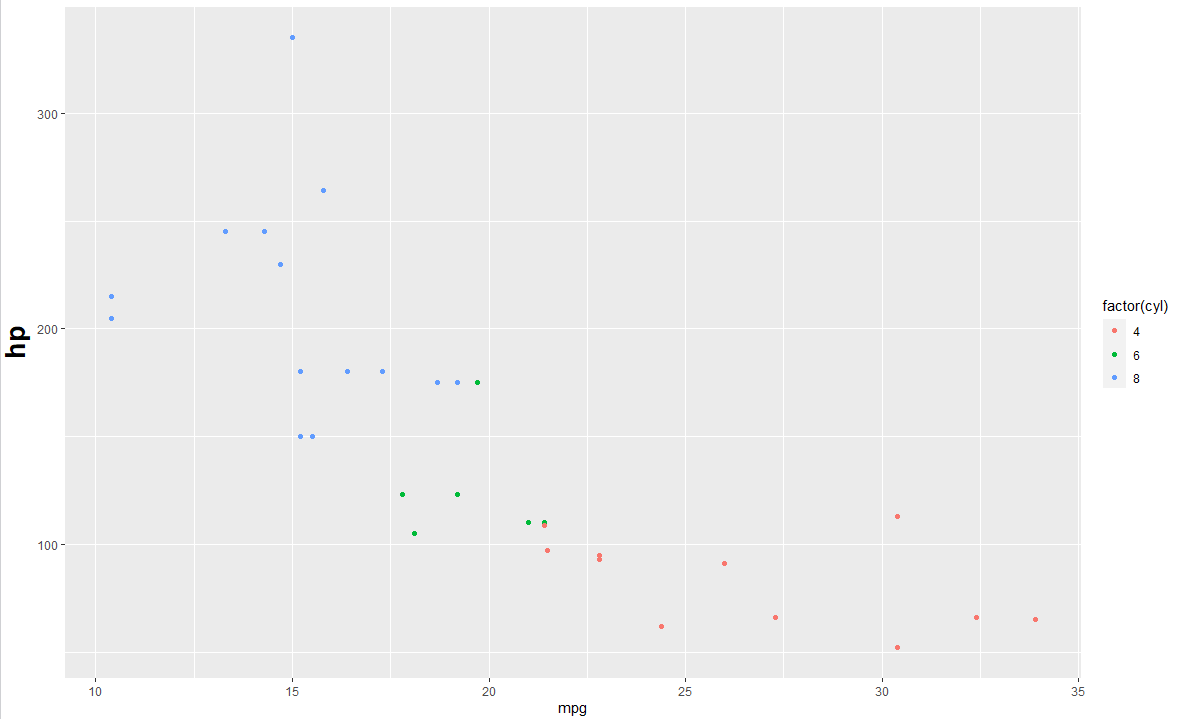
3、调整y轴
p+theme(axis.title.y=element_text(vjust=2, size=20,face = "bold"))
p+theme(axis.text.y=element_text(vjust=1,size=20,face = "bold"))


【推荐】国内首个AI IDE,深度理解中文开发场景,立即下载体验Trae
【推荐】编程新体验,更懂你的AI,立即体验豆包MarsCode编程助手
【推荐】抖音旗下AI助手豆包,你的智能百科全书,全免费不限次数
【推荐】轻量又高性能的 SSH 工具 IShell:AI 加持,快人一步
· 基于Microsoft.Extensions.AI核心库实现RAG应用
· Linux系列:如何用heaptrack跟踪.NET程序的非托管内存泄露
· 开发者必知的日志记录最佳实践
· SQL Server 2025 AI相关能力初探
· Linux系列:如何用 C#调用 C方法造成内存泄露
· 震惊!C++程序真的从main开始吗?99%的程序员都答错了
· 【硬核科普】Trae如何「偷看」你的代码?零基础破解AI编程运行原理
· 单元测试从入门到精通
· 上周热点回顾(3.3-3.9)
· winform 绘制太阳,地球,月球 运作规律