52-Sleuth+Zipkin
1. 分布式链路追踪技术
1.1 适用场景
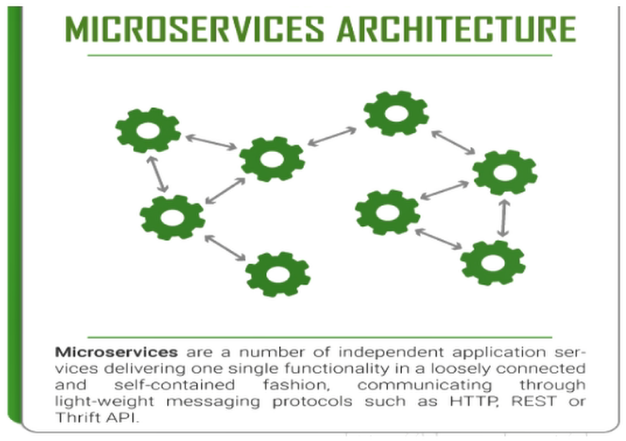
为了支撑日益增长的庞大业务量,我们会使用微服务架构设计我们的系统,使得我们的系统不仅能够通过集群部署抵挡流量的冲击,又能根据业务进行灵活的扩展。
那么,在微服务架构下,一次请求少则经过三四次服务调用完成,多则跨越几十个甚至是上百个服务节点。那么问题接踵而来:
- 如何动态展示服务的调用链路?如 A 服务调用了哪些其他的服务,其依赖关系是怎样的?
- 如何分析服务调用链路中的瓶颈节点并对其进行调优?如 A → B → C 过程中,哪个道服务处理时间特别长?
- 在微服务框架中,一个由客户端发起的请求在后端系统中回经过多个不同的服务节点调用来协同产生最后的请求结果,请求会形成一条复杂的分布式服务调用链路,链路中的任何一环出现高延时或错误都会引起整个请求最后的失败。如何快速进行服务链路的故障发现?
这就是分布式链路追踪技术存在的目的和意义。
1.2 解决方案
如果我们在一个请求的调用处理过程中,在各个链路节点都能够记录下日志,并最终将日志进行集中可视化展示,那么我们想监控调用链路中的一些指标就有希望了!
比如,请求到达哪个服务实例?请求被处理的状态怎样?处理耗时怎样?这些都能够分析出来了 ...
分布式环境下基于这种想法实现的监控技术就是就是分布式链路追踪(全链路追踪)。
分布式链路追踪技术已然成熟,产品也不少,国内外都有,比如:
- Spring Cloud Sleuth + Twitter Zipkin
- Apache Skywalking
- 阿里巴巴的“鹰眼”
- 大众点评的“CAT”
- 美团的“Mtrace”
- 京东的“Hydra”
- 新浪的“Watchman”
1.3 核心思想
本质:记录日志,作为一个完整的技术,分布式链路追踪也有自己的理论和概念。
微服务架构中,针对请求处理的调用链可以展现为一棵树,示意如下:
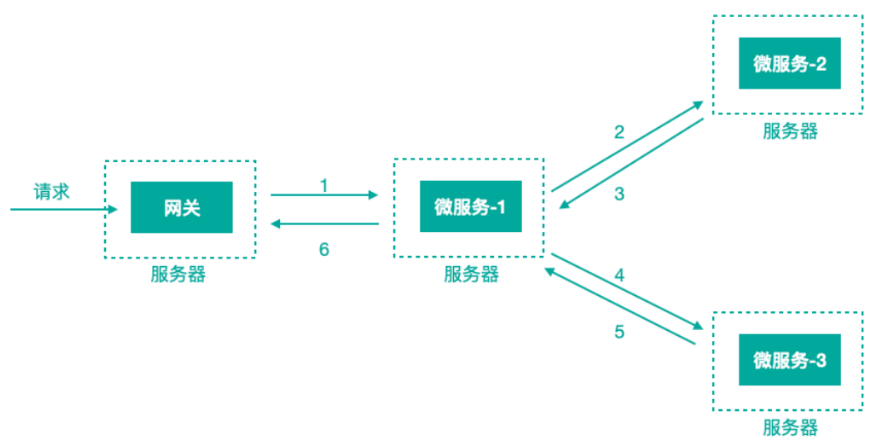
上图描述了一个常见的调用场景,一个请求通过网关服务路由到下游的微服务-1,然后微服务-1调用微服务-2,拿到结果后再调用微服务-3,最后组合微服务-2和微服务-3的结果,通过网关返回给用户。
为了追踪整个调用链路,肯定需要记录日志,日志记录是基础,在此之上肯定有一些理论概念,当下主流的的分布式链路追踪技术/系统所基于的理念都来自于 Google 的一篇论文《Dapper, a Large-Scale Distributed Systems Tracing Infrastructure》,这里面涉及到的核心理念是什么,我们来看下,还以前面的服务调用来说:

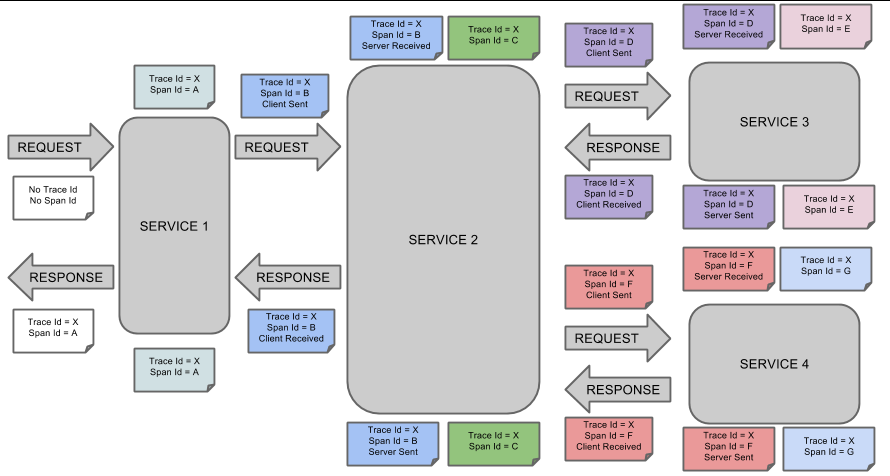
上图标识一个请求链路,一条链路通过 TraceId 唯一标识,Span 标识发起的请求信息,各 Span 通过 parrentId 关联起来。
一个 Trace 由一个或者多个 Span 组成,每一个 Span 都有一个 SpanId,Span 中会记录 TraceId,同时还有一个叫做 ParentId,指向了另外一个 Span 的 SpanId,表明父子关系,其实本质表达了依赖关系。
Span ID:为了统计各处理单元的时间延迟,当请求到达各个服务组件时,也是通过一个唯一标识 Span ID 来标记它的开始,具体过程以及结束。对每一个 Span 来说,它必须有开始和结束两个节点,通过记录开始 Span 和结束 Span 的时间戳,就能统计出该 Span 的时间延迟,除了时间戳记录之外,它还可以包含一些其他元数据,比如时间名称、请求信息等。
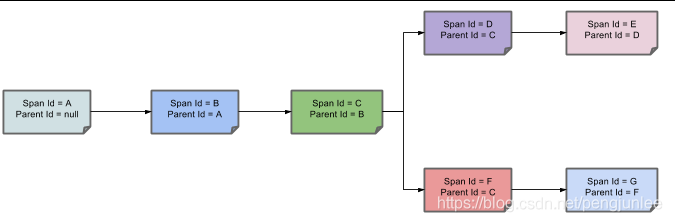
每一个 Span 都会有一个唯一跟踪标识 Span ID,若干个有序的 Span 就组成了一个 trace。
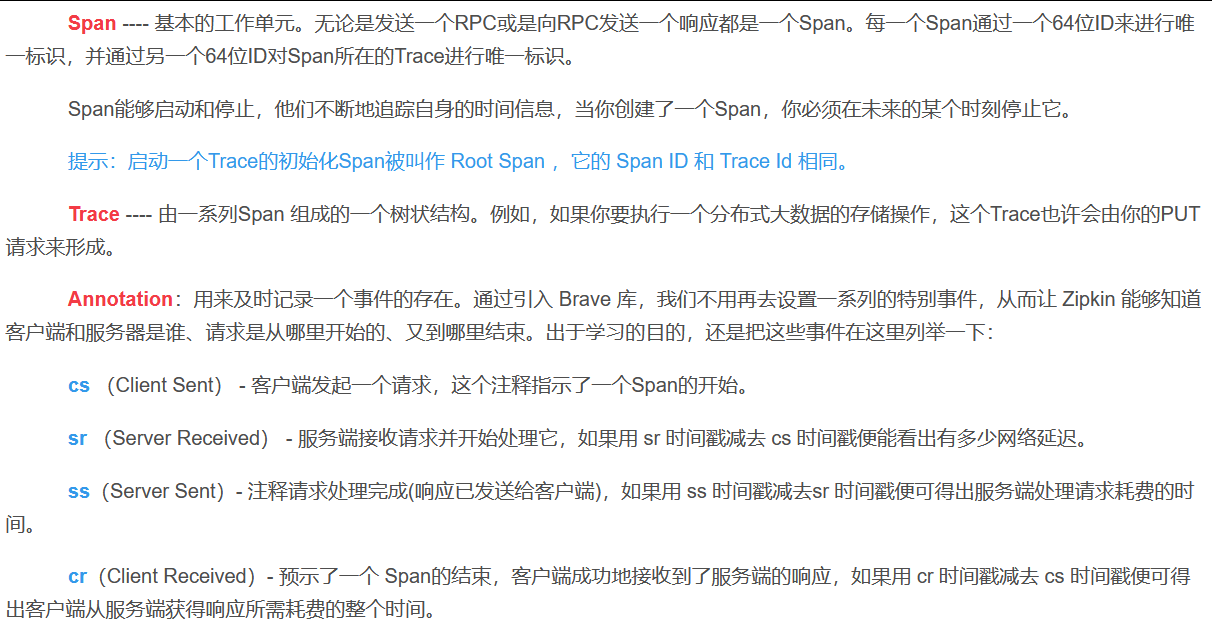
Span 可以认为是一个日志数据结构,在一些特殊的时机点会记录了一些日志信息,比如有时间戳、spanId、TraceId,parentId 等,Span 中也抽象出了另外一个概念,叫做「事件」,核心事件如下:
| 事件 | 描述 | 时间延迟 |
|---|---|---|
| CS(Client Send/Start) | 客户端/消费者发出一个请求,描述的是一个 Span 开始。 | / |
| SR(Server Received/Start) | 服务端/生产者接收请求 | SR-CS 请求发送的网络延迟 |
| SS(Server Send/Finish) | 服务端/生产者发送应答 | SS-SR 服务端消耗时间 |
| CR(Client Received/Finished) | 客户端/消费者接收应答 | CR-SS 回复需要的时间(响应的网络延迟) |
2. Sleuth+Zipkin
2.1 概述
Spring Cloud Sleuth (追踪服务框架)可以追踪服务之间的调用,Sleuth 可以记录一个服务请求经过哪些服务、服务处理时长等,根据这些,我们能够理清各微服务间的调用关系及进行问题追踪分析。
- 耗时分析:通过 Sleuth 了解采样请求的耗时,分析服务性能问题(哪些服务调用比较耗时);
- 链路优化:发现频繁调用的服务,针对性优化等;
Sleuth 就是通过记录日志的方式来记录踪迹数据的,提供了一套完整的服务跟踪的解决方案,并且兼容支持了 zipkin。
我们往往把 Spring Cloud Sleuth 和 Zipkin 一起使用,把 Sleuth 的数据信息发送给 Zipkin 进行聚合,利用 Zipkin 存储并展示数据。
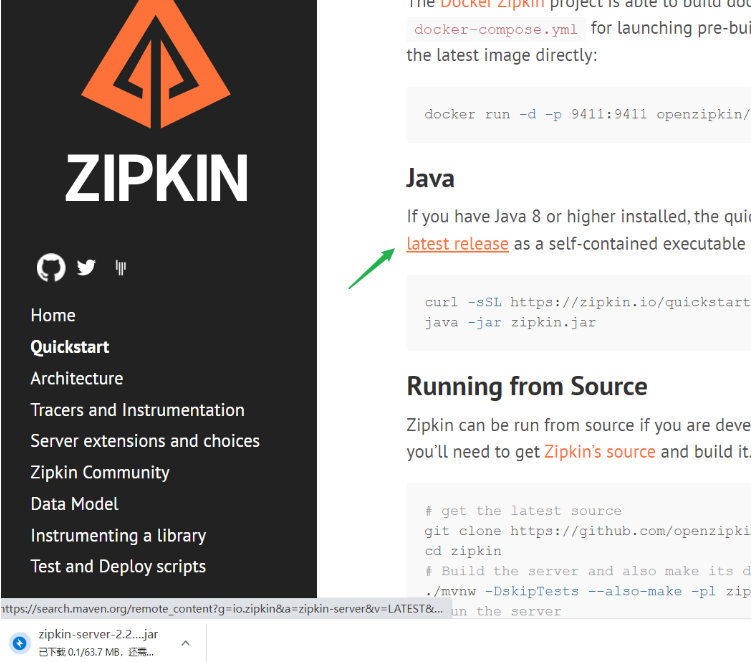
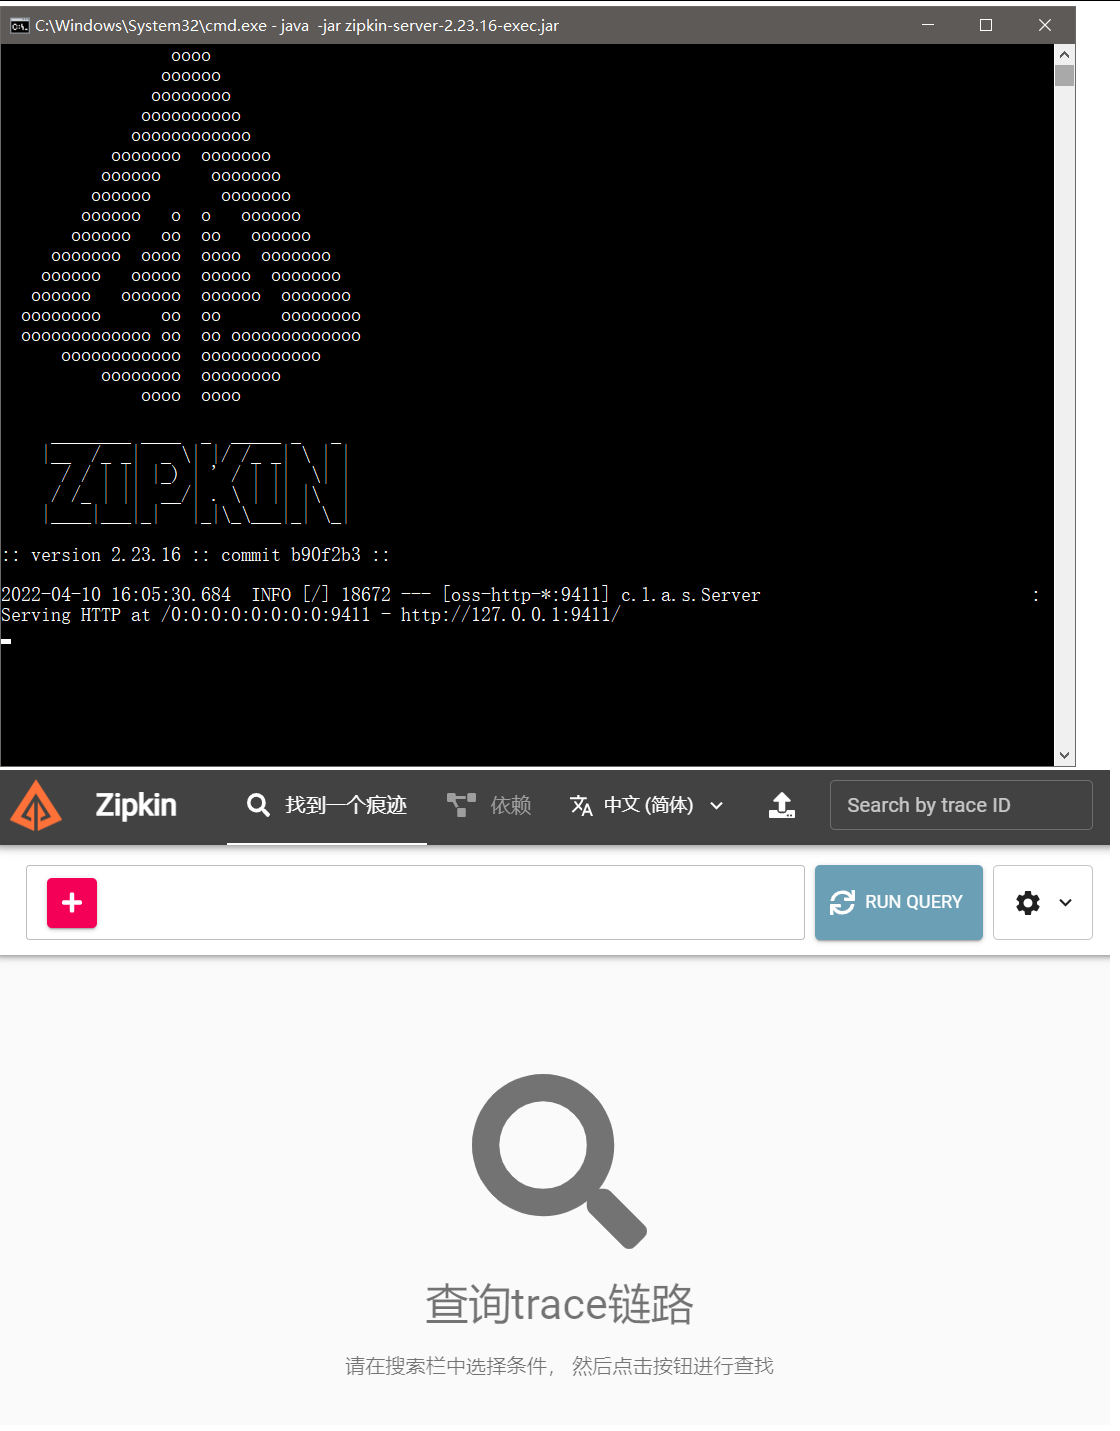
cmd 里 java -jar 运行起来后,访问 http://localhost:9411/zipkin 即可。
为什么能够进行整条链路的追踪?
其实就是一个 Trace ID 将 一连串的 Span 信息连起来了。根据 Span 记录的信息再进行整合就可以获取整条链路的信息。下面是链路追踪的核心概念:
一条请求链路通过 Trace ID 唯一标识,链路追踪会在每个服务调用的时候加上 Trace ID 和 Span ID。如下图所示:
下图展示了父子关系的 Span 的调用链路:
2.2 架构
a. Overview
Tracers live in your applications and record timing and metadata about operations that took place. They often instrument libraries, so that their use is transparent to users. For example, an instrumented web server records when it received a request and when it sent a response. The trace data collected is called a Span.
Instrumentation is written to be safe in production and have little overhead. For this reason, they only propagate IDs in-band, to tell the receiver there’s a trace in progress. Completed spans are reported to Zipkin out-of-band, similar to how applications report metrics asynchronously.
For example, when an operation is being traced and it needs to make an outgoing http request, a few headers are added to propagate IDs. Headers are not used to send details such as the operation name.
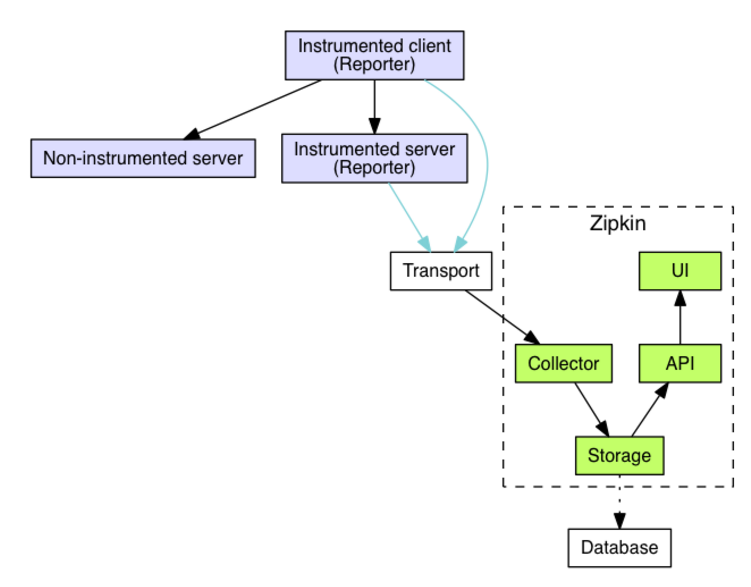
The component in an instrumented app that sends data to Zipkin is called a Reporter. Reporters send trace data via one of several transports to Zipkin collectors, which persist trace data to storage. Later, storage is queried by the API to provide data to the UI.
Here’s a diagram describing this flow:
b. Example
As mentioned in the overview, identifiers are sent in-band and details are sent out-of-band to Zipkin. In both cases, trace instrumentation is responsible for creating valid traces and rendering them properly. For example, a tracer ensures parity between the data it sends in-band (downstream) and out-of-band (async to Zipkin).
Here’s an example sequence of http tracing where user code calls the resource /foo. This results in a single span, sent asynchronously to Zipkin after user code receives the http response.
┌─────────────┐ ┌───────────────────────┐  ┌─────────────┐  ┌──────────────────┐
│ User Code   │ │ Trace Instrumentation │  │ Http Client │  │ Zipkin Collector │
└─────────────┘ └───────────────────────┘  └─────────────┘  └──────────────────┘
       │                 │                         │                 │
           ┌─────────┐
       │ ──┤GET /foo ├─▶ │ ────┐                   │                 │
           └─────────┘         │ record tags
       │                 │ ◀───┘                   │                 │
                           ────┐
       │                 │     │ add trace headers │                 │
                           ◀───┘
       │                 │ ────┐                   │                 │
                               │ record timestamp
       │                 │ ◀───┘                   │                 │
                             ┌─────────────────┐
       │                 │ ──┤GET /foo         ├─▶ │                 │
                             │X-B3-TraceId: aa │     ────┐
       │                 │   │X-B3-SpanId: 6b  │   │     │           │
                             └─────────────────┘         │ invoke
       │                 │                         │     │ request   │
                                                         │
       │                 │                         │     │           │
                                 ┌────────┐          ◀───┘
       │                 │ ◀─────┤200 OK  ├─────── │                 │
                           ────┐ └────────┘
       │                 │     │ record duration   │                 │
            ┌────────┐     ◀───┘
       │ ◀──┤200 OK  ├── │                         │                 │
            └────────┘       ┌────────────────────────────────┐
       │                 │ ──┤ asynchronously report span     ├────▶ │
                             │                                │
                             │{                               │
                             │  "traceId": "aa",              │
                             │  "id": "6b",                   │
                             │  "name": "get",                │
                             │  "timestamp": 1483945573944000,│
                             │  "duration": 386000,           │
                             │  "annotations": [              │
                             │--snip--                        │
                             └────────────────────────────────┘
Trace instrumentation report spans asynchronously to prevent delays or failures relating to the tracing system from delaying or breaking user code.
c. Transport
Spans sent by the instrumented library must be transported from the services being traced to Zipkin collectors. There are three primary transports: HTTP, Kafka and Scribe.
d. Components
(1)collector
Once the trace data arrives at the Zipkin collector daemon, it is validated, stored, and indexed for lookups by the Zipkin collector.
(2)storage
Zipkin was initially built to store data on Cassandra since Cassandra is scalable, has a flexible schema, and is heavily used within Twitter. However, we made this component pluggable. In addition to Cassandra, we natively support ElasticSearch and MySQL. Other back-ends might be offered as third party extensions.
(3)search
Once the data is stored and indexed, we need a way to extract it. The query daemon provides a simple JSON API for finding and retrieving traces. The primary consumer of this API is the Web UI.
(4)web UI
We created a GUI that presents a nice interface for viewing traces. The web UI provides a method for viewing traces based on service, time, and annotations. Note: there is no built-in authentication in the UI!
3. 案例
3.1 被追踪微服务引入 Sleuth
(1)在每个需要被追踪踪迹的微服务上都引入如下依赖;
pom.xml
<!-- 包含了sleuth+zipkin -->
<dependency>
    <groupId>org.springframework.cloud</groupId>
    <artifactId>spring-cloud-starter-zipkin</artifactId>
</dependency>
(2)application.yml
spring:
  application:
    name: cloud-payment-service
  zipkin:
    base-url: http://localhost:9411
    discovery-client-enabled: false  # 不要让Nacos把zipkin注册进去(可以不写)
  sleuth:
    sampler:
      probability: 1
# 添加日志级别
logging:
  level:
    org.springframework.web.servlet.DispatcherServlet: debug
    org.springframework.cloud.sleuth: debug
请求到来时,在控制台可以观察到 Sleuth 输出的日志(全局 TraceId、SpanId 等)。但这样的日志首先不容易阅读观察,另外日志分散在各个微服务服务器上,接下来我们使用 Zipkin 统一聚合轨迹日志并进行存储展示。
3.2 结合 Zipkin 展示追踪数据
Zipkin 包括 Zipkin Server 和 Zipkin Client 两部分,Zipkin Server 是一个单独的服务,Zipkin Client 就是具体的微服务 。
a. Zipkin Server
(1)新建工程,导入依赖;
<artifactId>cloud-zipkin-server-9411</artifactId>

<dependencies>
    <!--zipkin-server 的依赖坐标-->
    <dependency>
        <groupId>io.zipkin.java</groupId>
        <artifactId>zipkin-server</artifactId>
        <version>2.12.3</version>
        <exclusions>
            <!--排除掉log4j2的传递依赖,避免和springboot依赖的日志组件冲突-->
            <exclusion>
                <groupId>org.springframework.boot</groupId>
                <artifactId>spring-boot-starter-log4j2</artifactId>
            </exclusion>
        </exclusions>
    </dependency>

    <!--zipkin-server UI 界面依赖坐标-->
    <dependency>
        <groupId>io.zipkin.java</groupId>
        <artifactId>zipkin-autoconfigure-ui</artifactId>
        <version>2.12.3</version>
    </dependency>

    <!--zipkin 针对 MySQL 持久化的依赖-->
    <dependency>
        <groupId>io.zipkin.java</groupId>
        <artifactId>zipkin-autoconfigure-storage-mysql</artifactId>
        <version>2.12.3</version>
    </dependency>

    <dependency>
        <groupId>mysql</groupId>
        <artifactId>mysql-connector-java</artifactId>
    </dependency>

    <dependency>
        <groupId>com.alibaba</groupId>
        <artifactId>druid-spring-boot-starter</artifactId>
        <version>1.1.10</version>
    </dependency>

    <!--操作数据库需要事务控制-->
    <dependency>
        <groupId>org.springframework</groupId>
        <artifactId>spring-tx</artifactId>
    </dependency>

    <dependency>
        <groupId>org.springframework</groupId>
        <artifactId>spring-jdbc</artifactId>
    </dependency>
</dependencies>
(2)主启动类
@SpringBootApplication
@EnableZipkinServer // <=[开启 Zipkin 服务器功能]
public class ZipkinServerApplication9411 {

    public static void main(String[] args) {
        SpringApplication.run(ZipkinServerApplication9411.class,args);
    }

    @Bean // 注入事务控制器
    public PlatformTransactionManager transactionManager(DataSource dataSource) {
        return new DataSourceTransactionManager(dataSource);
    }
}
(3)application.yml
server:
  port: 9411
management:
  metrics:
    web:
      server:
        auto-time-requests: false # 关闭自动检测
spring:
  datasource:
    driver-class-name: com.mysql.jdbc.Driver
    url: jdbc:mysql://localhost:3306/zipkin?useUnicode=true&characterEncoding=utf-8&useSSL=false&allowMultiQueries=true
    username: root
    password: 123456
    druid:
      initialSize: 10
      minIdle: 10
      maxActive: 30
      maxWait: 50000
# 指定zipkin持久化介质为mysql
zipkin:
  storage:
    type: mysql
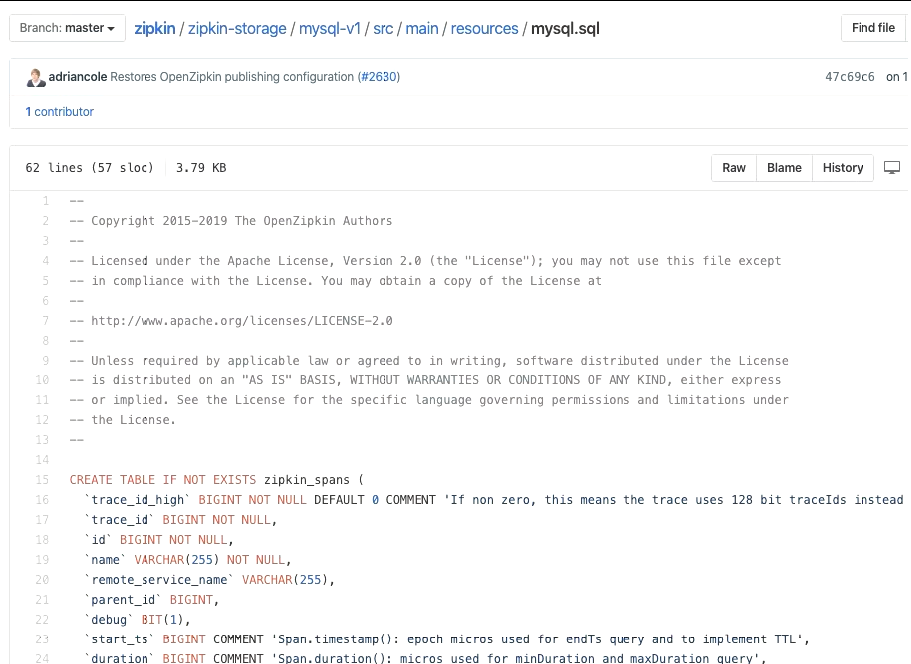
(4)追踪数据持久化到 MySQL:创建名称为 zipkin 的数据库,并执行官方提供的 sql 语句。
b. Zipkin Client
(1)spring-cloud-starter-zipkin 中包含了对 Zipkin 的依赖;所以不必再显式依赖 spring-cloud-starter-zipkin;
(2)application.yml 中添加对 Zipkin Server 的引用;
zipkin:
  base-url: http://127.0.0.1:9411/ # zipkin server 的请求地址
  sender:
    type: web # 请求方式,默认以 http 方式向 zipkin server 发送追踪数据
sleuth:
  sampler:
    # 采样的百分比,默认为 0.1,即 10%,这里配置 1,是记录全部的 sleuth
    # 信息,这是为了收集到更多的数据(仅供测试用)。在分布式系统中,过于
    # 频繁的采样会影响系统性能,所以这里的配置需要采用一个合适的值。
    probability: 1.0
另外,对于 log 日志,依然保持开启 debug 的状态。
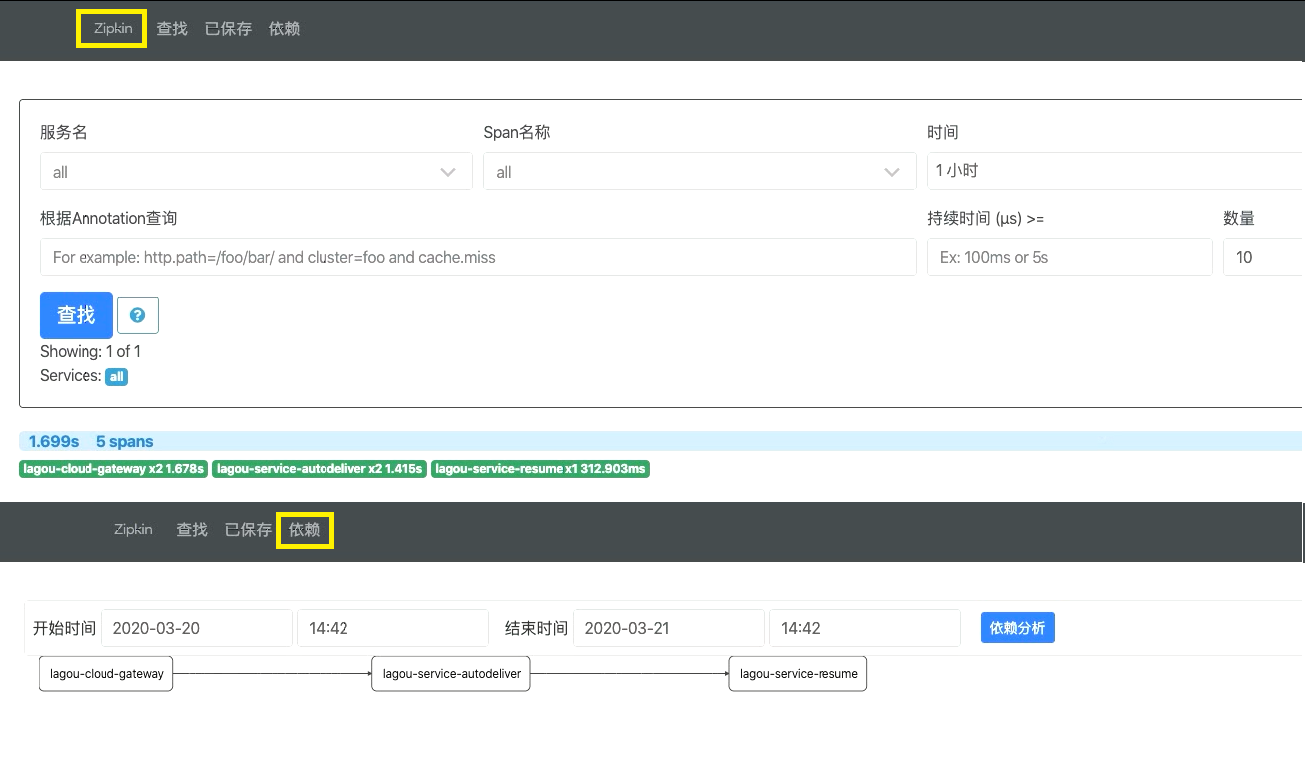
发起请求后,查看 zipkin 的界面: