Echarts中axislabel文字过长导致显示不全或重叠
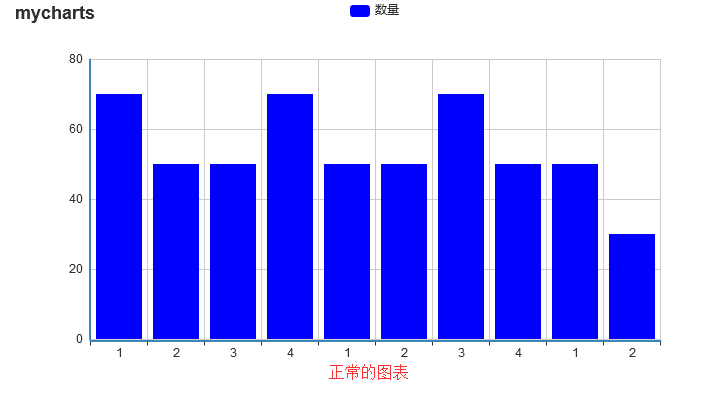
最近在使用Echarts的时候,遇到点问题就是xAxis文字过长导致x轴的文字显示不全.


解决方案如下:
 1 <!DOCTYPE HTML PUBLIC "-//W3C//DTD HTML 4.01 Transitional//EN"><html>
 2 <HEAD>
 3 <TITLE>my_echarts</TITLE>
 4 <META HTTP-EQUIV="Content-Type" CONTENT="text/html; charset=utf-8">
 5 </HEAD>
 6 <body topmargin="0">
 7 <table id="outer" width="100%" >
 8           <tr>
 9             <td align="center">
10         <div id="my_echart" style="width:730;height:400px;"></div>
11         </td>
12           </tr>
13      </table>
14 </body>
15 <script type="text/javascript" src="echarts-all.js"></script>
16 <script language="javascript">
17
18 function init_my_echarts() {
19     var mycharts = echarts.init(document.getElementById('my_echart'));
20     alert("init_virus_echarts");
21     var option = {
22     title : {
23         text: 'mycharts',
24         subtext: ''
25     },
26     tooltip : {
27         trigger: 'axis'
28     },
29     legend: {
30         data:['数量']
31     },
32     toolbox: {
33         show : true,
34     },
35     calculable : false,
36     xAxis : [
37         {
38             type : 'category',
39             axisLabel:{
40                     interval:0,
41                     rotate:45,
42                     margin:2,
43                     textStyle:{
44                              color:"#222"
45                     }},
46             data : ['我是不正常图表','2','3','4','1','2','3','4','1','2']
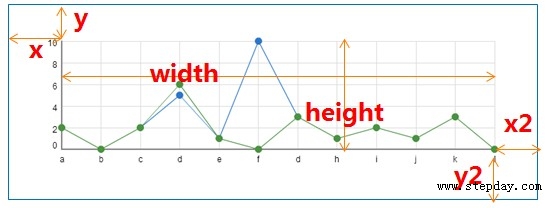
47         }
48     ],
49      grid: { // 控制图的大小,调整下面这些值就可以,
50              x: 40,
51              x2: 100,
52              y2: 150// y2可以控制 X轴跟Zoom控件之间的间隔,避免以为倾斜后造成 label重叠到zoom上
53     },
54     yAxis : [
55         {
56             type : 'value'
57         }
58     ],
59     series : [
60         {
61             name:'数量',
62             type:'bar',
63             barMaxWidth:100,
64             data:[70,50,50,70,50,50,70,50,50,30],
65             itemStyle:{
66                            normal:{
67                                           color:'#0000ff'
68                                 }
69                         }
70         }
71     ]
72   };
73     mycharts.setOption(option);
74 }
75 setTimeout("init_my_echarts()", 100);
76 </script>
77 </html>

关于这张图片(图片是在www.stepday.com网站上下载的一张图片,不会作图借用一下.)标注了:x y x2 y2的距离:


【推荐】国内首个AI IDE,深度理解中文开发场景,立即下载体验Trae
【推荐】编程新体验,更懂你的AI,立即体验豆包MarsCode编程助手
【推荐】抖音旗下AI助手豆包,你的智能百科全书,全免费不限次数
【推荐】轻量又高性能的 SSH 工具 IShell:AI 加持,快人一步
· 10年+ .NET Coder 心语,封装的思维:从隐藏、稳定开始理解其本质意义
· .NET Core 中如何实现缓存的预热?
· 从 HTTP 原因短语缺失研究 HTTP/2 和 HTTP/3 的设计差异
· AI与.NET技术实操系列:向量存储与相似性搜索在 .NET 中的实现
· 基于Microsoft.Extensions.AI核心库实现RAG应用
· TypeScript + Deepseek 打造卜卦网站:技术与玄学的结合
· 阿里巴巴 QwQ-32B真的超越了 DeepSeek R-1吗?
· 【译】Visual Studio 中新的强大生产力特性
· 10年+ .NET Coder 心语 ── 封装的思维:从隐藏、稳定开始理解其本质意义
· 【设计模式】告别冗长if-else语句:使用策略模式优化代码结构