文献分析 Squidpy: a scalable framework for spatial single cell analysis
|
|
Prograss
|
Challenge
|
demand
|
|
background
|
Dissociation-based single cell technologies
|
cellular diversity constitutes tissue organization
|
|
|
Spatially-resolved molecular technologies
|
acquire data in greatly diverse forms
|
development of interoperable and broad analysis methods;
solutions both in terms of efficient data representation as well as comprehensive analysis and visualization methods
|
|
|
existing analysis frameworks
|
lack of a unified data representation and modular API
|
community-driven scalable analysis of both spatial neighborhood graph and image, along with an interactive visualization module
|
|
|
solve
|
what
|
how
|
effect
|
|
Squidpy, a Python framework ( Spatial Quantification of Molecular Data in Python)
|
brings together tools from omics and image analysis;
built on top of Scanpy and Anndata
|
scalable description of spatial molecular data
store + manipulate + interactively
a common data representation
a common set of analysis and interactive visualization tools
|
|
|
result
|
Squidpy provides technology-agnostic data representations for spatial graphs and imagesa neighborhood graph from spatial coordinates
large source images : Image Container
 |
||
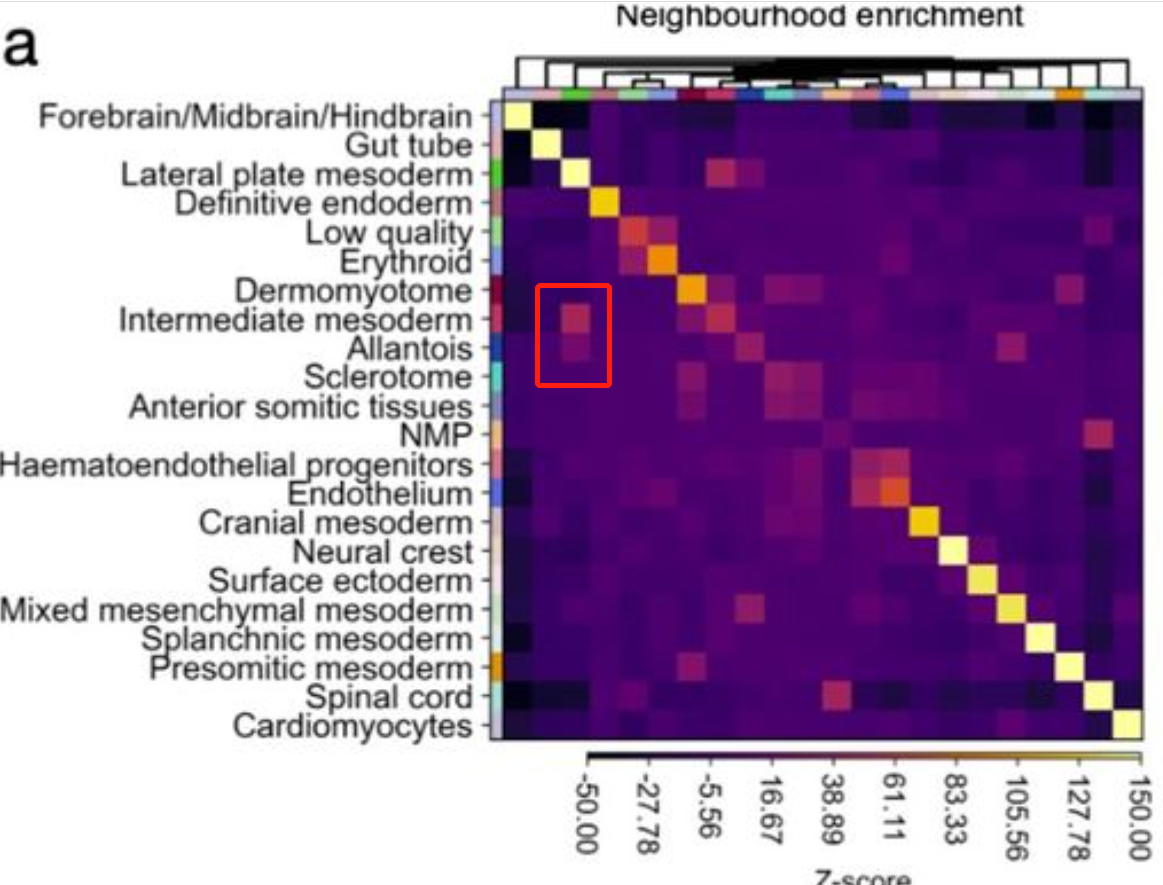
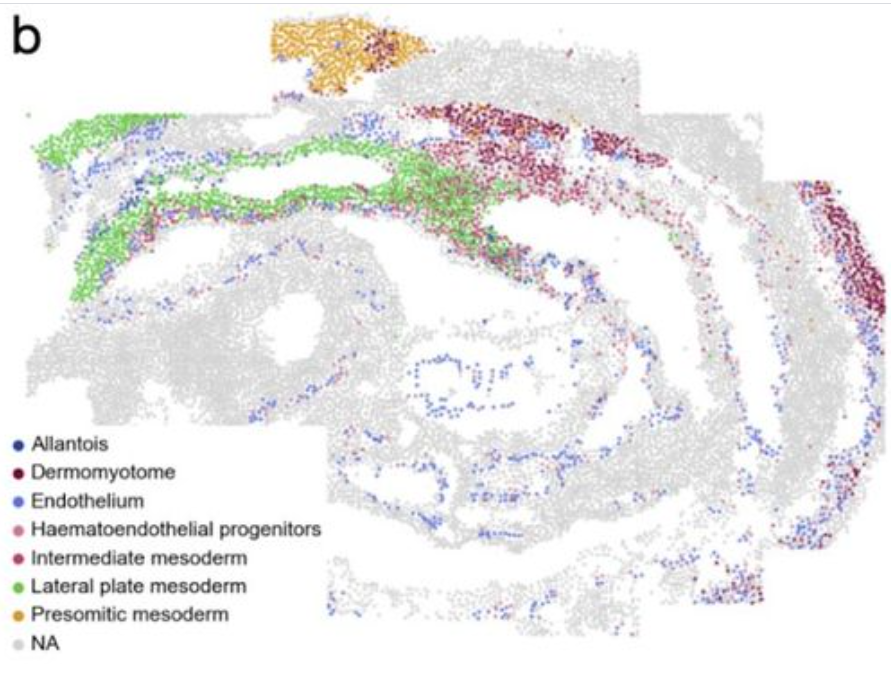
Squidpy enables calculation of spatial cellular statistics using spatial graphsneighborhood enrichment analysis : cluster is co-enriched
several clusters to be co-enriched in their cellular neighbors
  ---------------------------------------------------------------------------------------------------------------
computes a co-occurrence score for clusters : subcellular measurements
 The cluster “Nucleolus” is found to be co-enriched at short distances with the “Nucleus” and the “Nuclear envelope” clusters.
a fast and broader implementation of CellPhoneDB
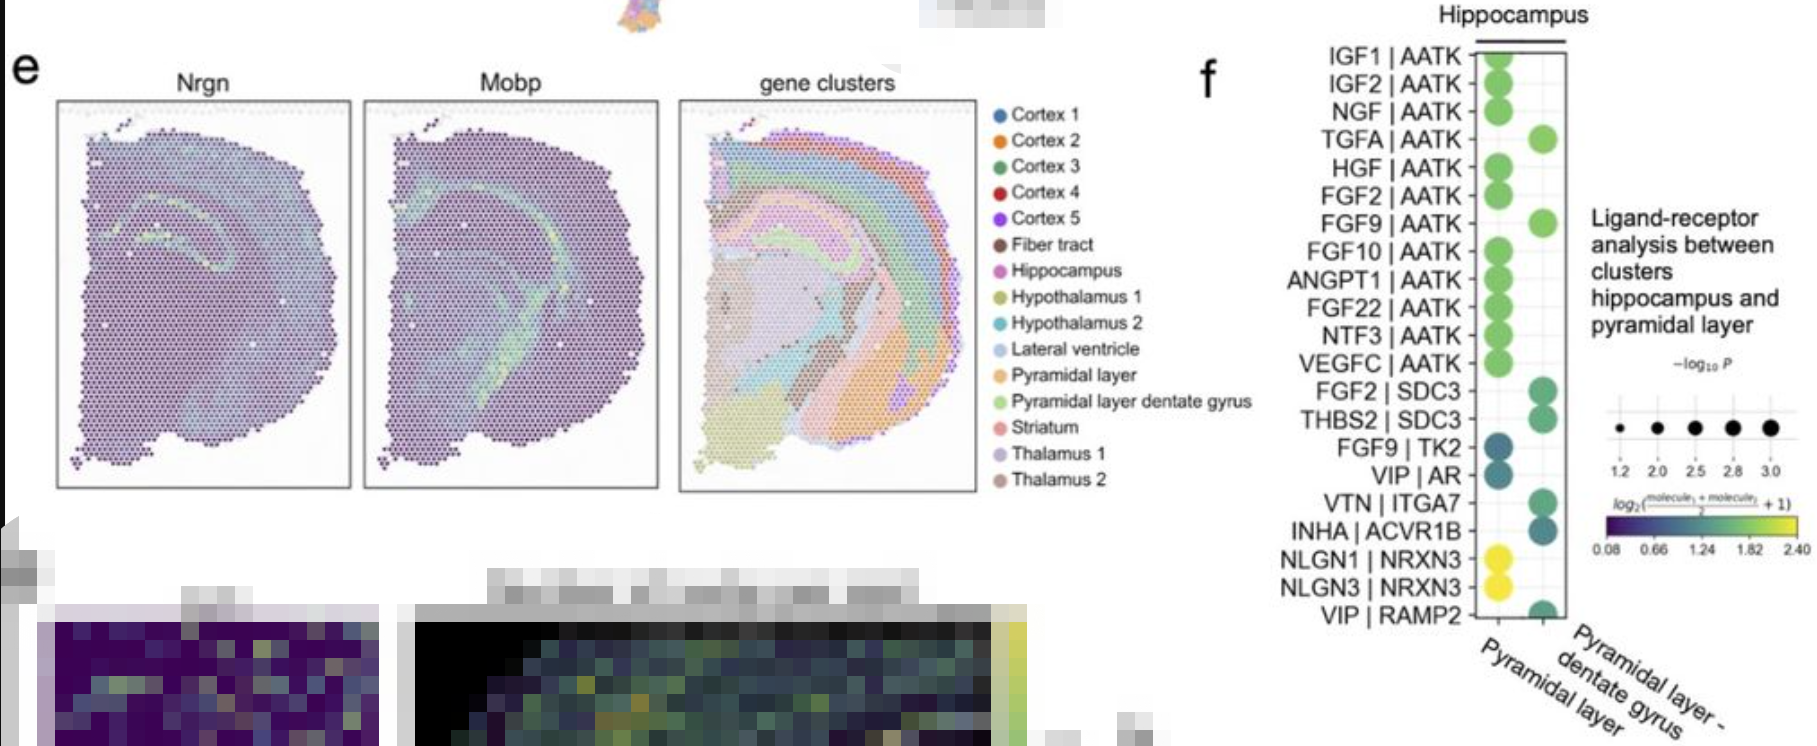 Ligand-receptor interactions from the cluster “Hippocampus” to clusters “Pyramidal Layer” and “Pyramidal layer dentate gyrus”. Shown are a subset of significant ligand-receptor pairs queried using Omnipath database.
------------
Ripley’s K function
----------
average clustering
----------
degree and closeness centrality
|
|||
|
Squidpy allows analysis of images in spatial omics analysis workflows
an example of segmentation-based features
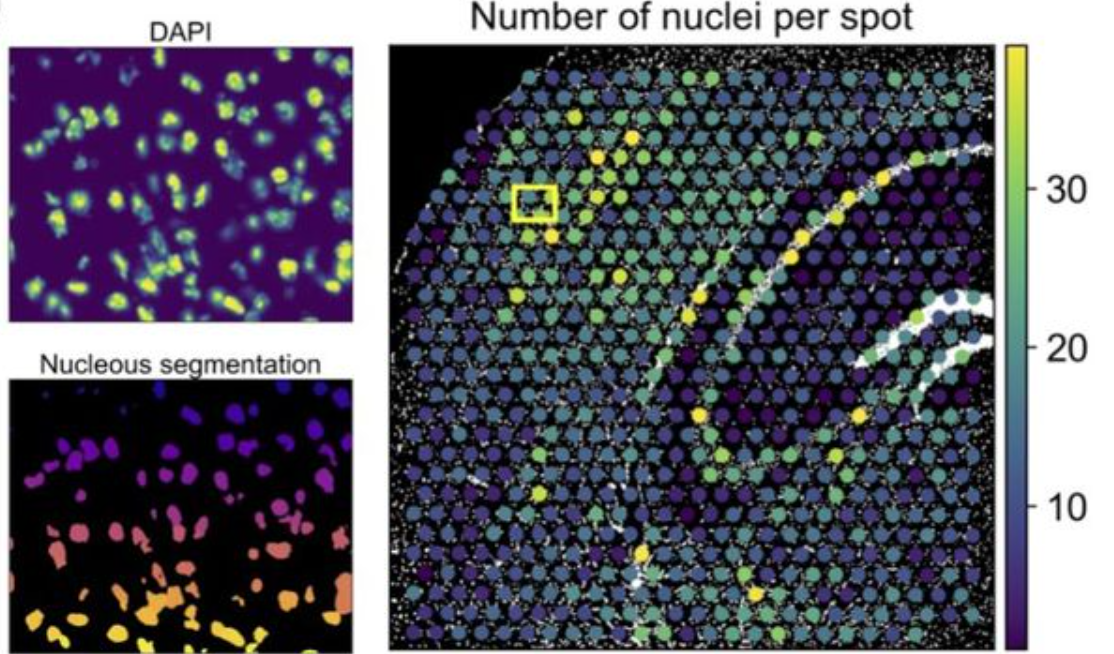 --------------------------------------------------------------------------------------------------------------------------------------
feature extraction pipeline enables direct comparison and joint analysis of image data and omics data
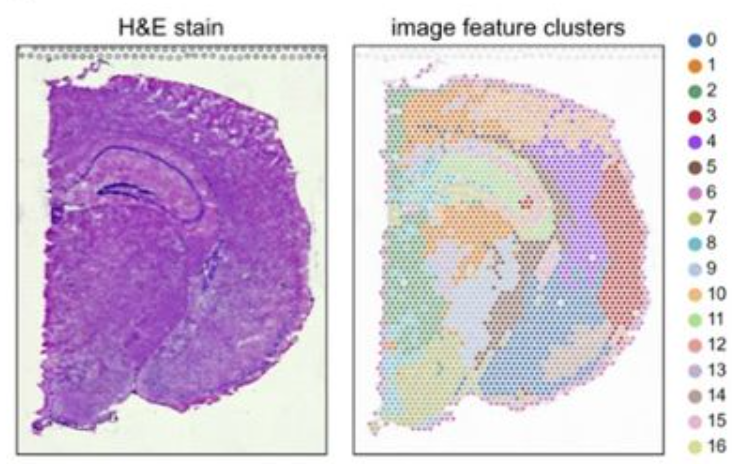 overlap between different cluter result
|
|||
|
|
|||
|
Conclusion& Discussion
|
Squidpy could contribute to building a bridge between the molecular omics community and the image analysis and computer vision community to develop the next generation of computational methods for spatial omics technologies
|
||
"The world is a fine place and worth fighting for." I agree with the second part.


