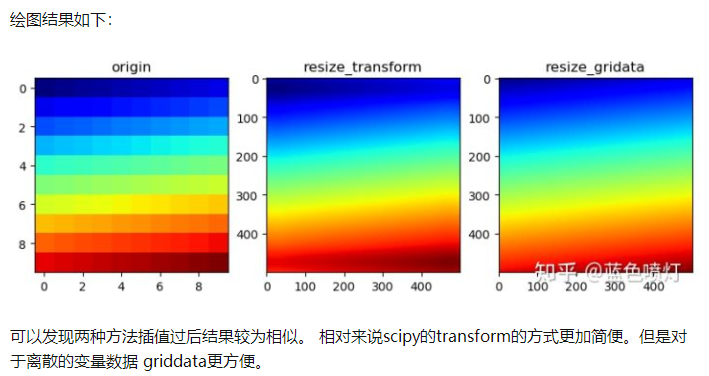
二维矩阵(多元变量)插值方法scipy.interpolate skimage.transform
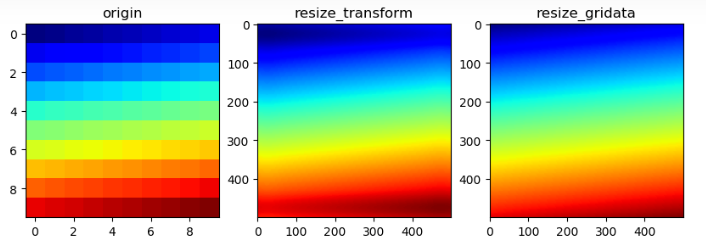
对于二维矩阵插值,推荐两个比较简单的方法,方便作图和分析。
(1)scipy库里的插值,提供nearest、cubic、linear三种插值算法
(2)skimage库里的transform方法 提供Nearest-neighbor、Bi-linear (default)、Bi-quadratic、3: Bi-cubic、Bi-quartic、Bi-quintic 几种方法。主要针对图像重采样。
import numpy as np


#% 使用skimag中的transform进行插值
import tensorflow as tf
from skimage import transform

pic = tf.range(0,100.,1.)
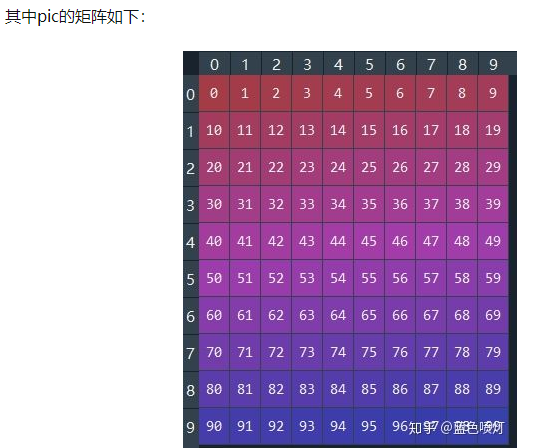
pic = tf.reshape(pic,[10,10])#建立(10,10)0~99的矩阵
pic_resize_transform = transform.resize(pic, (500, 500),order=3) #将矩阵插值成500*500
# The order of interpolation. The order has to be in the range 0-5:
# 0: Nearest-neighbor
# 1: Bi-linear (default)
# 2: Bi-quadratic
# 3: Bi-cubic
# 4: Bi-quartic
# 5: Bi-quintic
#% 使用scipy的gridata方式插值
from scipy.interpolate import griddata

x = np.arange(0,10,1.)
x = x.repeat(10,0)
y = np.arange(0,10,1.)
y = np.tile(y,10)
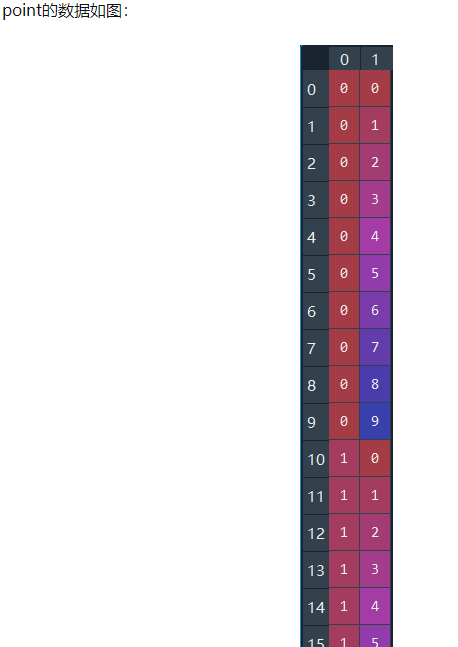
point = np.stack([x,y],axis = -1) #建立griddata的操作中没一点对于的坐标位置,如坐标系中的x,y

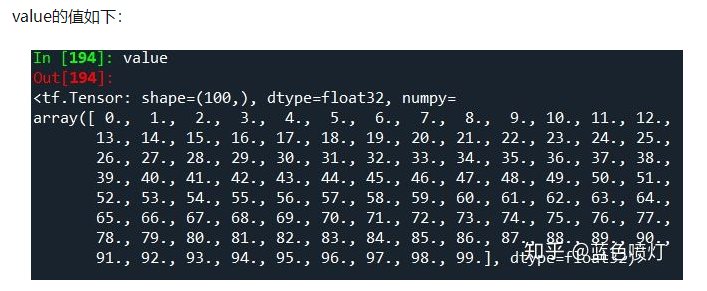
value = tf.range(0,100.,1.) #value相当于坐标系中的z值, 和上图一样为为0~99
xx, yy= np.mgrid[0:9:500j, 0:9:500j]# 建立新的网格,官方建议插值使用numpy的mgrid导入网格
pic_resize_griddata=griddata(point,value,(xx,yy),method='cubic',fill_value=0,rescale=True) #进行插值
#% 绘图
import matplotlib.pyplot as plt
fig = plt.figure(figsize=(10,10), dpi=100)

#图1
ax1=plt.subplot(1,3,1)
ax1.set_title('origin')
plt.imshow(pic,interpolation='nearest', cmap='jet', origin='upper')

#图2
ax2=plt.subplot(1,3,2)
ax2.set_title('resize_transform')
plt.imshow(pic_resize_transform,interpolation='nearest', cmap='jet', origin='upper')

#图3
ax2=plt.subplot(1,3,3)
ax2.set_title('resize_griddata')
plt.imshow(pic_resize_griddata,interpolation='nearest', cmap='jet', origin='upper')
