Vue -- highcharts map使用
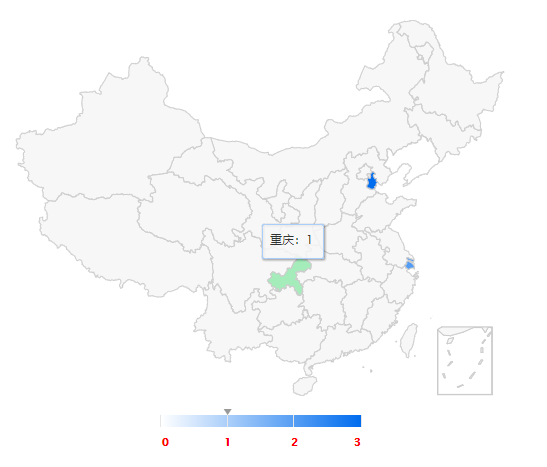
highcharts中国地图使用
highcharts非商用免费,所以大多数正式上线的网站都会选择开源免费的echarts,其实,对于开发者highcharts功能也是很庞大的
下载npm install highcharts -S
vue文件引入
<template>
  <div>
    <div
      ref="mapChina"
      :class="className"
      :style="{ height: height, width: width }"
    />
  </div>
</template>
<script>
import Highcharts from "highcharts/highstock";
import HighchartsMore from "highcharts/highcharts-more";
// import HighchartsDrilldown from 'highcharts/modules/drilldown';
// import Highcharts3D from 'highcharts/highcharts-3d';
import Highmaps from "highcharts/modules/map";
HighchartsMore(Highcharts);
// HighchartsDrilldown(Highcharts);
// Highcharts3D(Highcharts);
Highmaps(Highcharts);
// @/assets/map/china.js 为 https://data.jianshukeji.com/geochina/china.js 文件export default {"title":"中国"...... 引入
import china from "@/assets/map/china.js";

export default {
  props: {
    className: {
      type: String,
      default: "chart",
    },
    width: {
      type: String,
      default: "100%",
    },
    height: {
      type: String,
      default: "460px",
    },
    chinaMapData: {
      type: Array,
      default: () => [],
    },
  },
  data() {
    return {
      chart: null,
    };
  },
  methods: {
    copydeep(obj) {
      var newobj = obj.constructor === Array ? [] : {};
      if (typeof obj !== "object") {
        return;
      }
      for (var i in obj) {
        newobj[i] = typeof obj[i] === "object" ? this.copydeep(obj[i]) : obj[i];
      }
      return newobj;
    },
    initChart() {
      var that = this;
      // 将传过来的值进行深拷贝(如果数据是上一级传递下来的,并且还有table需要使用,这里需要重新定义一个变量接收)
      // var data = this.copydeep(this.chinaMapData);
      var data = [];
      data.push({"name":"辽宁","citys":[], value: 0})
      data.push({"name":"重庆","citys":[{"name":"重庆市","value":1,"ratio":100.0}], value: 1})
      data.push({"name":"上海","citys":[{"name":"上海市","value":2,"ratio":100.0}], value: 2})
      data.push({"name":"天津","citys":[{"name":"天津市","value":3,"ratio":100.0}], value: 3})
      that.chart = new Highcharts.Map(this.$refs.mapChina, {
        chart: {},
        title: {
          text: "",
        },
        credits: { enabled: false }, // 版权信息
        tooltip: {
          formatter: function () {
            if (!this.point.value) {
              return this.point.name;
            } else {
              return this.point.name + ":" + this.point.value;
            }
          },
        },
        colorAxis: {
          min: 0,
          minColor: "#fff",
          maxColor: "#006cee",
          tickColor: "#ff0000",
          labels: {
            style: {
              color: "red",
              fontWeight: "bold"
            },
          },
        },
        series: [
          {
            cursor: "pointer",
            data: data,
            mapData: china,
            joinBy: "name",
            title: "",
            states: {
              hover: {
                color: "#a4edba",
              },
            },
          },
        ],
      });
    },
  },
};
</script>


【推荐】国内首个AI IDE,深度理解中文开发场景,立即下载体验Trae
【推荐】编程新体验,更懂你的AI,立即体验豆包MarsCode编程助手
【推荐】抖音旗下AI助手豆包,你的智能百科全书,全免费不限次数
【推荐】轻量又高性能的 SSH 工具 IShell:AI 加持,快人一步
· AI与.NET技术实操系列:向量存储与相似性搜索在 .NET 中的实现
· 基于Microsoft.Extensions.AI核心库实现RAG应用
· Linux系列:如何用heaptrack跟踪.NET程序的非托管内存泄露
· 开发者必知的日志记录最佳实践
· SQL Server 2025 AI相关能力初探
· winform 绘制太阳,地球,月球 运作规律
· 震惊!C++程序真的从main开始吗?99%的程序员都答错了
· AI与.NET技术实操系列(五):向量存储与相似性搜索在 .NET 中的实现
· 超详细:普通电脑也行Windows部署deepseek R1训练数据并当服务器共享给他人
· 【硬核科普】Trae如何「偷看」你的代码?零基础破解AI编程运行原理