nvprof学习手记
最近在读professional cuda c programming.第三章里有一些关于nvprof的内容.记录一下过程中遇到的问题.
本书的代码可以在这里找到.
线程束分化
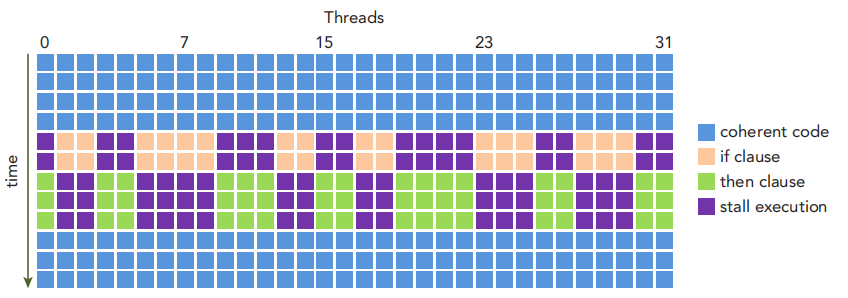
GPU在控制流上相对简单,相比GPU它没有复杂的分支预测机制,一个warp中所有线程在同一周期内必须执行相同指令.如果一个线程执行一条指令,那么warp中的所有线程都必须执行这条指令.如果同一warp中的线程使用不同的路径通过同一程序,则可能产生问题.例如:
if(cond){
    true_branch();
}else{
    false_branch();
}
如果线程束中一部分线程走真分支,另一部分执行假分支,则会违背上述原则.这被称为线程束的分化(warp divergence).这种情形下,warp将连续执行每个分支路径,禁用不执行这一路径的线程.如下图
nvprof命令行遇到的问题
按照书上的指引, 执行nvprof --metrics branch_efficiency ./simpleDivergence, 会提示
==3906366== NVPROF is profiling process 3906366, command: ./simpleDivergence
./simpleDivergence using Device 0: GeForce GTX 1080 Ti
Data size 64 Execution Configure (block 64 grid 1)
==3906366== Warning: ERR_NVGPUCTRPERM - The user does not have permission to profile on the target device. See the following link for instructions to enable permissions and get more information: https://developer.nvidia.com/ERR_NVGPUCTRPERM
==3906366== Profiling application: ./simpleDivergence
==3906366== Profiling result:
No events/metrics were profiled.
==3906366== Warning: Some profiling data are not recorded. Make sure cudaProfilerStop() or cuProfilerStop() is called before application exit to flush profile data.
这里提供了报错信息的情景.依据这里的指引,这是因为获取这些数据的GPU Performance Counters被禁用了.我第一反应是使用管理员权限运行,即sudo nvprof.结果却提示commad not found.
我们在linux运行modprobe nvidia NVreg_RestrictProfilingToAdminUsers=0后,未解决问题.
随后尝试"Enable access permanently"一栏下的方法,在/etc/modprobe.d目录下添加一个后缀名.conf的文件,并输入options nvidia "NVreg_RestrictProfilingToAdminUsers=0".随后执行update-initramfs -u -k all.注意这些都需要root权限.
重启系统,在终端输入cat /proc/driver/nvidia/params | grep RmProfilingAdminOnly查看权限情况,然而一个大大的RmProfilingAdminOnly = 1狠狠地嘲笑了我.
正当我准备放弃时,想到了在一个论坛帖子里看到一位网友使用绝对路径调用nvprof,遂尝试,问题解决.
那么为什么直接用sudo会找不到命令呢?可以在这里找到答案.简单来说,sudo中有一个选项--with-secure-path是默认开启的,此时它并不是在系统的PATH下寻找,而是在/etc/sudoer文件中的
Defaults secure_path="/usr/local/sbin:/usr/local/bin:/usr/sbin:/usr/bin:/sbin:/bin:/snap/bin"
这一项中寻找.默认来说是上面的内容.因此我们需要添加nvprof所在的路径.一般来说是/usr/local/cuda/bin/.编辑sudoer文件需要特殊的编辑器.在/etc目录下,输入sudo visudo,将路径添加进Defaults,注意加冒号.随后Ctrl + O保存,回车,Ctrl + X退出.随后就可以直接使用sudo nvprof了.
这里列出了nvprof支持的所有metrics.
nvprof 常用metrics讲解.
在英伟达官网提供的profiler users guide当中,这里给出了CC 6.x下支持的所有指标.如果你想检测某一程序的某些指标,使用格式为
$ nvprof --metrics <metrics1>,<metrics2> <program_name>
注意多项指标之间用逗号分隔,且不要有空格.可以使用all指定显示所有测量指标(但实在是太多了,一般不会用).
| Metric Name | Description |
|---|---|
| gld_requested_throughput | Requested global memory load throughput |
| gld_throughput | Global memory load throughput |
| gld_efficiency | Ratio of requested global memory load throughput to required global memory load throughput expressed as percentage. |
| branch_efficiency | Ratio of non-divergent branches to total branches expressed as percentage |
这里可能会引起迷惑.什么是requested_throughput和required_throughput?在这里可以找到答案.
简单地说,由于cacheline的存在,你load 4字节,并不是只会load这4个字节,而是会将它所在的cacheline一同load进来,这是体系结构设计对空间局部性的考量.假设cacheline是128 bytes, 也就是相当于32个float.如果你load了32个float,且它们都在同一个cacheline里面,那么你的request(用户角度,我编程时load了多少字节)和require(硬件角度,实际load了多少字节)就是一致的,此时gld_throughput就是100%.但如果你的程序访存空间局部性极差,每次load 4字节都在不同的cacheline里面,那你的gld_throughput就变成了1/32 * 100% = 3.125%.显然,我们希望它越高越好.
按照书上的指引,运行reduceInteger程序,得到运行时间以及对应的测量指标:
./reduceInteger starting reduction at device 0: GeForce GTX 1080 Ti     with array size 16777216  grid 32768 block 512
cpu reduce      elapsed 0.065145 sec cpu_sum: 2139353471
gpu Neighbored  elapsed 0.001847 sec gpu_sum: 2139353471 <<<grid 32768 block 512>>>
gpu Neighbored2 elapsed 0.001236 sec gpu_sum: 2139353471 <<<grid 32768 block 512>>>
gpu Interleaved elapsed 0.001098 sec gpu_sum: 2139353471 <<<grid 32768 block 512>>>
gpu Unrolling2  elapsed 0.000638 sec gpu_sum: 2139353471 <<<grid 16384 block 512>>>
gpu Unrolling4  elapsed 0.000372 sec gpu_sum: 2139353471 <<<grid 8192 block 512>>>
gpu Unrolling8  elapsed 0.000247 sec gpu_sum: 2139353471 <<<grid 4096 block 512>>>
gpu UnrollWarp8 elapsed 0.000258 sec gpu_sum: 2139353471 <<<grid 4096 block 512>>>
gpu Cmptnroll8  elapsed 0.000236 sec gpu_sum: 2139353471 <<<grid 4096 block 512>>>
gpu Cmptnroll   elapsed 0.000232 sec gpu_sum: 2139353471 <<<grid 4096 block 512>>>

---------------------------------------------------------------------------------------

==325975== Metric result:
Invocations                               Metric Name                        Metric Description         Min         Max         Avg
Device "GeForce GTX 1080 Ti (0)"
    Kernel: reduceInterleaved(int*, int*, unsigned int)
          1                            gld_efficiency             Global Memory Load Efficiency      96.15%      96.15%      96.15%
          1                            gld_throughput                    Global Load Throughput  123.11GB/s  123.11GB/s  123.11GB/s
          1                  gld_requested_throughput          Requested Global Load Throughput  118.36GB/s  118.36GB/s  118.36GB/s
    Kernel: reduceCompleteUnrollWarps8(int*, int*, unsigned int)
          1                            gld_efficiency             Global Memory Load Efficiency      99.43%      99.43%      99.43%
          1                            gld_throughput                    Global Load Throughput  394.48GB/s  394.48GB/s  394.48GB/s
          1                  gld_requested_throughput          Requested Global Load Throughput  392.22GB/s  392.22GB/s  392.22GB/s
    Kernel: reduceNeighbored(int*, int*, unsigned int)
          1                            gld_efficiency             Global Memory Load Efficiency      25.02%      25.02%      25.02%
          1                            gld_throughput                    Global Load Throughput  274.64GB/s  274.64GB/s  274.64GB/s
          1                  gld_requested_throughput          Requested Global Load Throughput  68.728GB/s  68.728GB/s  68.728GB/s
    Kernel: reduceUnrolling8(int*, int*, unsigned int)
          1                            gld_efficiency             Global Memory Load Efficiency      99.21%      99.21%      99.21%
          1                            gld_throughput                    Global Load Throughput  357.99GB/s  357.99GB/s  357.99GB/s
          1                  gld_requested_throughput          Requested Global Load Throughput  355.15GB/s  355.15GB/s  355.15GB/s
    Kernel: reduceUnrolling4(int*, int*, unsigned int)
          1                            gld_efficiency             Global Memory Load Efficiency      98.68%      98.68%      98.68%
          1                            gld_throughput                    Global Load Throughput  294.15GB/s  294.15GB/s  294.15GB/s
          1                  gld_requested_throughput          Requested Global Load Throughput  290.27GB/s  290.27GB/s  290.27GB/s
    Kernel: reduceUnrolling2(int*, int*, unsigned int)
          1                            gld_efficiency             Global Memory Load Efficiency      98.04%      98.04%      98.04%
          1                            gld_throughput                    Global Load Throughput  226.25GB/s  226.25GB/s  226.25GB/s
          1                  gld_requested_throughput          Requested Global Load Throughput  221.80GB/s  221.80GB/s  221.80GB/s
    Kernel: void reduceCompleteUnroll<unsigned int=512>(int*, int*, unsigned int)
          1                            gld_efficiency             Global Memory Load Efficiency      99.43%      99.43%      99.43%
          1                            gld_throughput                    Global Load Throughput  394.78GB/s  394.78GB/s  394.78GB/s
          1                  gld_requested_throughput          Requested Global Load Throughput  392.52GB/s  392.52GB/s  392.52GB/s
    Kernel: reduceUnrollWarps8(int*, int*, unsigned int)
          1                            gld_efficiency             Global Memory Load Efficiency      99.43%      99.43%      99.43%
          1                            gld_throughput                    Global Load Throughput  392.40GB/s  392.40GB/s  392.40GB/s
          1                  gld_requested_throughput          Requested Global Load Throughput  390.15GB/s  390.15GB/s  390.15GB/s
    Kernel: reduceNeighboredLess(int*, int*, unsigned int)
          1                            gld_efficiency             Global Memory Load Efficiency      25.02%      25.02%      25.02%
          1                            gld_throughput                    Global Load Throughput  412.34GB/s  412.34GB/s  412.34GB/s
          1                  gld_requested_throughput          Requested Global Load Throughput  103.19GB/s  103.19GB/s  103.19GB/s
先来看看Neighbored()和Neighbored2()这两个.原理图书中已经画出来了,如下.简而言之,在归约时使用了不同的线程编号,避免过多的线程被调度.
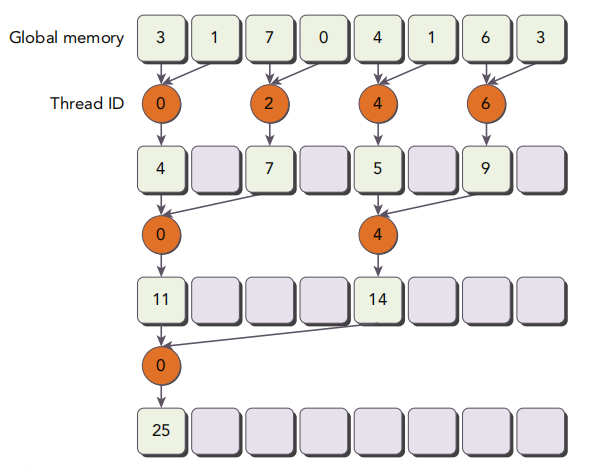
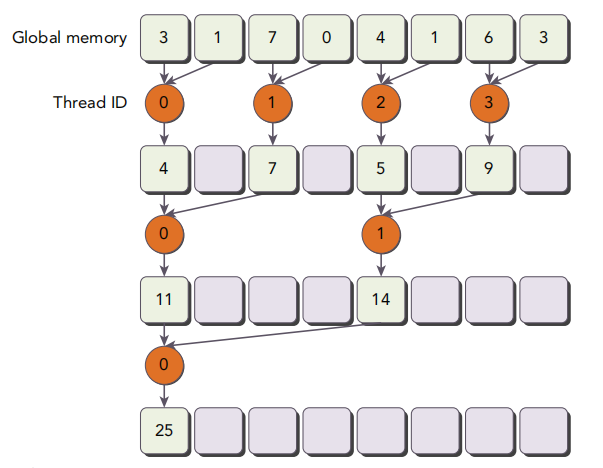
不难发现,这两个函数的gld_efficiency惊人地一致.这当然不是巧合,毕竟这俩的唯一区别就是执行指令的线程不一样,具体过程都是一样的.由于前者留存了太多只有部分线程在执行的block,因此访存吞吐量比较低.但是只要结合上面的运行时间一计算,就能看出
- 274.64 * 0.001847 = 0.5072 GB
- 412.34 * 0.001236 = 0.5096 GB
只差千分之四,可以认为基本一致.从源码里我们得知,程序开了一个\(2^{24}\)大小的int数组,也就是总共\(2^6\) MiB,约为67 MB. 程序总共读了大概509 MB, 由于log级别的归约,实际大概需要读两倍数组大小,也就是134 MB. 算出来理论上大概访存效率是26.32%.考虑到实际读的大小不到两倍,是不是跟实际测量还挺接近的?

 浙公网安备 33010602011771号