Prometheus学习笔记(6)Alertmanager告警
一、Alertmanager简介
Prometheus是一个划分平台,metrics的收集和存储与警报是分开的,警报是由Alertmanager负责,这是监控环境的独立部分。警报的规则是在Prometheus server上进行定义的,这些规则可以触发时间,然后将其传到alertmanager,alertmanager随后决定如何处理各自的警报,处理复制之类的问题,并决定在发送警报时使用什么机制:实时消息、电子邮件或者是其他钉钉、微信等工具。
二、Alertmanager部署
Alertmanager默认监听9093端口,集群接听端口9094。
# 下载
[root@prometheus ~]# wget https://github.com/prometheus/alertmanager/releases/download/v0.20.0-rc.0/alertmanager-0.20.0-rc.0.linux-amd64.tar.gz

# 解压
[root@prometheus ~]# tar -zxf alertmanager-0.20.0-rc.0.linux-amd64.tar.gz -C /usr/local/
[root@prometheus ~]# mv /usr/local/alertmanager-0.20.0-rc.0.linux-amd64 /usr/local/alertmanager-0.20.0
[root@prometheus ~]# ln -sv /usr/local/alertmanager-0.20.0 /usr/local/alertmanager

# 运行
[root@prometheus ~]# ln -sv /usr/local/alertmanager/alertmanager /usr/local/bin/
[root@prometheus ~]# alertmanager &
[root@prometheus ~]# netstat -tulnp |grep alert
tcp6       0      0 :::9093                 :::*                    LISTEN      41194/alertmanager
tcp6       0      0 :::9094                 :::*                    LISTEN      41194/alertmanager
udp6       0      0 :::9094                 :::*                                41194/alertmanager
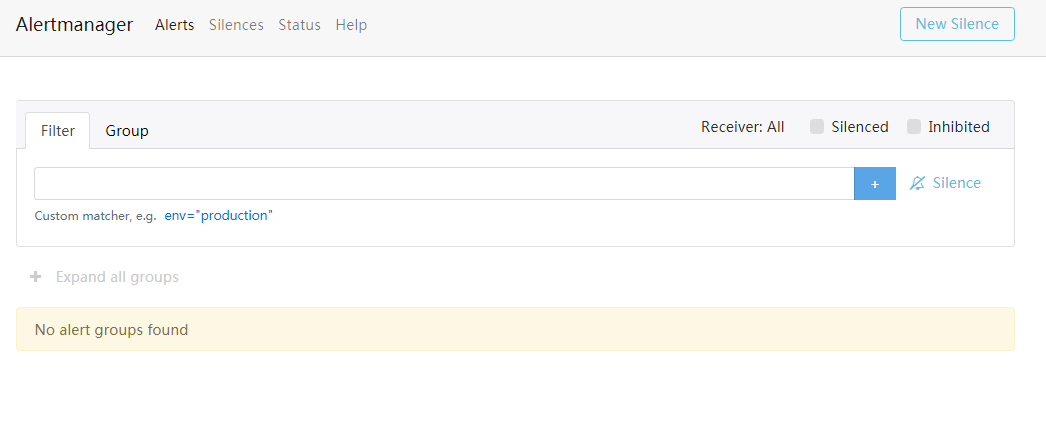
访问http://
三、Alertmanager配置
Alertmanager的配置有两个地方,一个是在Prometheus server端进行配置告警节点,指定匹配告警规则文件路径,以及监控alertmanager本身。另一个直接配置alertmanager自身的配置,在alertmanager.yml进行配置。
[root@prometheus alertmanager]# cat /usr/local/prometheus/prometheus.yml
...

# Alertmanager configuration
alerting:
  alertmanagers:
  - static_configs:
    - targets:
        - 192.168.0.143:9093    #配置alertmanager节点列表

rule_files:
   - "rules/*_rules.yml"    #指定规则文件
#   - "rules/*_alert.yml"

scrape_configs:
......

  - job_name: 'alertmanager'    #指定监控任务alertmanager
    static_configs:
    - targets: ['192.168.0.143:9093']
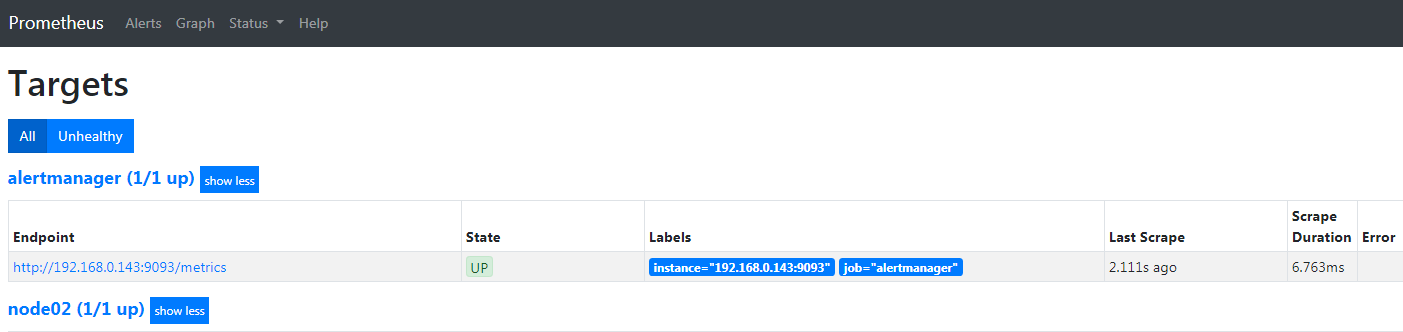
添加完成后,在prometheus server的web端可以查看到alertmanager的targets列表,如下:
配置完成prometheus.yml后,再来看看默认的alertmanager.yml的介绍,如下:
[root@prometheus alertmanager]# cat alertmanager.yml
global:
  resolve_timeout: 5m    #处理超时时间,默认为5min

route:
  group_by: ['alertname']    # 报警分组依据
  group_wait: 10s    # 最初即第一次等待多久时间发送一组警报的通知
  group_interval: 10s    # 在发送新警报前的等待时间
  repeat_interval: 1h    # 发送重复警报的周期 对于email配置中,此项不可以设置过低,否则将会由于邮件发送太多频繁,被smtp服务器拒绝
  receiver: 'web.hook'    # 发送警报的接收者的名称,以下receivers name的名称

receivers:
- name: 'web.hook'    # 警报
  webhook_configs:    # webhook配置
  - url: 'http://192.168.0.143:5001/'

inhibit_rules:    # 一个inhibition规则是在与另一组匹配器匹配的警报存在的条件下,使匹配一组匹配器的警报失效的规则。两个警报必须具有一组相同的标签。
  - source_match:
      severity: 'critical'
    target_match:
      severity: 'warning'
    equal: ['alertname', 'dev', 'instance']
-
global: 全局配置,包括报警解决后的超时时间、SMTP 相关配置、各种渠道通知的 API 地址等等。
-
route: 用来设置报警的分发策略,它是一个树状结构,按照深度优先从左向右的顺序进行匹配。
-
receivers: 配置告警消息接受者信息,例如常用的 email、wechat、slack、webhook 等消息通知方式。
-
inhibit_rules: 抑制规则配置,当存在与另一组匹配的警报(源)时,抑制规则将禁用与一组匹配的警报(目标)。
四、自定义告警规则和发送
在prometheus.yml中创建规则文件,进行监控node02主机的node_exporter是否存活,并发送告警信息如下:
[root@prometheus prometheus]# pwd
/usr/local/prometheus
[root@prometheus prometheus]# mkdir rules
[root@prometheus rules]# vim node_rules.yml
groups:
- name: node-up    # 分组名称
  rules:           # 规则设置
  - alert: node-up  #告警名称
    expr: up{job="node02"} == 0    # 表达式,查询式语句查询up的值是否等于0,如果等于则告警
    for: 15s    # 告警持续时间
    labels:
      severity: 1
      team: node
    annotations:    # 注解
      summary: "{{ $labels.instance }} 已停止运行超过 15s!"
[root@prometheus rules]# systemctl restart prometheus
设定prometheus.yml中的rules后,再配置alertmanager的告警相关信息,如下:
[root@prometheus alertmanager]# pwd
/usr/local/alertmanager

[root@prometheus alertmanager]# vim alertmanager.yml
global:
  resolve_timeout: 5m
  smtp_smarthost: 'smtp.qq.com:465'
  smtp_from: 'xxxxxxxxx@qq.com'
  smtp_auth_username: 'xxxxxxxxx@qq.com'
  smtp_auth_password: 'xxxxxxxxx'    # 16位qq邮箱授权码作为密码
  smtp_require_tls: false

route:
  group_by: ['alertname']
  group_wait: 10s
  group_interval: 10s
  repeat_interval: 1h
  receiver: 'email'    # 选用邮箱告警发送

receivers:
- name: 'email'
  email_configs:
  - to: 'xxxxxxxxx@qq.com'

inhibit_rules:
  - source_match:
      severity: 'critical'
    target_match:
      severity: 'warning'
    equal: ['alertname', 'dev', 'instance']
配置完成后,测试一下是否可以正常出现告警信息和邮件的成功发送。
[root@node02 ~]# systemctl start node_exporter
停止node02的exporter后,可以在prometheus server的web界面上可以看到告警:http://<ip>:9090/alerts,如图:
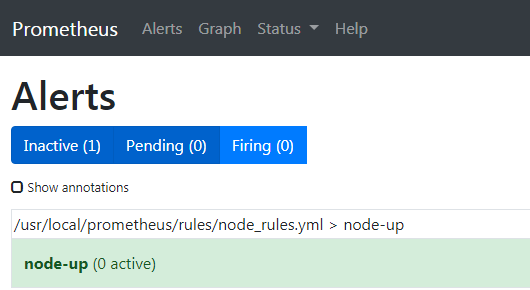
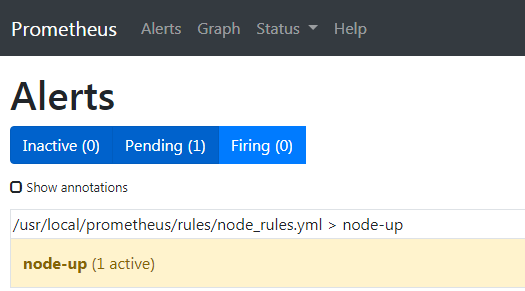
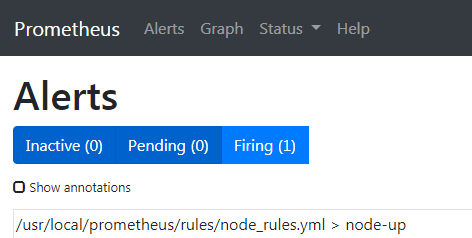
可以看到上面3张图是告警的周期状态,解析如下:
-
1)inactive:表示当前报警信息即不是firing状态也不是pending状态
-
2)pending:表示在设置的阈值时间范围内被激活的
-
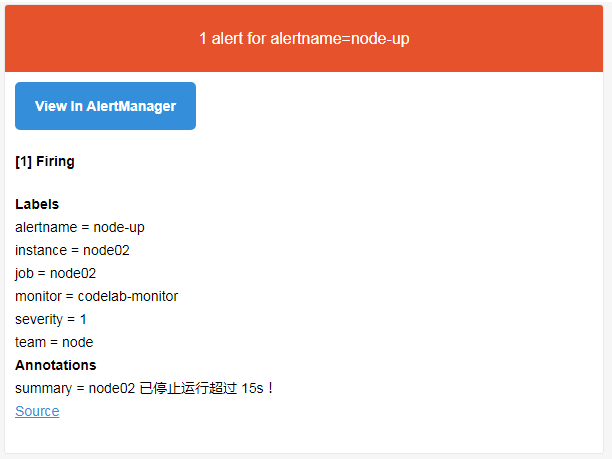
3)firing:表示超过设置的阈值时间被激活的
当状态变成了firing的时候,我们邮箱就会收到响应的告警邮件,如下:
响应的邮箱授权码如何操作,请参考链接:http://service.mail.qq.com/cgi-bin/help?subtype=1&&id=28&&no=1001256
五、自定义告警模板
上面已经实现了告警规则触发,告警邮件的发送,但是官方的告警模板实在吝啬难懂,为此,我们也可以进行自定义告警模板,实现最直观的告警信息。在alertmanager目录下创建template目录,增加邮件模板,然后修改alertmanager的配置。
# 创建模板文件
[root@prometheus alertmanager]# mkdir template
[root@prometheus template]# vim email.tmpl
{{ define "email.html" }}
{{ range .Alerts }}
<pre>
========start==========
告警程序: prometheus_alert
告警级别: {{ .Labels.severity }}
告警类型: {{ .Labels.alertname }}
故障主机: {{ .Labels.instance }}
告警主题: {{ .Annotations.summary }}
告警详情: {{ .Annotations.description }}
触发时间: {{ .StartsAt.Format "2019-12-14 16:01:01" }}
========end==========
</pre>
{{ end }}
{{ end }}
# 修改alertmanager.yml配置
[root@prometheus alertmanager]# cat alertmanager.yml
global:
resolve_timeout: 5m
smtp_smarthost: 'smtp.qq.com:465'
smtp_from: 'xxxxxxxxx@qq.com'
smtp_auth_username: 'xxxxxxxxx@qq.com'
smtp_auth_password: 'xxxxxxxxxxxxxx'
smtp_require_tls: false
templates: # 指定邮件模板的路径,可以使用相对路径,template/*.tmpl的方式
- '/usr/local/alertmanager/template/email.tmpl'
route:
group_by: ['alertname']
group_wait: 10s
group_interval: 10s
repeat_interval: 1h
receiver: 'email'
receivers:
- name: 'email'
email_configs:
- send_resolved: true
to: 'xxxxxxxxx@qq.com'
html: '{{ template "email.html" . }}' # 指定使用模板,如果不指定,还是会加载默认的模板的
headers: { Subject: "[WARN]Prometheus告警邮件" } # 配置邮件主题
inhibit_rules:
- source_match:
severity: 'critical'
target_match:
severity: 'warning'
equal: ['alertname', 'dev', 'instance']
# 重启alertmanager
root@prometheus template]# ps -ef |grep alert
root 49465 49165 0 16:03 pts/3 00:00:01 alertmanager --config.file=/usr/local/alertmanager/alertmanager.yml
[root@prometheus template]# kill 49465
[root@prometheus template]# alertmanager --config.file=/usr/local/alertmanager/alertmanager.yml &
[1] 49554
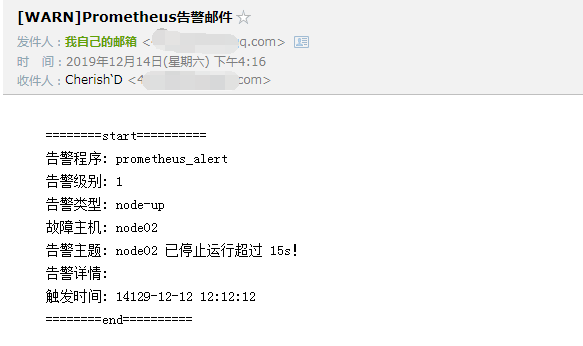
# 测试故障告警
[root@node02 ~]# systemctl stop node_exporter
经过一小段时间后,邮箱会收到告警邮件,是不是好看多了,如图:

 浙公网安备 33010602011771号