Kubernetes+Prometheus+Grafana
1、Kubernetes
参考文章:https://blog.51cto.com/kaliarch/2160569
以上链接介绍了二进制安装和利用kubadm进行安装部署的两种部署方法。
2、Prometheus
官方yaml地址:https://github.com/prometheus/prometheus/
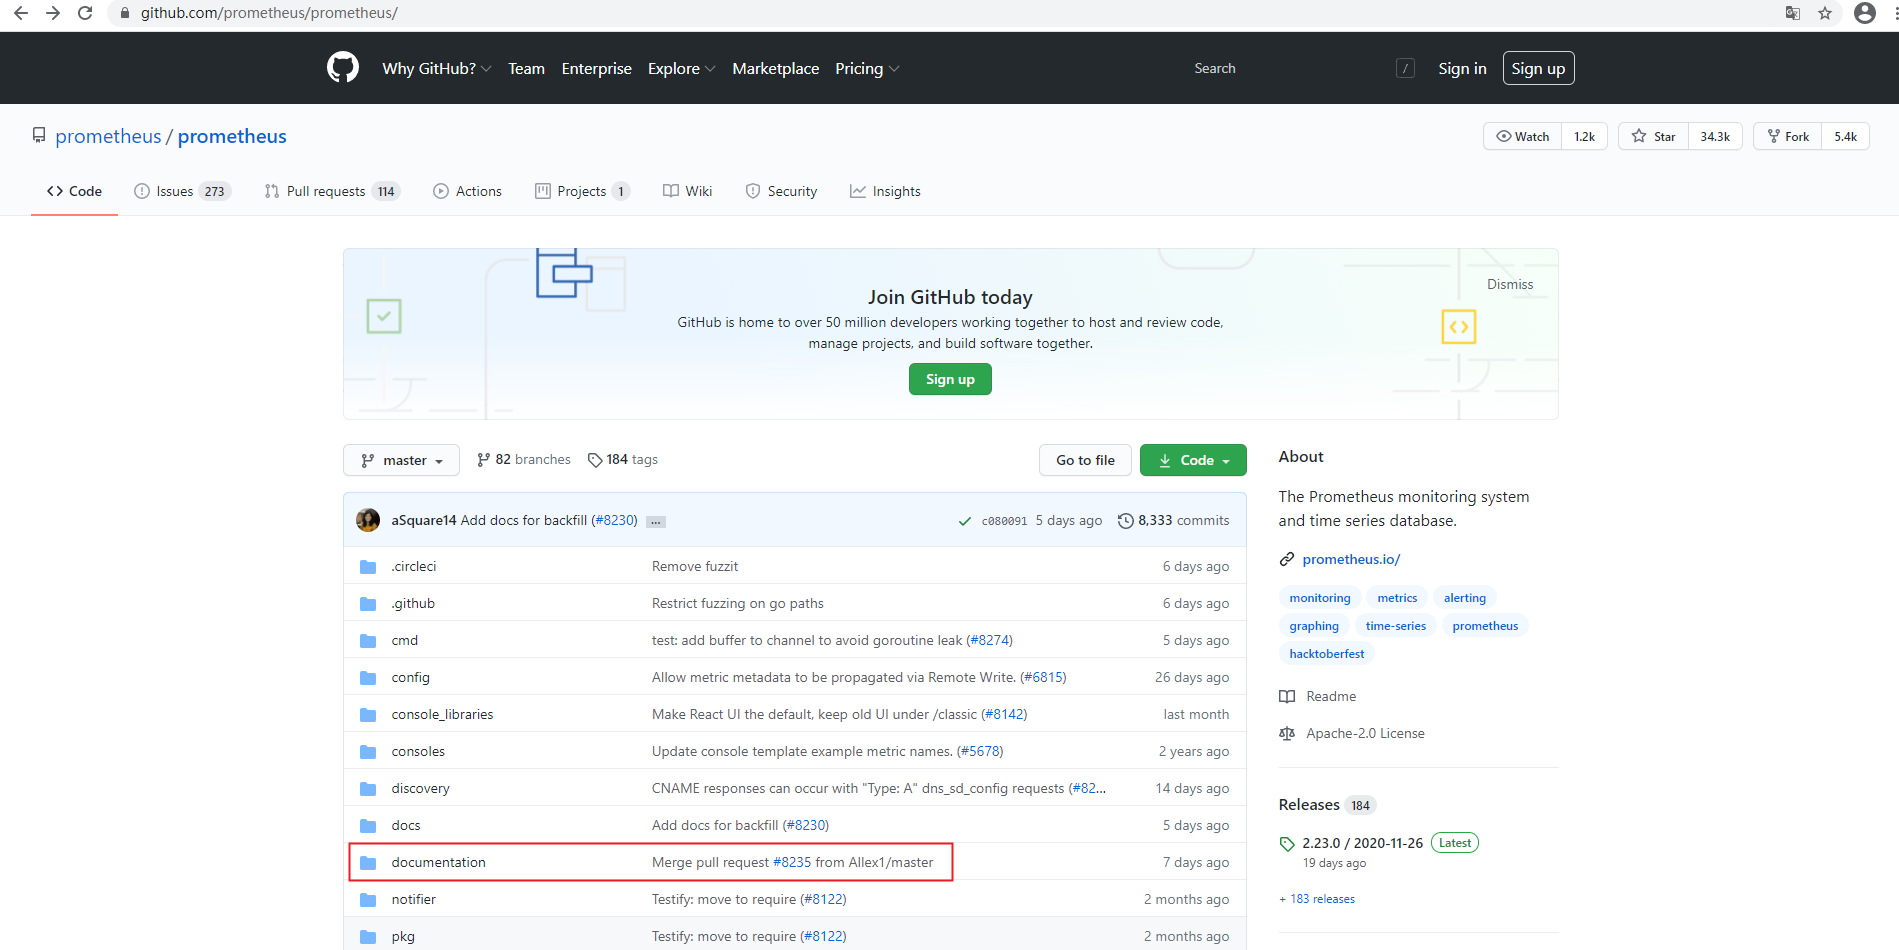
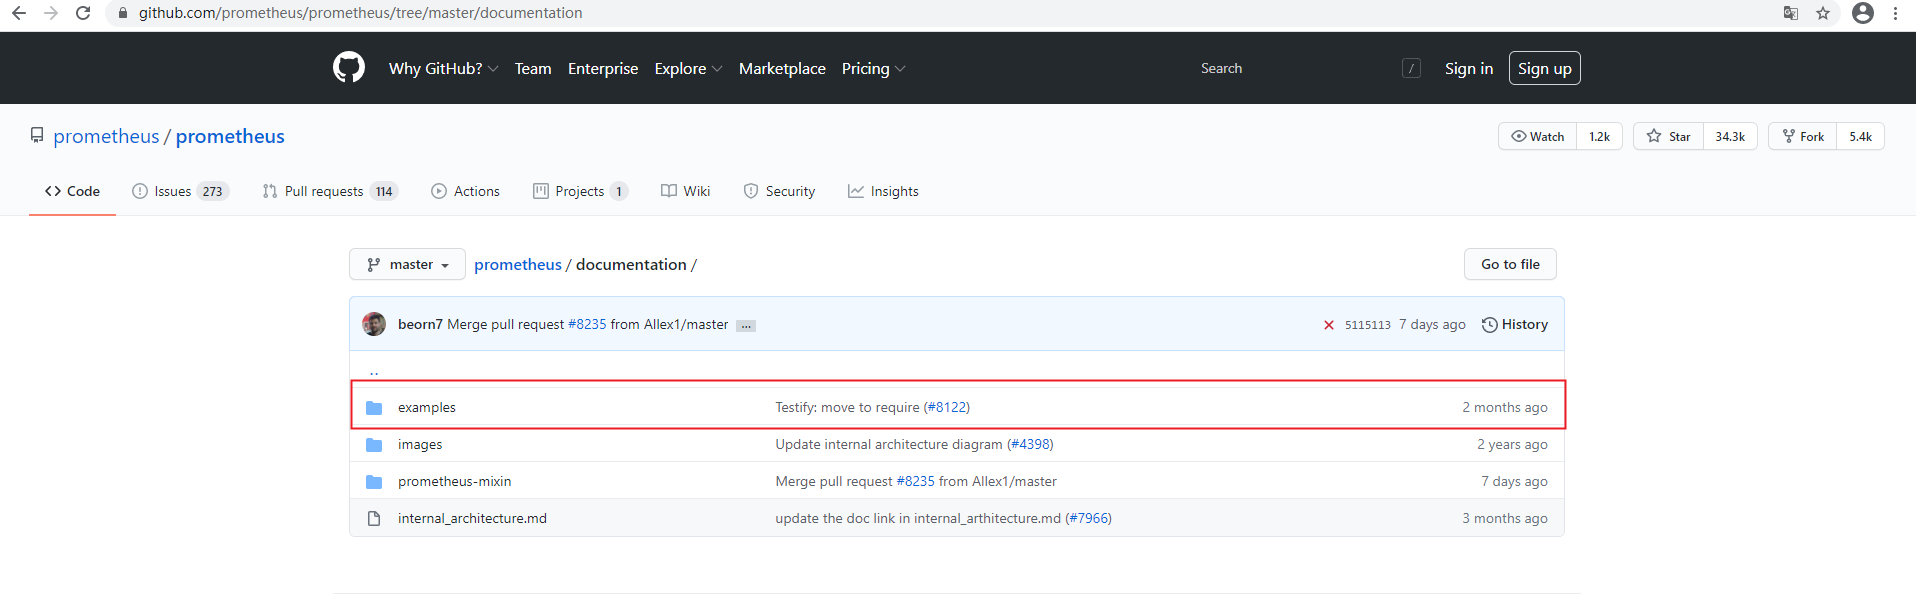
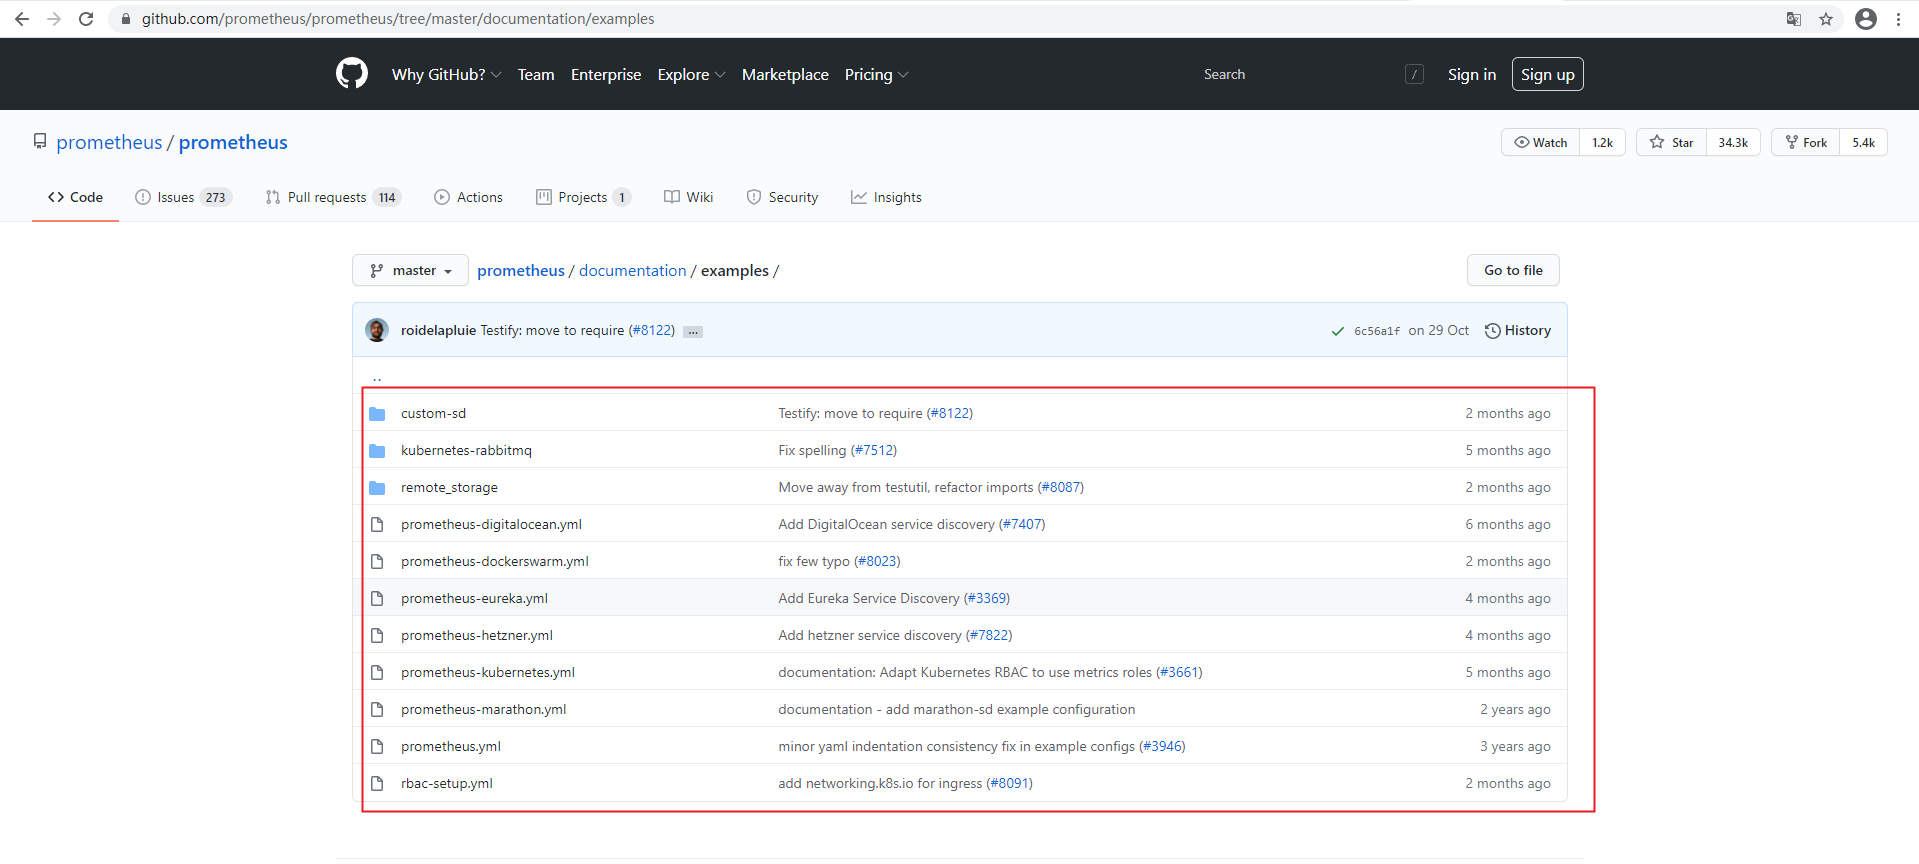
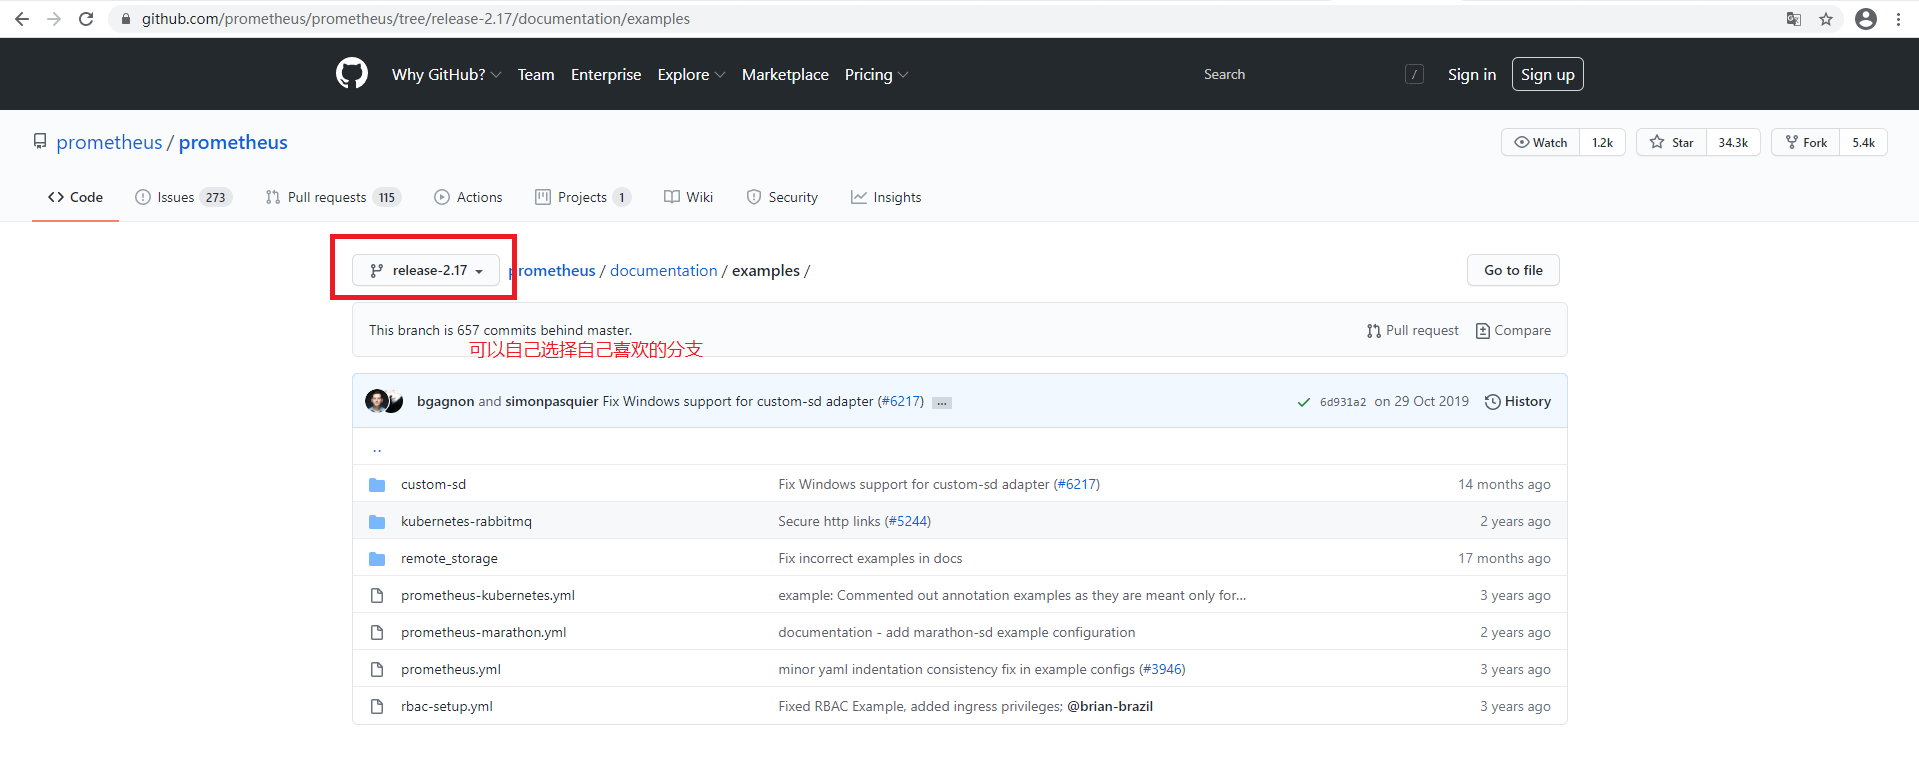
这里我选择别人规整好的yaml文件部署
参考网址:https://github.com/kayrus
前期准备:在master可以进行安装部署
安装git,并下载相关yaml文件
git clone https://github.com/redhatxl/k8s-prometheus-grafana.git
前期准备:在node节点下载监控所需镜像
docker pull prom/node-exporter
docker pull prom/prometheus:v2.0.0
docker pull grafana/grafana:4.2.0
2.1采用daemonset方式部署node-exporter组件
官方参考地址:https://github.com/prometheus/node_exporter
为了监控每个node节点的宿主机状态


---
apiVersion: extensions/v1beta1
kind: DaemonSet
metadata:
  name: node-exporter
  namespace: kube-system
  labels:
    k8s-app: node-exporter
spec:
  template:
    metadata:
      labels:
        k8s-app: node-exporter
    spec:
      containers:
      - image: prom/node-exporter
        name: node-exporter
        ports:
        - containerPort: 9100
          protocol: TCP
          name: http
---
apiVersion: v1
kind: Service
metadata:
  labels:
    k8s-app: node-exporter
  name: node-exporter
  namespace: kube-system
spec:
  ports:
  - name: http
    port: 9100
    nodePort: 31672
    protocol: TCP
  type: NodePort
  selector:
    k8s-app: node-exporter
kubectl create -f node-exporter.yaml
2.2部署prometheus组件
[root@localhost k8s-prometheus-grafana]# ls
alertmanager  grafana  node-exporter.yaml  prometheus  README.md
[root@localhost k8s-prometheus-grafana]# cd prometheus/
[root@localhost prometheus]# ls
configmap.yaml  configmap.yaml.bak  prometheus.deploy.yml  prometheus.deploy.yml.bak  prometheus-rules.yaml  prometheus.svc.yml  rbac-setup.yaml
[root@localhost prometheus]# cat rbac-setup.yaml
apiVersion: rbac.authorization.k8s.io/v1
kind: ClusterRole
metadata:
  name: prometheus
rules:
- apiGroups: [""]
  resources:
  - nodes
  - nodes/proxy
  - services
  - endpoints
  - pods
  verbs: ["get", "list", "watch"]
- apiGroups:
  - extensions
  resources:
  - ingresses
  verbs: ["get", "list", "watch"]
- nonResourceURLs: ["/metrics"]
  verbs: ["get"]
---
apiVersion: v1
kind: ServiceAccount
metadata:
  name: prometheus
  namespace: kube-system
---
apiVersion: rbac.authorization.k8s.io/v1
kind: ClusterRoleBinding
metadata:
  name: prometheus
roleRef:
  apiGroup: rbac.authorization.k8s.io
  kind: ClusterRole
  name: prometheus
subjects:
- kind: ServiceAccount
  name: prometheus
  namespace: kube-system
[root@localhost prometheus]#
[root@localhost prometheus]# cat configmap.yaml
apiVersion: v1
kind: ConfigMap
metadata:
  name: prometheus-config
  namespace: kube-system
data:
  prometheus.yml: |
    global:
      scrape_interval:     15s
      evaluation_interval: 15s
    scrape_configs:

    - job_name: 'kubernetes-apiservers'
      kubernetes_sd_configs:
      - role: endpoints
      scheme: https
      tls_config:
        ca_file: /var/run/secrets/kubernetes.io/serviceaccount/ca.crt
      bearer_token_file: /var/run/secrets/kubernetes.io/serviceaccount/token
      relabel_configs:
      - source_labels: [__meta_kubernetes_namespace, __meta_kubernetes_service_name, __meta_kubernetes_endpoint_port_name]
        action: keep
        regex: default;kubernetes;https

    - job_name: 'kubernetes-nodes'
      kubernetes_sd_configs:
      - role: node
      scheme: https
      tls_config:
        ca_file: /var/run/secrets/kubernetes.io/serviceaccount/ca.crt
      bearer_token_file: /var/run/secrets/kubernetes.io/serviceaccount/token
      relabel_configs:
      - action: labelmap
        regex: __meta_kubernetes_node_label_(.+)
      - target_label: __address__
        replacement: kubernetes.default.svc:443
      - source_labels: [__meta_kubernetes_node_name]
        regex: (.+)
        target_label: __metrics_path__
        replacement: /api/v1/nodes/${1}/proxy/metrics

    - job_name: 'kubernetes-cadvisor'
      kubernetes_sd_configs:
      - role: node
      scheme: https
      tls_config:
        ca_file: /var/run/secrets/kubernetes.io/serviceaccount/ca.crt
      bearer_token_file: /var/run/secrets/kubernetes.io/serviceaccount/token
      relabel_configs:
      - action: labelmap
        regex: __meta_kubernetes_node_label_(.+)
      - target_label: __address__
        replacement: kubernetes.default.svc:443
      - source_labels: [__meta_kubernetes_node_name]
        regex: (.+)
        target_label: __metrics_path__
        replacement: /api/v1/nodes/${1}/proxy/metrics/cadvisor

    - job_name: 'kubernetes-service-endpoints'
      kubernetes_sd_configs:
      - role: endpoints
      relabel_configs:
      - source_labels: [__meta_kubernetes_service_annotation_prometheus_io_scrape]
        action: keep
        regex: true
      - source_labels: [__meta_kubernetes_service_annotation_prometheus_io_scheme]
        action: replace
        target_label: __scheme__
        regex: (https?)
      - source_labels: [__meta_kubernetes_service_annotation_prometheus_io_path]
        action: replace
        target_label: __metrics_path__
        regex: (.+)
      - source_labels: [__address__, __meta_kubernetes_service_annotation_prometheus_io_port]
        action: replace
        target_label: __address__
        regex: ([^:]+)(?::\d+)?;(\d+)
        replacement: $1:$2
      - action: labelmap
        regex: __meta_kubernetes_service_label_(.+)
      - source_labels: [__meta_kubernetes_namespace]
        action: replace
        target_label: kubernetes_namespace
      - source_labels: [__meta_kubernetes_service_name]
        action: replace
        target_label: kubernetes_name

    - job_name: 'kubernetes-services'
      kubernetes_sd_configs:
      - role: service
      metrics_path: /probe
      params:
        module: [http_2xx]
      relabel_configs:
      - source_labels: [__meta_kubernetes_service_annotation_prometheus_io_probe]
        action: keep
        regex: true
      - source_labels: [__address__]
        target_label: __param_target
      - target_label: __address__
        replacement: blackbox-exporter.example.com:9115
      - source_labels: [__param_target]
        target_label: instance
      - action: labelmap
        regex: __meta_kubernetes_service_label_(.+)
      - source_labels: [__meta_kubernetes_namespace]
        target_label: kubernetes_namespace
      - source_labels: [__meta_kubernetes_service_name]
        target_label: kubernetes_name

    - job_name: 'kubernetes-ingresses'
      kubernetes_sd_configs:
      - role: ingress
      relabel_configs:
      - source_labels: [__meta_kubernetes_ingress_annotation_prometheus_io_probe]
        action: keep
        regex: true
      - source_labels: [__meta_kubernetes_ingress_scheme,__address__,__meta_kubernetes_ingress_path]
        regex: (.+);(.+);(.+)
        replacement: ${1}://${2}${3}
        target_label: __param_target
      - target_label: __address__
        replacement: blackbox-exporter.example.com:9115
      - source_labels: [__param_target]
        target_label: instance
      - action: labelmap
        regex: __meta_kubernetes_ingress_label_(.+)
      - source_labels: [__meta_kubernetes_namespace]
        target_label: kubernetes_namespace
      - source_labels: [__meta_kubernetes_ingress_name]
        target_label: kubernetes_name

    - job_name: 'kubernetes-pods'
      kubernetes_sd_configs:
      - role: pod
      relabel_configs:
      - source_labels: [__meta_kubernetes_pod_annotation_prometheus_io_scrape]
        action: keep
        regex: true
      - source_labels: [__meta_kubernetes_pod_annotation_prometheus_io_path]
        action: replace
        target_label: __metrics_path__
        regex: (.+)
      - source_labels: [__address__, __meta_kubernetes_pod_annotation_prometheus_io_port]
        action: replace
        regex: ([^:]+)(?::\d+)?;(\d+)
        replacement: $1:$2
        target_label: __address__
      - action: labelmap
        regex: __meta_kubernetes_pod_label_(.+)
      - source_labels: [__meta_kubernetes_namespace]
        action: replace
        target_label: kubernetes_namespace
      - source_labels: [__meta_kubernetes_pod_name]
        action: replace
        target_label: kubernetes_pod_name
    - job_name: 'Linux'
      static_configs:
        - targets: ['node-exporter:9100']
          labels:
            instance: Linux-node


    alerting:
      # 告警配置文件
      alertmanagers:
      # 修改:使用静态绑定
      - static_configs:
        # 修改:targets、指定地址与端口
        - targets: ["alertmanager:80"]
    rule_files:
      - "/opt/rules/*.rules"
[root@localhost prometheus]#
[root@localhost prometheus]# cat prometheus.deploy.yml
---
apiVersion: apps/v1beta2
kind: Deployment
metadata:
  labels:
    name: prometheus-deployment
  name: prometheus
  namespace: kube-system
spec:
  replicas: 1
  selector:
    matchLabels:
      app: prometheus
  template:
    metadata:
      labels:
        app: prometheus
    spec:
      containers:
      - image: prom/prometheus:v2.0.0
        name: prometheus
        command:
        - "/bin/prometheus"
        args:
        - "--config.file=/etc/prometheus/prometheus.yml"
        - "--storage.tsdb.path=/prometheus"
        - "--storage.tsdb.retention=24h"
        ports:
        - containerPort: 9090
          protocol: TCP
        volumeMounts:
        - mountPath: "/prometheus"
          name: data
        - mountPath: "/etc/prometheus"
          name: config-volume
        - mountPath: "/opt/rules"
          name: rules-volume
        resources:
          requests:
            cpu: 100m
            memory: 100Mi
          limits:
            cpu: 500m
            memory: 2500Mi
      serviceAccountName: prometheus
      volumes:
      - name: data
        emptyDir: {}
      - name: config-volume
        configMap:
          name: prometheus-config
      - name: rules-volume
        configMap:
          name: rules-config
[root@localhost prometheus]#
[root@localhost prometheus]# cat prometheus.svc.yml
---
kind: Service
apiVersion: v1
metadata:
  labels:
    app: prometheus
  name: prometheus
  namespace: kube-system
spec:
  type: NodePort
  ports:
  - port: 9090
    targetPort: 9090
    nodePort: 30003
  selector:
    app: prometheus
[root@localhost prometheus]#
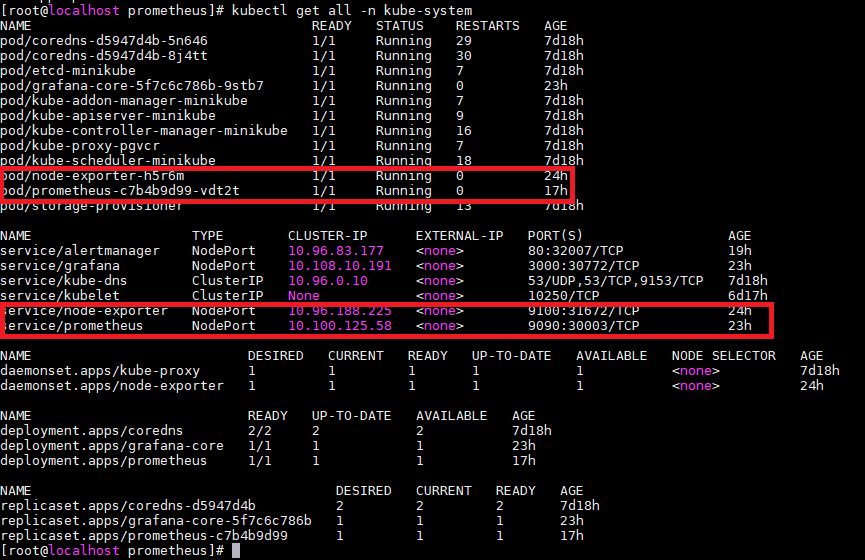
2.2.1 rbac文件
kubectl create -f  k8s-prometheus-grafana/prometheus/rbac-setup.yaml
2.2.2 以configmap的形式管理prometheus组件的配置文件
kubectl create -f  k8s-prometheus-grafana/prometheus/configmap.yaml
2.2.3 Prometheus deployment 文件
kubectl create -f  k8s-prometheus-grafana/prometheus/prometheus.deploy.yml
2.2.4 Prometheus service文件
kubectl create -f  k8s-prometheus-grafana/prometheus/prometheus.svc.yml
WEB访问
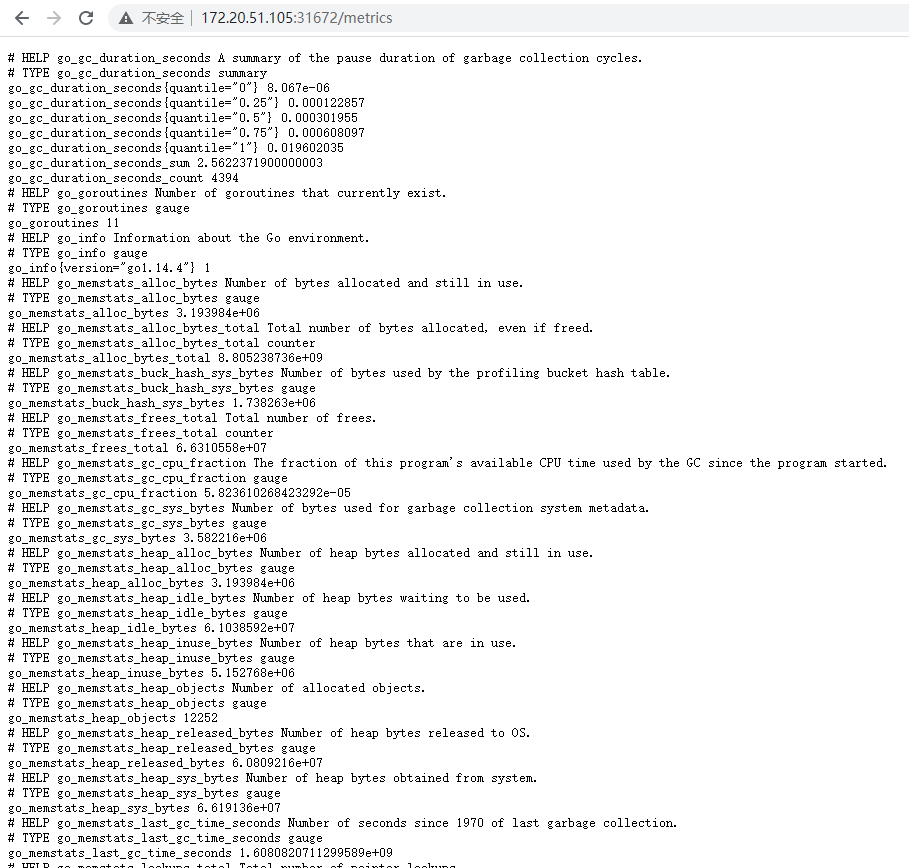
查看node-exporter:http://172.20.51.105:31672/metrics
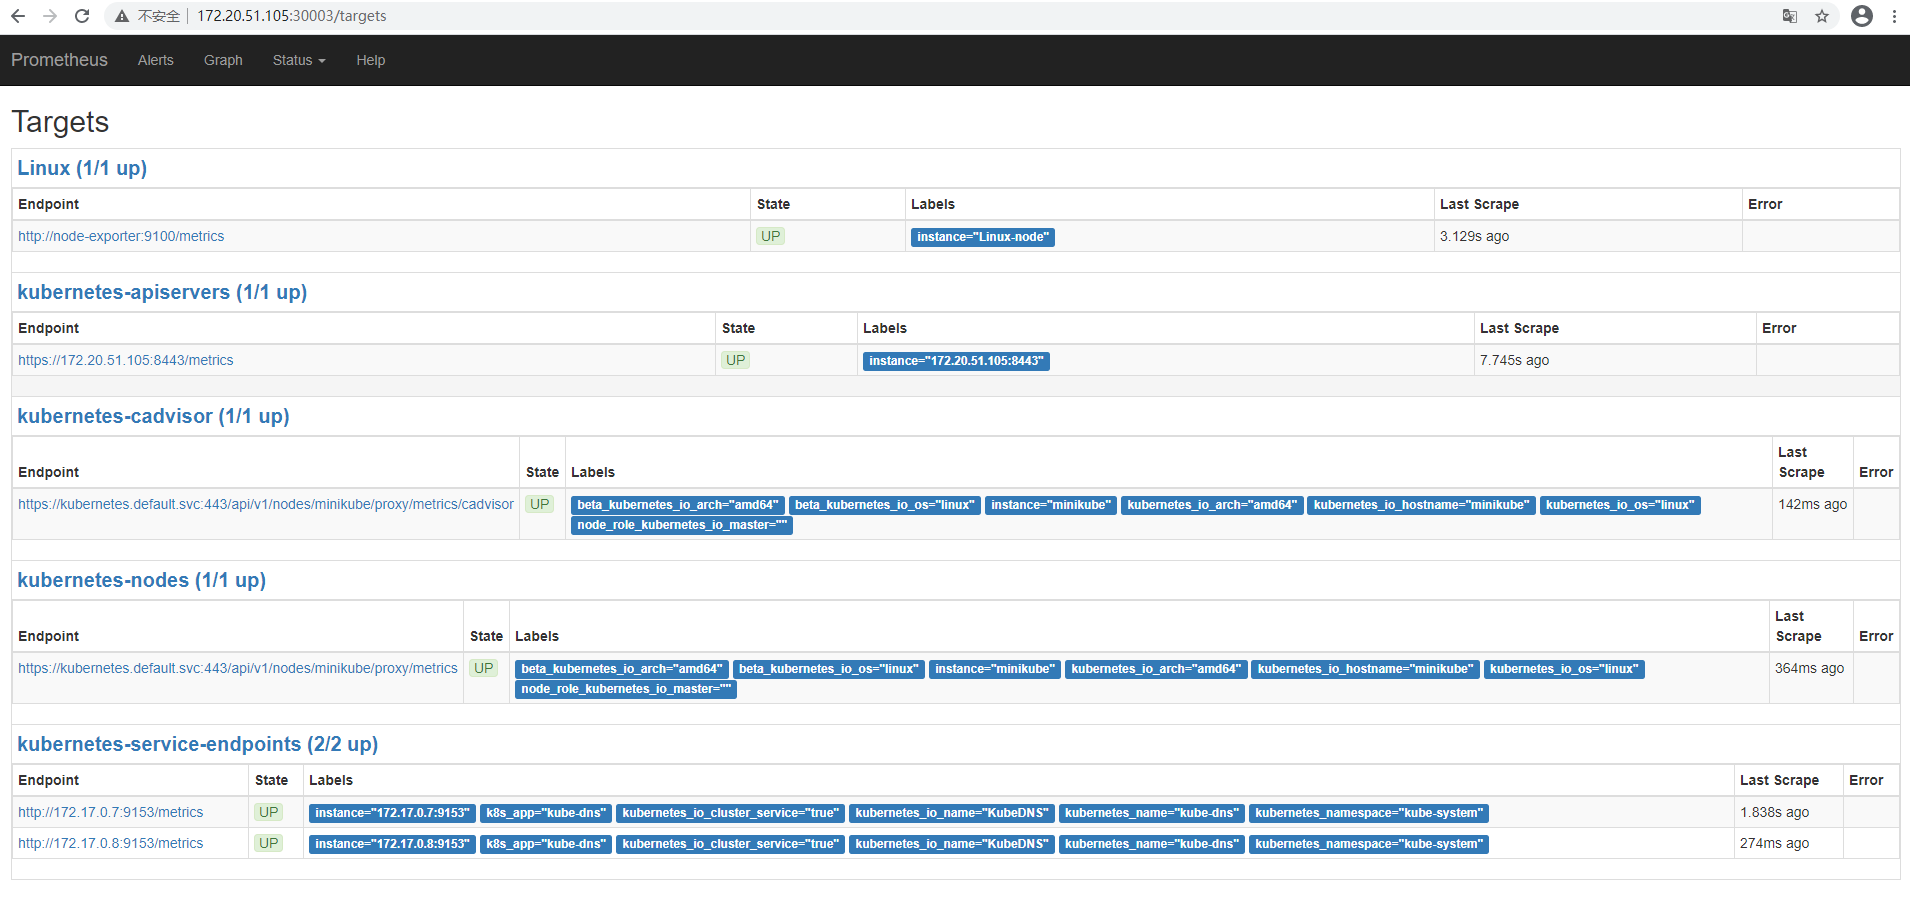
查看Prometheus:http://172.20.51.105:30003/targets 可以看到prometheus已经成功连接上了k8s的apiserver
3、grafana
参考官网地址 https://github.com/grafana
[root@localhost k8s-prometheus-grafana]# ls
alertmanager  grafana  node-exporter.yaml  prometheus  README.md
[root@localhost k8s-prometheus-grafana]# cd grafana/
[root@localhost grafana]# ls
grafana-deploy.yaml  grafana-ing.yaml  grafana-svc.yaml
[root@localhost grafana]# cat grafana-deploy.yaml
apiVersion: extensions/v1beta1
kind: Deployment
metadata:
  name: grafana-core
  namespace: kube-system
  labels:
    app: grafana
    component: core
spec:
  replicas: 1
  template:
    metadata:
      labels:
        app: grafana
        component: core
    spec:
      containers:
      - image: grafana/grafana:4.2.0
        name: grafana-core
        imagePullPolicy: IfNotPresent
        # env:
        resources:
          # keep request = limit to keep this container in guaranteed class
          limits:
            cpu: 100m
            memory: 100Mi
          requests:
            cpu: 100m
            memory: 100Mi
        env:
          # The following env variables set up basic auth twith the default admin user and admin password.
          - name: GF_AUTH_BASIC_ENABLED
            value: "true"
          - name: GF_AUTH_ANONYMOUS_ENABLED
            value: "false"
          # - name: GF_AUTH_ANONYMOUS_ORG_ROLE
          #   value: Admin
          # does not really work, because of template variables in exported dashboards:
          # - name: GF_DASHBOARDS_JSON_ENABLED
          #   value: "true"
        readinessProbe:
          httpGet:
            path: /login
            port: 3000
          # initialDelaySeconds: 30
          # timeoutSeconds: 1
        volumeMounts:
        - name: grafana-persistent-storage
          mountPath: /var
      volumes:
      - name: grafana-persistent-storage
        emptyDir: {}
[root@localhost grafana]#
[root@localhost grafana]# cat grafana-deploy.yaml
apiVersion: extensions/v1beta1
kind: Deployment
metadata:
  name: grafana-core
  namespace: kube-system
  labels:
    app: grafana
    component: core
spec:
  replicas: 1
  template:
    metadata:
      labels:
        app: grafana
        component: core
    spec:
      containers:
      - image: grafana/grafana:4.2.0
        name: grafana-core
        imagePullPolicy: IfNotPresent
        # env:
        resources:
          # keep request = limit to keep this container in guaranteed class
          limits:
            cpu: 100m
            memory: 100Mi
          requests:
            cpu: 100m
            memory: 100Mi
        env:
          # The following env variables set up basic auth twith the default admin user and admin password.
          - name: GF_AUTH_BASIC_ENABLED
            value: "true"
          - name: GF_AUTH_ANONYMOUS_ENABLED
            value: "false"
          # - name: GF_AUTH_ANONYMOUS_ORG_ROLE
          #   value: Admin
          # does not really work, because of template variables in exported dashboards:
          # - name: GF_DASHBOARDS_JSON_ENABLED
          #   value: "true"
        readinessProbe:
          httpGet:
            path: /login
            port: 3000
          # initialDelaySeconds: 30
          # timeoutSeconds: 1
        volumeMounts:
        - name: grafana-persistent-storage
          mountPath: /var
      volumes:
      - name: grafana-persistent-storage
        emptyDir: {}
[root@localhost grafana]# ls
grafana-deploy.yaml  grafana-ing.yaml  grafana-svc.yaml
[root@localhost grafana]# cat grafana-svc.yaml
apiVersion: v1
kind: Service
metadata:
  name: grafana
  namespace: kube-system
  labels:
    app: grafana
    component: core
spec:
  type: NodePort
  ports:
    - port: 3000
  selector:
    app: grafana
    component: core
[root@localhost grafana]#
[root@localhost grafana]# cat grafana-svc.yaml
apiVersion: v1
kind: Service
metadata:
  name: grafana
  namespace: kube-system
  labels:
    app: grafana
    component: core
spec:
  type: NodePort
  ports:
    - port: 3000
  selector:
    app: grafana
    component: core
[root@localhost grafana]# cat grafana-ing.yaml
apiVersion: extensions/v1beta1
kind: Ingress
metadata:
   name: grafana
   namespace: kube-system
spec:
   rules:
   - host: k8s.grafana
     http:
       paths:
       - path: /
         backend:
          serviceName: grafana
          servicePort: 3000
[root@localhost grafana]#
3.1 grafana deployment配置文件
kubectl create -f   k8s-prometheus-grafana/grafana/grafana-deploy.yaml
3.2 grafana service配置文件
kubectl create -f   k8s-prometheus-grafana/grafana/grafana-svc.yaml
3.3 grafana ingress配置文件
kubectl create -f   k8s-prometheus-grafana/grafana/grafana-ing.yaml
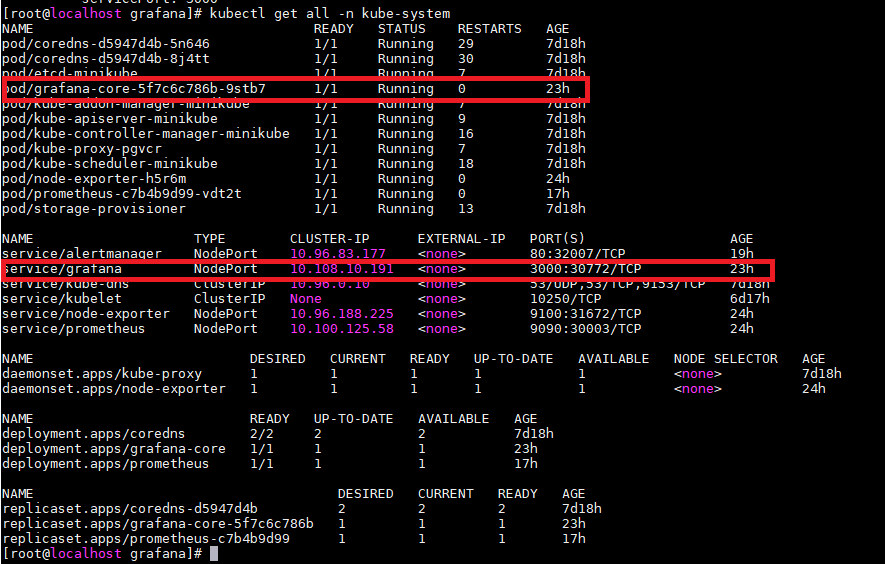
通过端口进行granfa访问,默认用户名密码均为admin
http://172.20.51.105:30772/

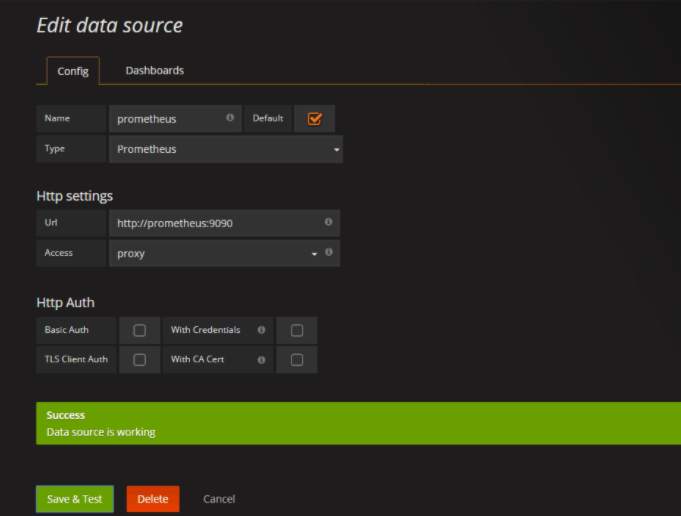
添加数据源
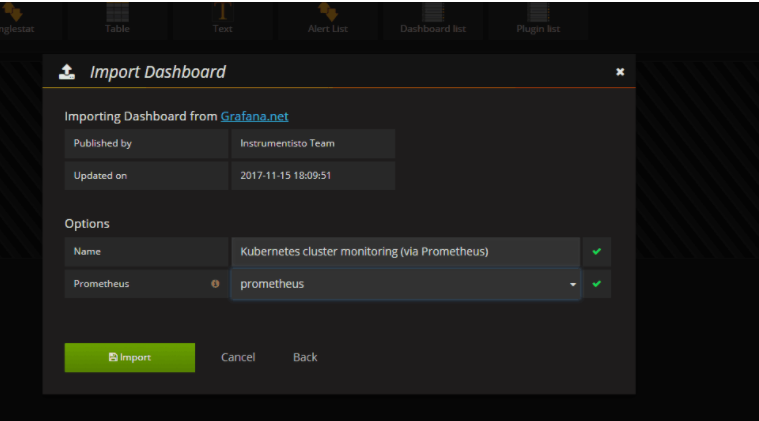
导入面板,可以直接输入模板编号315在线导入,或者下载好对应的json模板文件本地导入,面板模板下载地址https:///dashboards/315
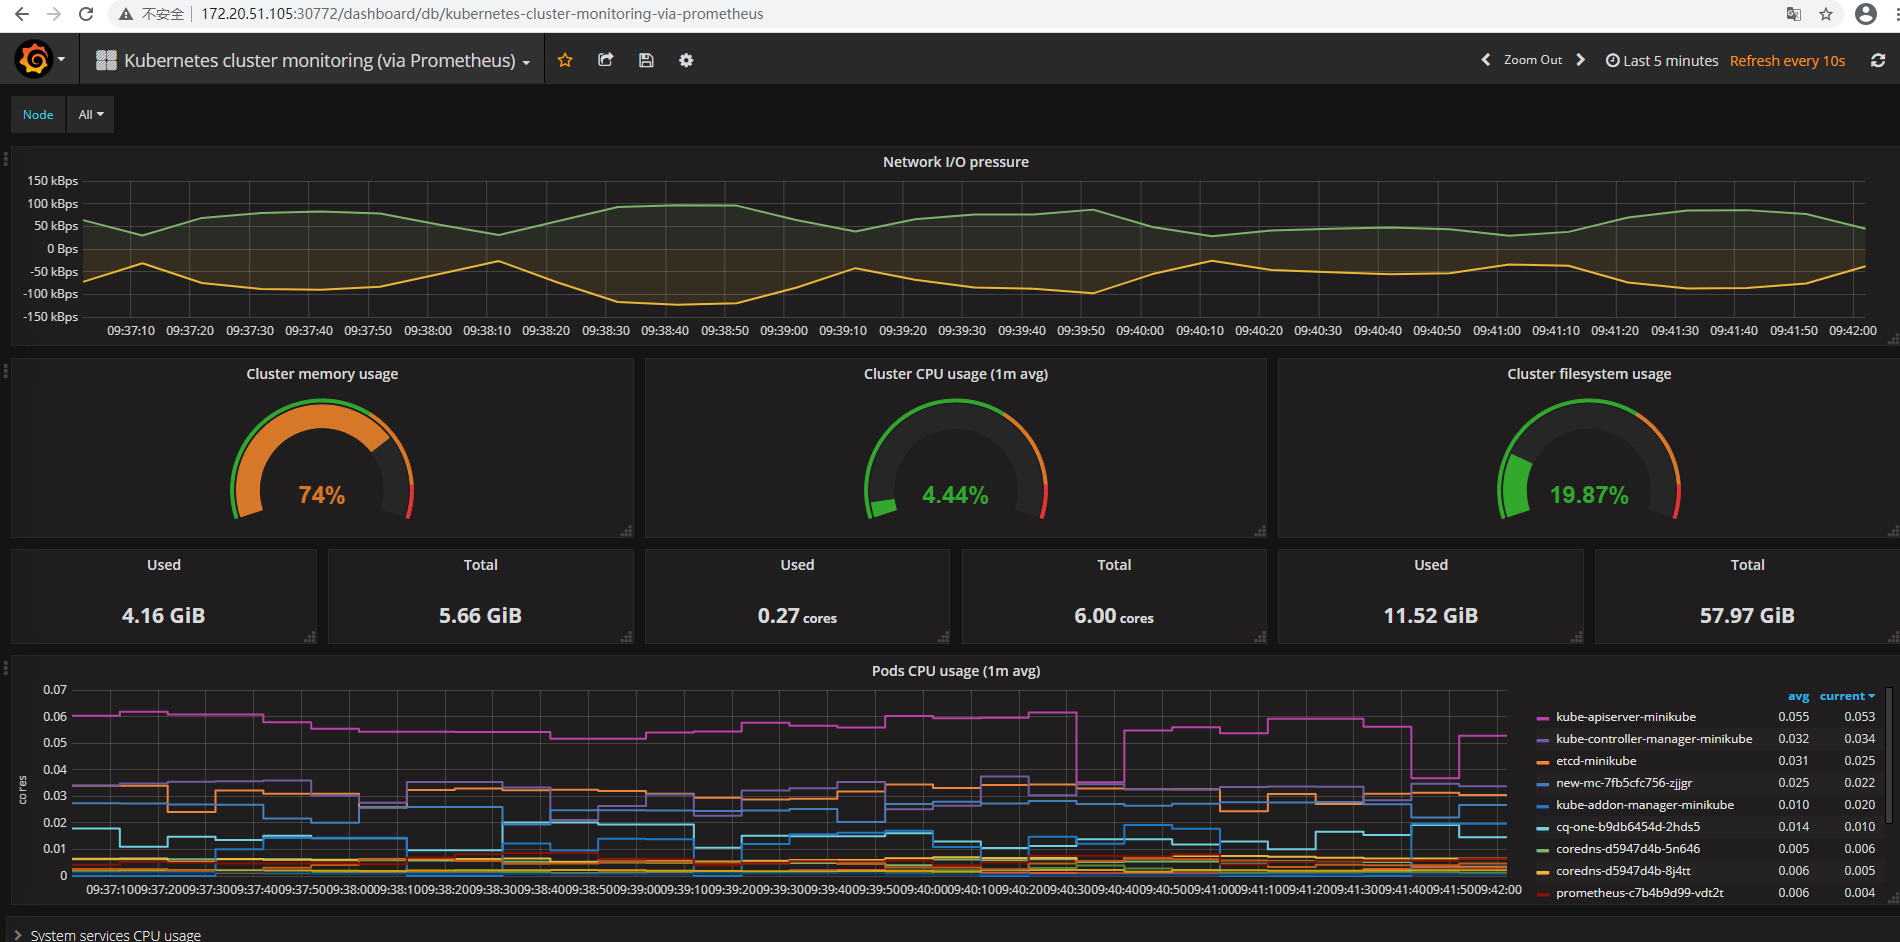
查看展示效果

 浙公网安备 33010602011771号