
Kafka海量日志收集实战4-Kibana 控制台应用、日志可视化
Posted on 2021-02-20 16:39 work hard work smart 阅读(314) 评论(0) 收藏 举报Kibana版本为7.4.2,与ElasticSerach 7.4.2 保持一致。
1、解压
cd /home/tools
tar -zxvf kibana-7.4.2-linux-x86_64.tar.gz
mv kibana-7.4.2-linux-x86_64 /usr/local/
2、修改配置 kibana.yml
cd /usr/local/kibana-7.4.2-linux-x86_64/config
server.host: "172.17.0.13"   ## 内网地址
elasticsearch.hosts: ["http://118.xx.xx.101:9200"]   ## 118.xx.xx.101为外网地址
端口默认为5601
3、启动kibana
/usr/local/kibana-7.4.2-linux-x86_64/bin
./kibana
启动后报如下错误:
 log   [08:46:27.452] [info][status][plugin:elasticsearch@7.4.2] Status changed from yellow to green - Ready
  log   [08:46:27.478] [error][status][plugin:xpack_main@7.4.2] Status changed from yellow to red - [data] Elasticsearch cluster did not respond with license information.
  log   [08:46:27.479] [error][status][plugin:graph@7.4.2] Status changed from yellow to red - [data] Elasticsearch cluster did not respond with license information.
  log   [08:46:27.479] [error][status][plugin:spaces@7.4.2] Status changed from yellow to red - [data] Elasticsearch cluster did not respond with license information.
  log   [08:46:27.479] [error][status][plugin:searchprofiler@7.4.2] Status changed from yellow to red - [data] Elasticsearch cluster did not respond with license information.
  log   [08:46:27.479] [error][status][plugin:ml@7.4.2] Status changed from yellow to red - [data] Elasticsearch cluster did not respond with license information.
  log   [08:46:27.480] [error][status][plugin:tilemap@7.4.2] Status changed from yellow to red - [data] Elasticsearch cluster did not respond with license information.
  log   [08:46:27.480] [error][status][plugin:watcher@7.4.2] Status changed from yellow to red - [data] Elasticsearch cluster did not respond with license information.
  log   [08:46:27.480] [error][status][plugin:grokdebugger@7.4.2] Status changed from yellow to red - [data] Elasticsearch cluster did not respond with license information.
  log   [08:46:27.480] [error][status][plugin:logstash@7.4.2] Status changed from yellow to red - [data] Elasticsearch cluster did not respond with license information.
  log   [08:46:27.480] [error][status][plugin:beats_management@7.4.2] Status changed from yellow to red - [data] Elasticsearch cluster did not respond with license information.
  log   [08:46:27.480] [error][status][plugin:maps@7.4.2] Status changed from yellow to red - [data] Elasticsearch cluster did not respond with license information.
  log   [08:46:27.481] [error][status][plugin:index_management@7.4.2] Status changed from yellow to red - [data] Elasticsearch cluster did not respond with license information.
  log   [08:46:27.481] [error][status][plugin:index_lifecycle_management@7.4.2] Status changed from yellow to red - [data] Elasticsearch cluster did not respond with license information.
  log   [08:46:27.481] [error][status][plugin:rollup@7.4.2] Status changed from yellow to red - [data] Elasticsearch cluster did not respond with license information.
  log   [08:46:27.481] [error][status][plugin:remote_clusters@7.4.2] Status changed from yellow to red - [data] Elasticsearch cluster did not respond with license information.
  log   [08:46:27.481] [error][status][plugin:cross_cluster_replication@7.4.2] Status changed from yellow to red - [data] Elasticsearch cluster did not respond with license information.
  log   [08:46:27.481] [error][status][plugin:file_upload@7.4.2] Status changed from yellow to red - [data] Elasticsearch cluster did not respond with license information.
  log   [08:46:27.482] [error][status][plugin:snapshot_restore@7.4.2] Status changed from yellow to red - [data] Elasticsearch cluster did not respond with license information.
  log   [08:46:28.181] [warning][reporting] Generating a random key for xpack.reporting.encryptionKey. To prevent pending reports from failing on restart, please set xpack.reporting.encryptionKey in kibana.yml
  log   [08:46:28.187] [error][status][plugin:reporting@7.4.2] Status changed from uninitialized to red - [data] Elasticsearch cluster did not respond with license information.
  log   [08:46:28.222] [error][status][plugin:security@7.4.2] Status changed from green to red - [data] Elasticsearch cluster did not respond with license information.
  log   [08:46:31.278] [error][esqueue][queue-worker][reporting] kjzgv4a1024x82f160b8apie - job querying failed: [cluster_block_exception] blocked by: [SERVICE_UNAVAILABLE/1/state not recovered / initialized]; :: {"path":"/.reporting-*/_search","query":{},"body":"{\"seq_no_primary_term\":true,\"_source\":{\"excludes\":[\"output.content\"]},\"query\":{\"bool\":{\"filter\":{\"bool\":{\"minimum_should_match\":1,\"should\":[{\"term\":{\"status\":\"pending\"}},{\"bool\":{\"must\":[{\"term\":{\"status\":\"processing\"}},{\"range\":{\"process_expiration\":{\"lte\":\"2021-01-16T08:46:31.204Z\"}}}]}}]}}}},\"sort\":[{\"priority\":{\"order\":\"asc\"}},{\"created_at\":{\"order\":\"asc\"}}],\"size\":10}","statusCode":503,"response":"{\"error\":{\"root_cause\":[{\"type\":\"cluster_block_exception\",\"reason\":\"blocked by: [SERVICE_UNAVAILABLE/1/state not recovered / initialized];\"}],\"type\":\"cluster_block_exception\",\"reason\":\"blocked by: [SERVICE_UNAVAILABLE/1/state not recovered / initialized];\"},\"status\":503}"}
    at respond (/usr/local/kibana-7.4.2-linux-x86_64/node_modules/elasticsearch/src/lib/transport.js:349:15)
    at checkRespForFailure (/usr/local/kibana-7.4.2-linux-x86_64/node_modules/elasticsearch/src/lib/transport.js:306:7)
    at HttpConnector.<anonymous> (/usr/local/kibana-7.4.2-linux-x86_64/node_modules/elasticsearch/src/lib/connectors/http.js:173:7)
    at IncomingMessage.wrapper (/usr/local/kibana-7.4.2-linux-x86_64/node_modules/elasticsearch/node_modules/lodash/lodash.js:4929:19)
    at IncomingMessage.emit (events.js:194:15)
    at endReadableNT (_stream_readable.js:1103:12)
    at process._tickCallback (internal/process/next_tick.js:63:19)
Could not create APM Agent configuration: Request Timeout after 30000ms
 error  [08:46:57.454] [warning][process] UnhandledPromiseRejectionWarning: Error: Request Timeout after 30000ms
    at /usr/local/kibana-7.4.2-linux-x86_64/node_modules/elasticsearch/src/lib/transport.js:397:9
    at Timeout.<anonymous> (/usr/local/kibana-7.4.2-linux-x86_64/node_modules/elasticsearch/src/lib/transport.js:429:7)
    at ontimeout (timers.js:436:11)
    at tryOnTimeout (timers.js:300:5)
    at listOnTimeout (timers.js:263:5)
    at Timer.processTimers (timers.js:223:10)
    at emitWarning (internal/process/promises.js:81:15)
    at emitPromiseRejectionWarnings (internal/process/promises.js:120:9)
    at process._tickCallback (internal/process/next_tick.js:69:34)
 error  [08:46:57.455] [warning][process] Error: Request Timeout after 30000ms
    at /usr/local/kibana-7.4.2-linux-x86_64/node_modules/elasticsearch/src/lib/transport.js:397:9
    at Timeout.<anonymous> (/usr/local/kibana-7.4.2-linux-x86_64/node_modules/elasticsearch/src/lib/transport.js:429:7)
    at ontimeout (timers.js:436:11)
    at tryOnTimeout (timers.js:300:5)
    at listOnTimeout (timers.js:263:5)
    at Timer.processTimers (timers.js:223:10)
解决方法:
配置ElasticSearch
cd /usr/local/elasticsearch-7.4.2/config
vi elasticsearch.yml
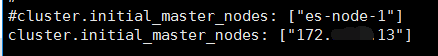
172.xx.xx.13 是这台服务器的内网地址。修改后重新启动ElasticSearch和Kibana
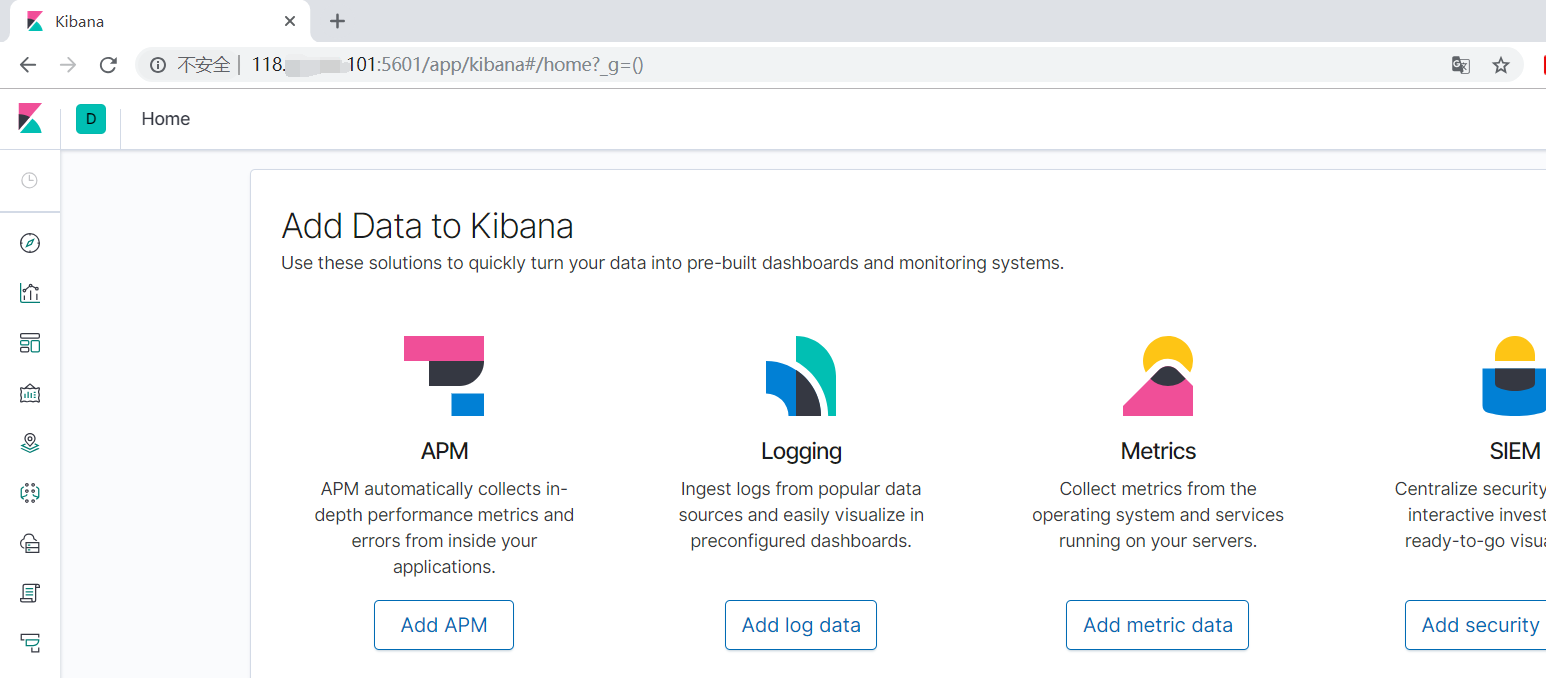
Kibana启动后的效果如下图所示:
作者:Work Hard Work Smart
出处:http://www.cnblogs.com/linlf03/
欢迎任何形式的转载,未经作者同意,请保留此段声明!

 浙公网安备 33010602011771号