


SpringCloud断路器监控面板——Hystrix Dashboard
一、简介
Hystrix Dashboard是Hystrix的一个组件,Hystrix Dashboard提供一个断路器的监控面板,可以使我们更好的监控服务和集群的状态,仅仅使用Hystrix Dashboard只能监控到单个断路器的状态,实际开发中还需要结合Turbine使用。
二、Hystrix Dashboard的使用
1、添加依赖

<dependency>
    <groupId>org.springframework.boot</groupId>
    <artifactId>spring-boot-starter-actuator</artifactId>
</dependency>
<dependency>
    <groupId>org.springframework.cloud</groupId>
    <artifactId>spring-cloud-starter-hystrix-dashboard</artifactId>
</dependency>
2、Springboot Application中添加注解,并启动程序
@EnableHystrixDashboard //开启Dashboard
3、查看面板
/health端点查看服务状态
/hystrix.stream端点查看指标流
浏览器中打开http://localhost:9999/hystrix 
图中提示数据源有三种:
http://turbine-hostname:port/turbine.stream (所有集群)
http://turbine-hostname:port/turbine.stream?cluster=[clusterName](指定名称的集群)
http://hystrix-app:port/hystrix.stream(单个应用)
我们选择第三个,点击Moitor Stream会自动生成监控面板,我们就可以实时监控数据 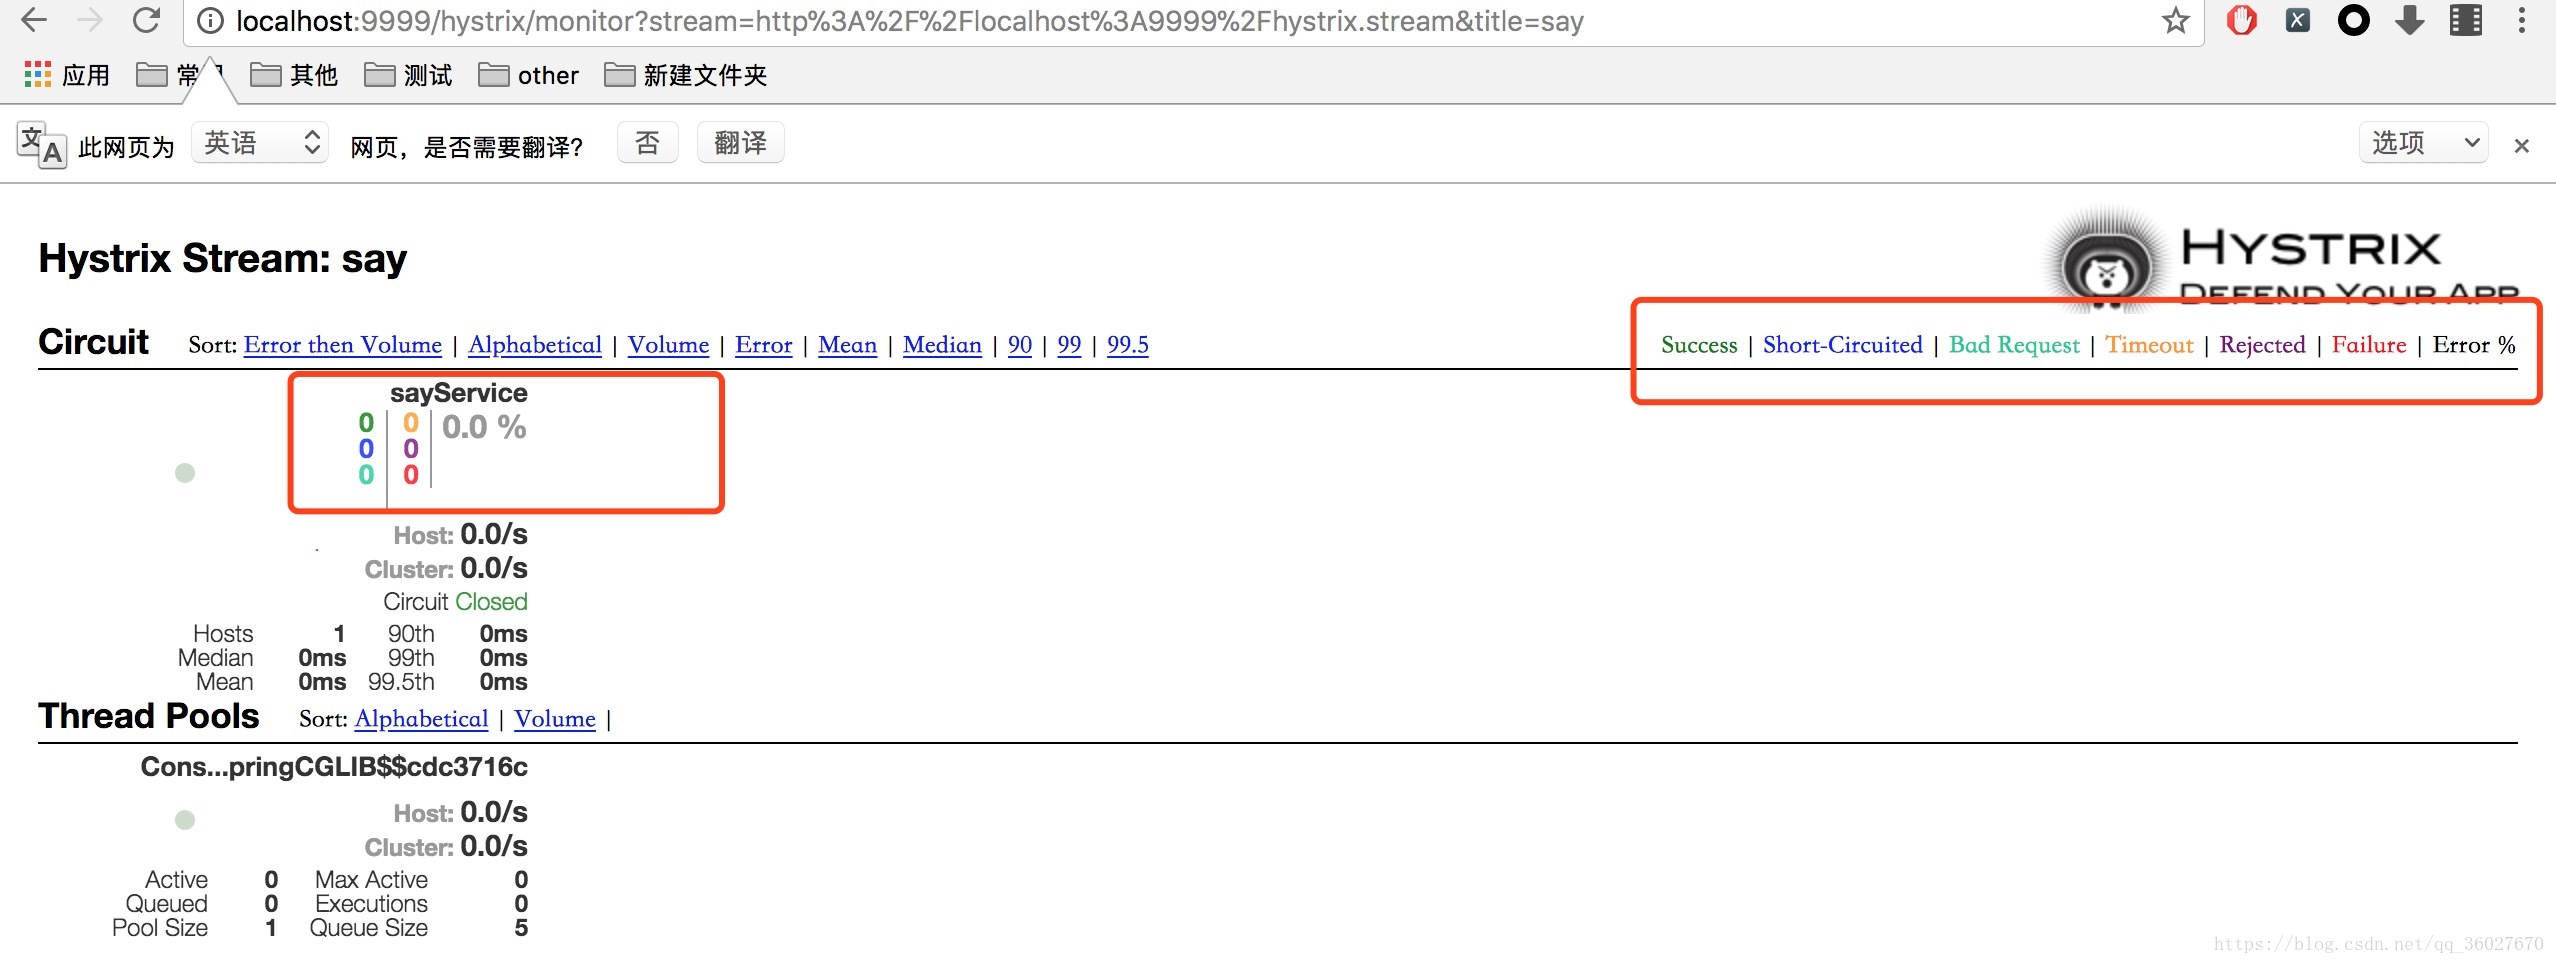
如果处于loading data状态,是因为没有数据,调用服务就可以加载数据了。
注意:在Feign负载均衡中使用Hystrix Dashboard,一定需要配置打开断路器,如下:
feign.hystrix.enabled=true
分类:
SpringCloud
标签:
SpringCloud
, Hystrix Dashboard
, Hystrix 面板监控
, Dashboard 面板监控
, 断路器面板监控
, Dashboard面板监控
, Hystrix面板监控


【推荐】国内首个AI IDE,深度理解中文开发场景,立即下载体验Trae
【推荐】编程新体验,更懂你的AI,立即体验豆包MarsCode编程助手
【推荐】抖音旗下AI助手豆包,你的智能百科全书,全免费不限次数
【推荐】轻量又高性能的 SSH 工具 IShell:AI 加持,快人一步
· 从 HTTP 原因短语缺失研究 HTTP/2 和 HTTP/3 的设计差异
· AI与.NET技术实操系列:向量存储与相似性搜索在 .NET 中的实现
· 基于Microsoft.Extensions.AI核心库实现RAG应用
· Linux系列:如何用heaptrack跟踪.NET程序的非托管内存泄露
· 开发者必知的日志记录最佳实践
· TypeScript + Deepseek 打造卜卦网站:技术与玄学的结合
· Manus的开源复刻OpenManus初探
· 写一个简单的SQL生成工具
· AI 智能体引爆开源社区「GitHub 热点速览」
· C#/.NET/.NET Core技术前沿周刊 | 第 29 期(2025年3.1-3.9)