


Client - Side fucntion on Power Portal with Power Apps
Add advanced client-side functionality
The purpose of this hands-on lab is to demonstrate how to add JavaScript code to a page to render data from Common Data Service as a chart by using another charting library. The data has been retrieved from Common Data Service by using a web template that acts as a REST API endpoint.
The exercises work best when you have sample data to work with. Depending on the environment that you are working with, you might want to install some sample data to assist with the exercises. Power Platform does provide the ability to add sample data as needed. If the environment that you are working in doesn't have sample data installed, follow the steps in the Add or remove sample data documentation to install the sample data into your environment.
Learning objectives
At the end of these exercises, you will be able to:
- Build a webpage that acts as a REST endpoint that returns data from Common Data Service.
- Add inline code to a content webpage to retrieve the data by using the endpoint.
- Use an external JavaScript library to consume the retrieved data.
Estimated time to complete this exercise: 15 to 20 minutes
Prerequisites
For this exercise, make sure that the following parameters are set up in your environment:
- A Power Apps portal that is provisioned. If you do not have a Power Apps portal available, follow the Create Portal instructions to create one.
- Access to the Power Apps maker portal.
High-level steps
To finish the exercise, complete the following tasks:
- Create a web template with Liquid code to retrieve data about accounts in Common Data Service and then return the data in JSON format.
- Add Page Template and Web Page records that use the web template that you created.
- Open a content page and add JavaScript code that retrieves the data.
- Add a charting library to the page and JavaScript code by using the library to build a graph with the retrieved data.
Create a web template
To create a web template, follow these steps:
-
Open Dynamics 365 Home .
-
Select the Portals Management app.
-
Select Web Templates.
-
Select + New.
-
Enter the following values:
- Name - getAccounts
- Website - Select your current website
- Source - Enter the following content
- MIME Type - application/json
twig{% fetchxml accounts %} <fetch> <entity name="account"> <attribute name="name" /> <attribute name="numberofemployees" /> <attribute name="revenue" /> </entity> </fetch> {% endfetchxml %} [ {% for account in accounts.results.entities -%} { "x": {{ account.numberofemployees }}, "y": {{ account.revenue }}, "z": {{ account.revenue | divided_by: account.numberofemployees }}, "name": "{{ account.name }}" }{% unless forloop.last %},{% endunless %} {% endfor -%} ] -
Press Save & Close.
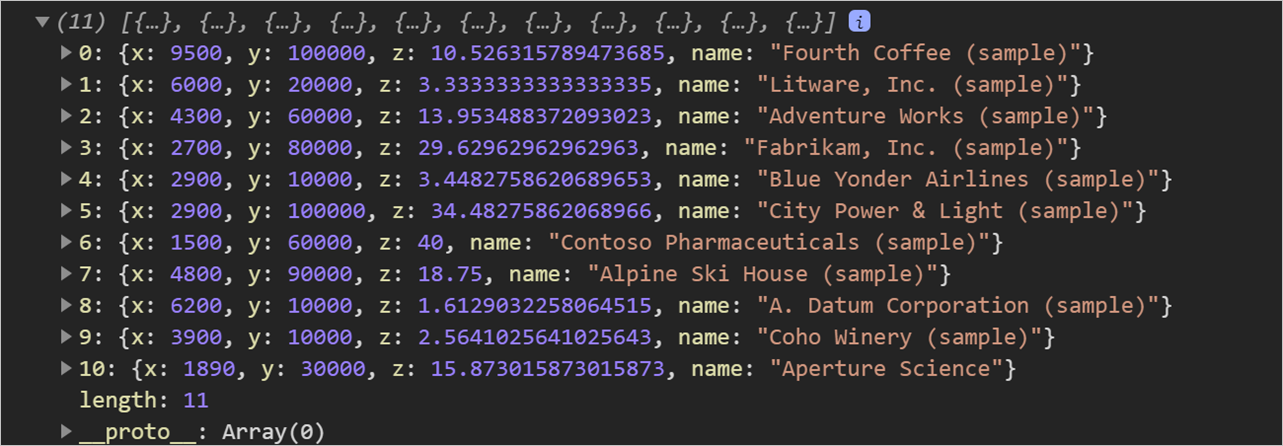
This Liquid code retrieves the list of accounts and then generates a data structure in JSON format. The data structure is already prepared for plotting by assigning appropriate labels to data points:
- name - Company name
- x - Number of employees
- y - Company revenue in thousands
- z - Revenue for each employee (calculated)
Create a page template and a webpage
To create a page template and a webpage, follow these steps:
- Select Page Templates.
- Select + New.
- Enter the following values:
- Name - getAccounts
- Website - Select your current website
- Type - Select Web Template
- Web Template - Select getAccounts
- Use Website Header and Footer - Clear the check box
- Select Save & Close.
- Select Web Pages.
- Select + New.
- Enter the following values:
- Name - getAccounts
- Website - Select your current website
- Parent Page - Select Home
- Partial URL - getAccounts
- Page Template - getAccounts
- Publishing State - Published
- Select Save & Close.
Important
If you have not previously configured entity permissions for the account entity, your API page will return an empty array. Complete the next task to set up the permissions if you have not done so previously.
Add entity permissions
To add entity permissions, follow these steps:
- Switch to the Portal Management app.
- Select Entity Permissions.
- Select + New.
- Enter the following values:
- Name - Account Directory
- Entity Name - Select account entity
- Website - Select your current website
- Scope - Select Global
- Privileges - Select Read
- Select Save.
- Scroll to the Web Roles subgrid.
- Select Add Existing Web Role.
- Locate and select Anonymous users and Authenticated users.
- Select Add.
Test the REST webpage
Go to https://yourportal.powerappsportals.com/getAccounts.
Your output should look like the following example:

Add code to retrieve the data
To add code to retrieve the data, follow these steps:
-
Open Power Apps portals Studio in a new browser tab and then follow these steps:
- Go to Power Apps maker portal .
- Select the target environment by using the environment selector in the upper-right corner.
- From the Apps list, select the application of type Portal.
- Select the Edit menu.
-
Select the Pages icon on the tool belt on the left side.
-
Select an existing page from the hierarchy, for example Product B located under the Services page.
Note
The names and hierarchy of pages on your portal might differ.
-
Select the Page Copy area on the page.
-
Select Components on the tool belt.
-
Select One-column section.
-
Select Added section and then select the source code editor icon.
-
Insert the following code as the content of the innermost div element:
HTML<script> function makeChart(rData) { console.log(rData); } $(document).ready(function() { $.get('/getAccounts', makeChart, 'json'); }); </script> -
Select Save.
-
Select Browse website.
-
When the page is displayed, press the F12 key to display browser developer tools.
-
Verify that the console output contains the same data as previously retrieved by the REST API page.

Important
If you have not previously configured entity permissions for the account entity, your API call will return an empty array. Make sure that you have completed the Add entity permissions task.
Add external library functionality
This exercise uses Highcharts.js library (free for personal or non-profit use) to create a bubble chart based on the data.
-
Switch to portals Studio.
-
Locate and open the content page that you previously modified.
-
Select the section that you previously modified.
-
Insert the following code either above or below the previous code:
HTML<script src="https://code.highcharts.com/highcharts.js"></script> <script src="https://code.highcharts.com/highcharts-more.js"></script> <figure> <div class="mychart"></div> </figure> -
Modify the makeChart function as follows:
JavaScriptfunction makeChart(rData) { console.log(rData); Highcharts.chart($('.mychart')[0], { title: { text: "Customers efficiency" }, legend: { enabled: false }, xAxis: { title: { text: "Number of employees" } }, yAxis: { title: { text: "Turnover ($K)" } }, tooltip: { pointFormat: '<strong>{point.name}</strong><br/>Employed: {point.x}<br>Turnover ($K): ${point.y}', headerFormat: '' }, series: [{ type: 'bubble', data: rData }] }); } -
Select Save.
-
Select Browse website.
-
The output should now include the bubble chart. Hover over the bubbles to verify the data.


posted on 2020-11-13 09:33 lingdanglfw 阅读(167) 评论(0) 编辑 收藏 举报

【推荐】国内首个AI IDE,深度理解中文开发场景,立即下载体验Trae
【推荐】编程新体验,更懂你的AI,立即体验豆包MarsCode编程助手
【推荐】抖音旗下AI助手豆包,你的智能百科全书,全免费不限次数
【推荐】轻量又高性能的 SSH 工具 IShell:AI 加持,快人一步
· Linux系列:如何用 C#调用 C方法造成内存泄露
· AI与.NET技术实操系列(二):开始使用ML.NET
· 记一次.NET内存居高不下排查解决与启示
· 探究高空视频全景AR技术的实现原理
· 理解Rust引用及其生命周期标识(上)
· DeepSeek 开源周回顾「GitHub 热点速览」
· 物流快递公司核心技术能力-地址解析分单基础技术分享
· .NET 10首个预览版发布:重大改进与新特性概览!
· AI与.NET技术实操系列(二):开始使用ML.NET
· 单线程的Redis速度为什么快?