python库之matplotlib
学习资源
http://matplotlib.org/api/pyplot_api.html
http://old.sebug.net/paper/books/scipydoc/matplotlib_intro.html
https://campus.datacamp.com/courses/intermediate-python-for-data-science/matplotlib?ex=2
图片示例
http://matplotlib.org/gallery.html
plot:基址图,二维线画图
x-axis:x轴
horizontal:水平轴
y-axis:y轴
vertical:纵轴
scatter ploat:散点图
histogram:柱状图
customize:定制
xlabel
ylabel
title
xticks
yticks
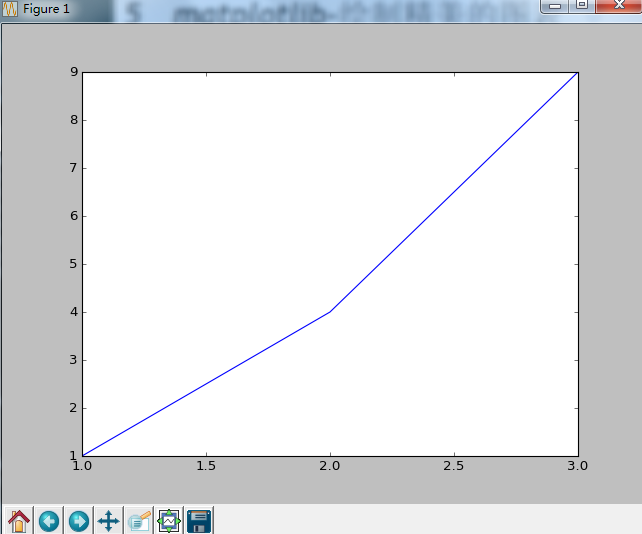
1.画线图
year = [2001,2002,2003]
population = [12,13,14]
打印列表的最后一个元素
print(year[-1])
import matplotlib.pyplot as plt
plt.plot(year, population)
plt.show()
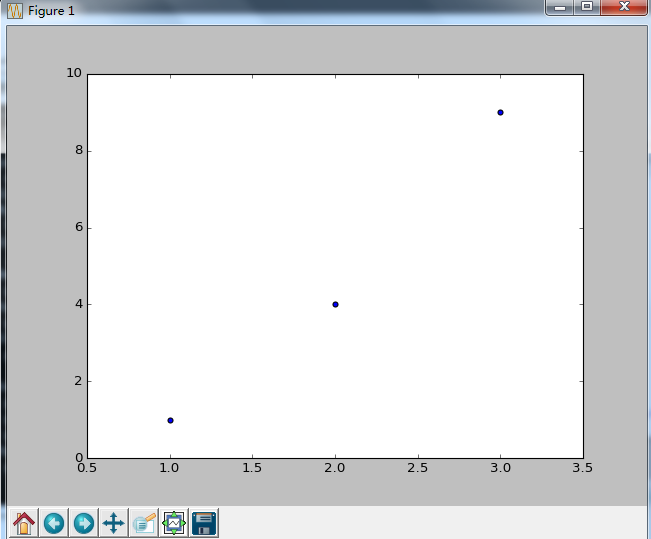
2.画散点图
plt.scatter(year,population)
plt.show()
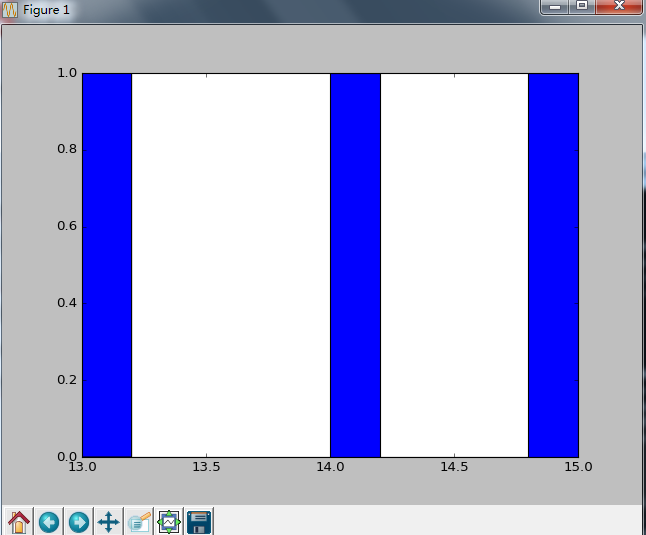
3.画柱状图
population = [12,13,14,15]
plt.hist(population)

 浙公网安备 33010602011771号