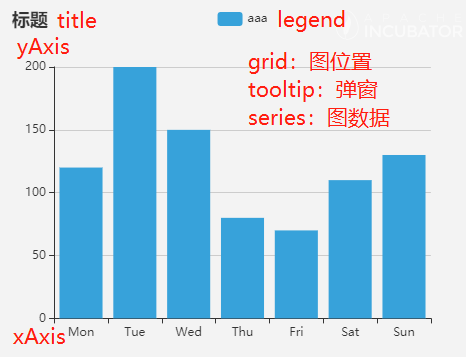
一、echarts常用属性

二、3D地图
1、安装
npm i -S echarts@4.9.0 echarts-gl//echarts5会报错
2、编码
a、geojson
{
  "type": "FeatureCollection",
  "features": [
    {
      "type": "Feature",
      "geometry": {
        "type": "MultiPolygon",
        "coordinates": [
          [
            [[40,40],[20,45],[45,30],[40,40]]
          ],
          [
            [[20,35],[10,30],[10,10],[30,5],[45,20],[20,35]],
            [[30,20],[20,15],[20,25],[30,20]]
          ]
        ]
      },
      "properties": {
        "name": "区域一"
      }
    }
  ]
}
b、vue
<template>
  <div style="height:100%;background-color: #999999">
    <div id="echartsmap" style="height:100%"></div>
  </div>
</template>

<script>
  import echarts from 'echarts';
  import 'echarts-gl';
  import geojson from "./geojson.json";

  export default {
    name: "a5",
    mounted() {
      this.initmap()
    },
    methods: {
      initmap() {
        let myChart = echarts.init(document.getElementById("echartsmap"))
        echarts.registerMap("geojson", geojson)

        let option = {
          tooltip: {},
          series: [
            {
              type: "map3D",
              map: "geojson",
              label: {
                show: true
              },
              itemStyle: {
                color: [255, 255, 0, 0.5],
                borderWidth: 1,
                borderColor: '#333333'
              },
              emphasis: {
                itemStyle: {
                  color: [0, 255, 0, 0.5]
                }
              }
            }
          ]
        }
        myChart.setOption(option)

        myChart.on('click', function (params) {
          // console.log(params);
          option.series[0].data = [{
            name: params.data.name,
            itemStyle: {
              color: [0, 255, 0, 0.5]
            }
          }]
          myChart.setOption(option)
        });
      }
    }
  }
</script>

<style scoped>

</style>


