ELK搭建
一、ELK介绍
1. ELK简介
ELK是Elasticsearch、Logstash、Kibana三大开源框架首字母大写简称(但是后期出现的filebeat(beats中的一种)可以用来替代logstash的数据收集功能,比较轻量级)。市面上也被成为Elastic Stack。
Filebeat是用于转发和集中日志数据的轻量级传送工具。Filebeat监视您指定的日志文件或位置,收集日志事件,并将它们转发到Elasticsearch或 Logstash进行索引。Filebeat的工作方式如下:启动Filebeat时,它将启动一个或多个输入,这些输入将在为日志数据指定的位置中查找。对于Filebeat所找到的每个日志,Filebeat都会启动收集器。每个收集器都读取单个日志以获取新内容,并将新日志数据发送到libbeat,libbeat将聚集事件,并将聚集的数据发送到为Filebeat配置的输出。
Logstash是免费且开放的服务器端数据处理管道,能够从多个来源采集数据,转换数据,然后将数据发送到您最喜欢的“存储库”中。Logstash能够动态地采集、转换和传输数据,不受格式或复杂度的影响。利用Grok从非结构化数据中派生出结构,从IP地址解码出地理坐标,匿名化或排除敏感字段,并简化整体处理过程。
Elasticsearch是Elastic Stack核心的分布式搜索和分析引擎,是一个基于Lucene、分布式、通过Restful方式进行交互的近实时搜索平台框架。Elasticsearch为所有类型的数据提供近乎实时的搜索和分析。无论您是结构化文本还是非结构化文本,数字数据或地理空间数据,Elasticsearch都能以支持快速搜索的方式有效地对其进行存储和索引。
Kibana是一个针对Elasticsearch的开源分析及可视化平台,用来搜索、查看交互存储在Elasticsearch索引中的数据。使用Kibana,可以通过各种图表进行高级数据分析及展示。并且可以为 Logstash 和 ElasticSearch 提供的日志分析友好的 Web 界面,可以汇总、分析和搜索重要数据日志。还可以让海量数据更容易理解。它操作简单,基于浏览器的用户界面可以快速创建仪表板(dashboard)实时显示Elasticsearch查询动态
2. 完整日志系统基本特征
- 收集:能够采集多种来源的日志数据
- 传输:能够稳定的把日志数据解析过滤并传输到存储系统
- 存储:存储日志数据
- 分析:支持 UI 分析
- 警告:能够提供错误报告,监控机制
二、ELK部署
elk各个组件的网址可以在官网下载:https://www.elastic.co/cn/
或者在中文社区下载:https://elasticsearch.cn/download/
2.1 Elasticsearch安装
安装包下载:https://artifacts.elastic.co/downloads/elasticsearch/elasticsearch-6.3.2.tar.gz
1、安装jdk,es启动需要依赖java环境
# tar zxf jdk-8u191-linux-x64.tar.gz  -C  /usr/local/
# cd /usr/local/jdk1.8.0_191/
# pwd
/usr/local/jdk1.8.0_191

# vim /etc/profile
export JAVA_HOME=/usr/local/jdk1.8.0_191
export PATH=$PATH:$JAVA_HOME/bin

# source /etc/profile
# java -version
java version "1.8.0_191"
Java(TM) SE Runtime Environment (build 1.8.0_191-b12)
Java HotSpot(TM) 64-Bit Server VM (build 25.191-b12, mixed mode)
2、解压es包
# tar zxf elasticsearch-6.3.2.tar.gz -C /usr/local/
3、创建elasticsearch用户
# useradd es
# echo 123456 |passwd es --stdin
# chown -R es.es /usr/local/elasticsearch-6.3.2/
4、修改es的配置文件
# vim /usr/local/elasticsearch-6.3.2/config/elasticsearch.yml
path.data: /usr/local/elasticsearch-6.3.2/data    #修改data存放的路径
path.logs: /usr/local/elasticsearch-6.3.2/logs    #修改logs日志的路径
network.host: 172.16.68.169                        #监听的网络地址
http.port: 9200                                    #开启监听的端口

# mkdir /usr/local/elasticsearch-6.3.2/data        创建data目录
# chown -R /usr/local/elasticsearch-6.3.2/data
5、配置config/jvm.options
# vim /usr/local/elasticsearch-6.3.2/config/jvm.options 根据自身环境修改启动需要的内存

-Xms512m
-Xmx512m
6、linux系统参数设置
vim /etc/security/limits.conf #永久修改
* soft nofile 65536
* hard nofile 65536
* soft nproc 4096
* hard nproc 4096
* soft memlock unlimited
* hard memlock unlimited

配置虚拟内存
sysctl -w vm.max_map_count=262144 #临时修改该值
vim /etc/sysctl.conf #永久修改
vm.max_map_count=262144
sysctl -p
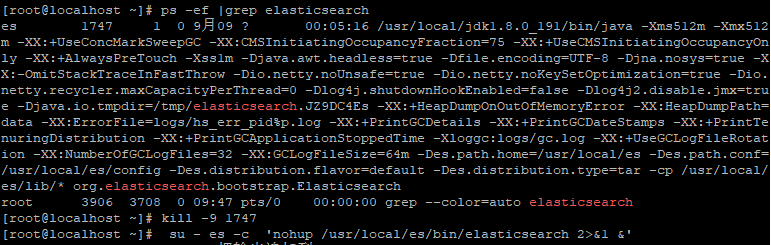
7、启动es
# su - es -c 'nohup /usr/local/es/bin/elasticsearch 2>&1 &'
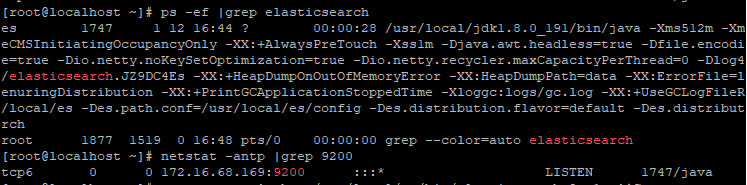
# curl http://172.16.68.169:9200
{
  "name" : "BYraTdr",
  "cluster_name" : "elasticsearch",
  "cluster_uuid" : "JypXZhZ2TEa3HeDM6tshhw",
  "version" : {
    "number" : "6.3.2",
    "build_flavor" : "default",
    "build_type" : "tar",
    "build_hash" : "053779d",
    "build_date" : "2018-07-20T05:20:23.451332Z",
    "build_snapshot" : false,
    "lucene_version" : "7.3.1",
    "minimum_wire_compatibility_version" : "5.6.0",
    "minimum_index_compatibility_version" : "5.0.0"
  },
  "tagline" : "You Know, for Search"
}
8、安装elasticsearch-head插件
由于head插件本质上还是一个nodejs的工程,因此需要安装node,使用npm来安装依赖的包。
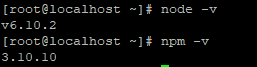
(1)安装node.js
# wget https://nodejs.org/dist/v6.10.2/node-v6.10.2-linux-x64.tar.xz
# tar xf node-v6.10.2-linux-x64.tar.xz
# mv node-v6.10.2-linux-x64 /usr/local/

# tail /etc/profile
export PATH=$PATH:/usr/local/node-v6.10.2-linux-x64/bin

# source /etc/profile
(2)下载head插件
# yum install -y git
# git clone https://github.com/mobz/elasticsearch-head.git
# cd elasticsearch-head/
# npm install -g grunt --registry=https://registry.npm.taobao.org
# npm install
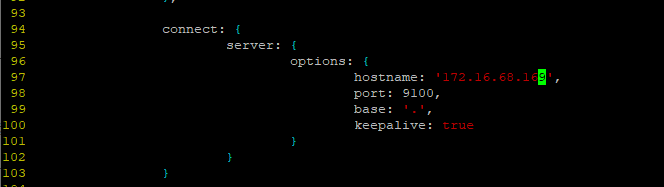
(3)修改配置elasticsearch-head下Gruntfile.js文件
修改connect配置节点
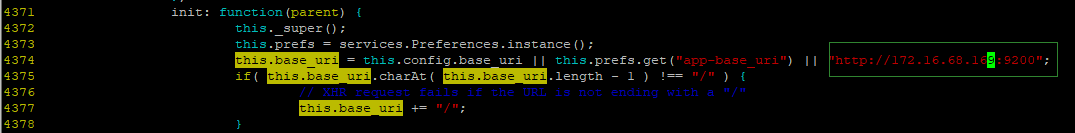
修改 _site/app.js 修改http://localhost:9200字段到本机ES端口与IP
(4)修改es配置文件elasticsearch.yml
# tail elasticsearch.yml

# 是否支持跨域
http.cors.enabled: true

# *表示支持所有域名
http.cors.allow-origin: "*"
之后重启es
(5)启动head插件服务(后台运行)
# elasticsearch-head/node_modules/grunt/bin/grunt server &


2.2 logstash安装
# tar zxf logstash-6.3.2.tar.gz -C /usr/local/
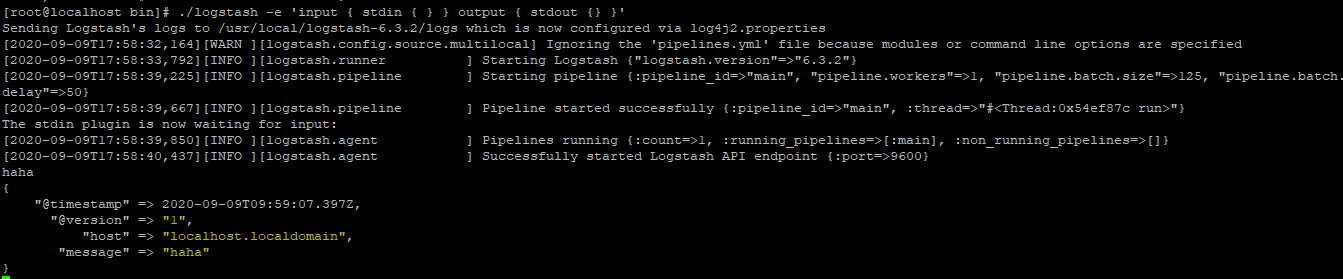
# cd /usr/local/logstash-6.3.2/bin
# ./logstash -e 'input { stdin { } } output { stdout {} }'
logstash使用配置文件
官方指南:
https://www.elastic.co/guide/en/logstash/current/configuration.html

创建配置文件
# mkdir /usr/local/logstash-6.3.2/conf.d
# vim /usr/local/logstash-6.3.2/conf.d/elk.conf
input {
file {
path => "/var/log/messages"
type => "messages"
start_position => "beginning"
}
}
filter {
grok {
match => { "message" => "%{COMBINEDAPACHELOG}"}
}
}
output {
elasticsearch {
hosts => ["172.16.68.169:9200"]
index => "messages-log-%{+YYYY.MM.dd}"
}
}
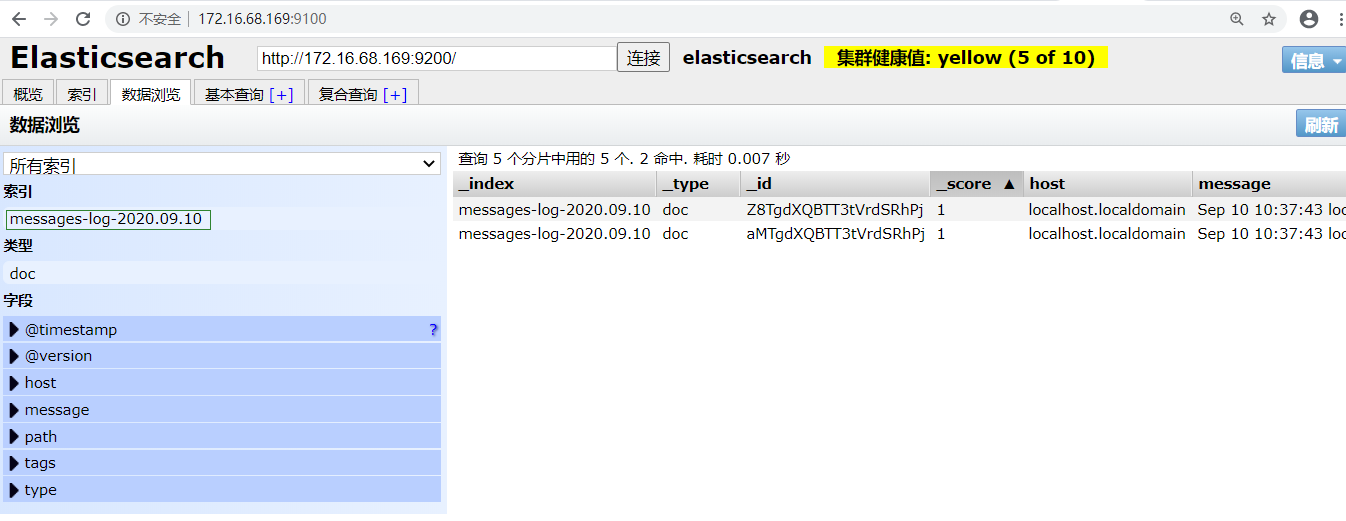
使用配置文件运行logstash
# /usr/local/logstash-6.3.2/bin/logstash -f /usr/local/logstash.3.2/conf.d/elk.conf  &
执行的结果(查看elasticsearch集群):
2.3 Kibana安装
# tar zxf kibana-6.3.2-linux-x86_64.tar.gz  -C /usr/local/
# cd /usr/local/kibana-6.3.2-linux-x86_64/
# vim config/kibana.yml

server.port: 5601
server.host: "172.16.68.169"
elasticsearch.hosts: ["http://172.16.68.169:9200"]
kibana.index: ".kibana"
启动Kibana
# /usr/local/kibana-6.3.2-linux-x86_64/bin/kibana &

# netstat  -antp |grep 5601
tcp        0      0 172.16.68.169:5601      0.0.0.0:*               LISTEN      6070/node
参考:https://www.cnblogs.com/cheyunhua/p/11238489.html
https://www.cnblogs.com/xiaojianfeng/p/9435507.html
https://www.cnblogs.com/zsql/p/13164414.html
