图例:
import numpy as np
import matplotlib.pyplot as plt
#解决能显示中文
plt.rcParams['font.sans-serif']=['SimHei'] #指定默认字体 SimHei为黑体
plt.rcParams['axes.unicode_minus']=False #用来正常显示负号
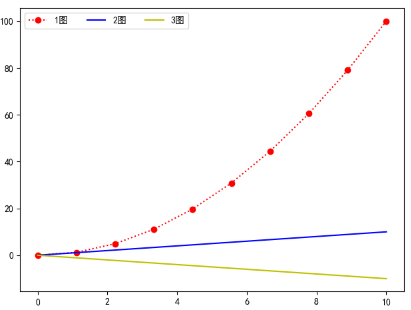
x=np.linspace(0,10,10)
y=x**2
fig=plt.figure()
ax=fig.add_subplot(1,1,1)
ax.plot(x,y,linestyle=':',marker='o',color='r',label='1图')
ax.plot(x,x,color='b',label='2图')
ax.plot(x,-x,color='y',label='3图')
ax.legend(loc=0,ncol=3) #画出图例
# loc: 表示位置,包括'upper right','upper left','lower right','lower left'等
# bbox_to_anchor: 表示legend距离图形之间的距离,当出现图形与legend重叠时,可使用bbox_to_anchor进行调整legend的位置
# 由两个参数决定,第一个参数为legend距离左边的距离,第二个参数为距离下面的距离
#'upper right'=1;'upper left'=2;'lower left'=3;'lower right'=4; 0 自适应找位置
#ncol 图例的列数
plt.show()


【推荐】国内首个AI IDE,深度理解中文开发场景,立即下载体验Trae
【推荐】编程新体验,更懂你的AI,立即体验豆包MarsCode编程助手
【推荐】抖音旗下AI助手豆包,你的智能百科全书,全免费不限次数
【推荐】轻量又高性能的 SSH 工具 IShell:AI 加持,快人一步
· 基于Microsoft.Extensions.AI核心库实现RAG应用
· Linux系列:如何用heaptrack跟踪.NET程序的非托管内存泄露
· 开发者必知的日志记录最佳实践
· SQL Server 2025 AI相关能力初探
· Linux系列:如何用 C#调用 C方法造成内存泄露
· 震惊!C++程序真的从main开始吗?99%的程序员都答错了
· 别再用vector<bool>了!Google高级工程师:这可能是STL最大的设计失误
· 【硬核科普】Trae如何「偷看」你的代码?零基础破解AI编程运行原理
· 单元测试从入门到精通
· 上周热点回顾(3.3-3.9)