论文阅读(Xiang Bai——【arXiv2016】Scene Text Detection via Holistic, Multi-Channel Prediction)
Xiang Bai——【arXiv2016】Scene Text Detection via Holistic, Multi-Channel Prediction
目录
- 作者和相关链接
- 方法概括
- 创新点和贡献
- 方法细节
- 实验结果
- 问题讨论
- 总结与收获点
- 参考文献
-
作者和相关链接
- 作者

-
方法概括
- Step 1: 用修改版的hed(参考文献1)得到text region map(binary), character map(binary), linking orientation map(gray).
- cnn → fcn的改进:1. 全连接→全卷积; 2. 多个中间层进行反卷积(或称去卷积,上采样),并把反卷积后得到的feature map进行融合(1*1卷积),得到一个dense prediction map
- fcn → hed的改进:加入dsn(参考文献2),即每一个中间层反卷积时是利用了监督信息,由groundTruth图与预测图算loss反向传播(只更新旁路的参数?)
- hed → 本文方法的框架:不只生成1个response map,而是同时利用了三种监督信息,生成3个response map——text region map,character map,linking orientation map
- Step 1: 用修改版的hed(参考文献1)得到text region map(binary), character map(binary), linking orientation map(gray).
-
- Step 2: 每个text region上的character作为顶点,character之间的相似性作为边,构建图模型,用最大生成树(参考文献3)求最小割,得到每个文本线;
- 相似性包括空间相似性和方向相似性
- 空间相似性是要求同一text region里的character距离相近
- 方向相似性是要求每两个character形成的直线方向与linking orientation map预测的方向尽可能一致
- Step 2: 每个text region上的character作为顶点,character之间的相似性作为边,构建图模型,用最大生成树(参考文献3)求最小割,得到每个文本线;

Fig. 3. Pipeline of the proposed algorithm. (a) Original image. (b) Prediction maps. From left to right: text region map, character map and linking orientation map.
For better visualization, linking orientations are represented with color-coded lines and only those within text regions are shown. (c) Detections.
-
创新点和贡献
- 把文字检测问题看做成语义分割的问题(体现在生成三个map是用dense prediction的方法,逐像素的概率,而不是一个patch块的概率)
- 把“预测文字区域概率”,“预测字符概率”,“预测相邻字符连接概率”三个问题整合到一个网络中去进行整体学习(利用的监督信息更多了,端到端学习)
-
方法细节
-
Step 1:生成3个map
- 网络结构图
-
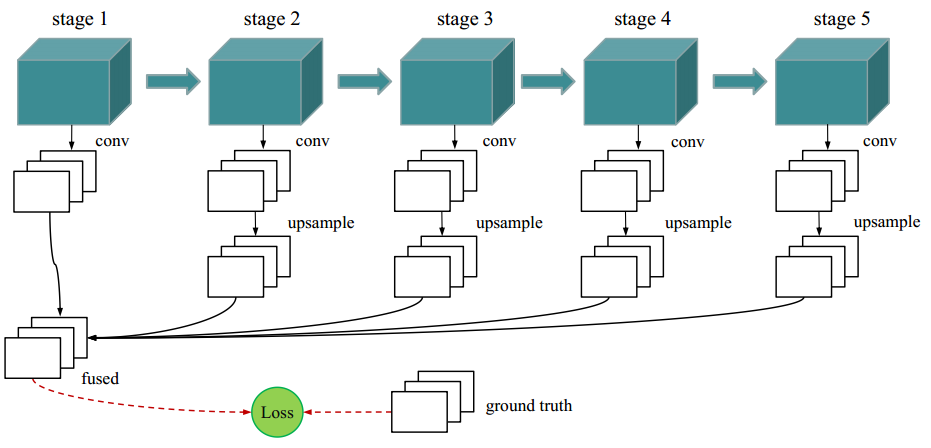
Fig. 6. Network architecture of the proposed algorithm. The base network is inherited from HED [52], which made surgery on the pretrained VGG-16 Net model [44]
-
-
-
- Stage 1~Stage 5:VGG16的前5层
-
-

VGG16的网络配置表格(本文方法standard层只去了图中橙色区域部分)
-
-
-
- 5 Side-output layers:在conv1_2, conv2_2, conv3_3, conv4_3 and conv5_3后接1个conv层,在2~5个stage后分别接1个deconv层(第1个stage后不接上采样层,因为第1个stage还没有经过任何一次pooling,大小和原图一样)
- confusion layer : 把5个side-output的text region, character, linking orientation 的map分别进行1*1卷积得到3个map,3个map分别与对应的groudTruth的3个map算loss,再把loss加权求和
- 由于side层的loss影响很小,所以总的loss=fuse层的loss,W表示的是standard层的参数(VGG16的那5个stage参数),w表示的是side-output层和confuse层的参数
-
-

-
-
-
-
- 总的fuse层loss由三部分构成,text region(Δr),character(Δc),以及linking orientation(Δo),λ1、λ2、λ3用来调整3个损失函数的权重,人为设定,实验中取1/3
-
-
-


-
-
-
-
- text region和character的loss由于都是0-1值,故可以用类似于logistic regression的对数似然损失函数cost function(不同的是,带了一定权值)
- 普通logistic regression的损失函数
- text region和character的loss由于都是0-1值,故可以用类似于logistic regression的对数似然损失函数cost function(不同的是,带了一定权值)
-
-
-

-
-
-
-
-
- 本文用的带权损失函数
- 以text region为例,character的类似:
- 本文用的带权损失函数
-
-
-
-


-
-
-
-
-
-
- 其中,
 ,|R_|表示的non-text区域像素的个数,|R|表示的是所有的像素个数。(为什么这里第一项不是1-β,而是β?)
- 其中,
-
-
linking orientation的loss和其他两个不同,用的是角度差的sin值:
-
-
-
-

-
-
- 训练样本
-
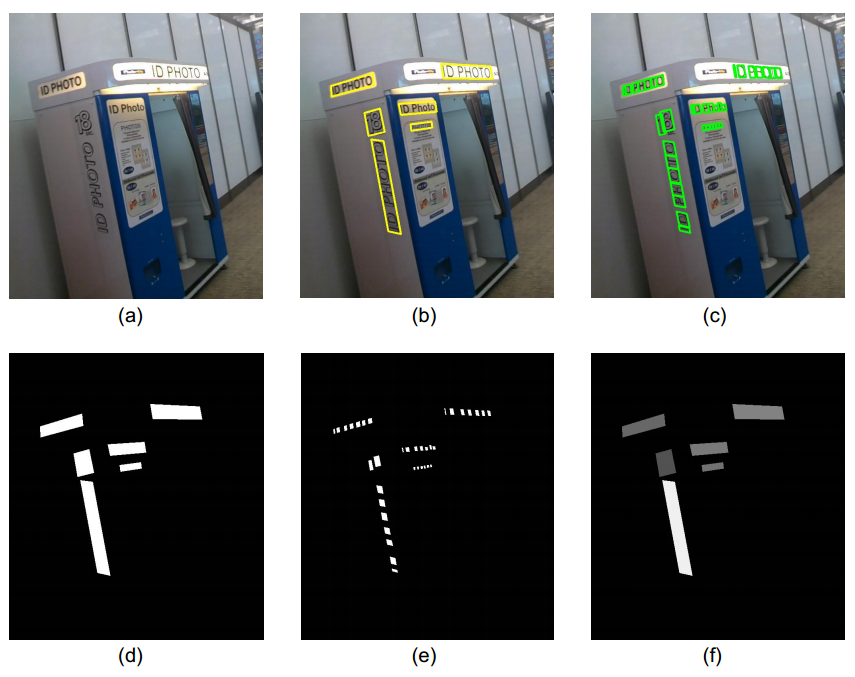
Fig. 4. Ground truth preparation. (a) Original image. (b) Ground truth polygons of text regions. (c) Ground truth polygons of characters.
(d) Ground truth map for text regions. (e) Ground truth map for characters. (f) Ground truth map for linking orientations.
-
-
-
- text region正样本:在word级groundTruth的bounding box中所有像素点(图d中白色区域)——text region级
- character正样本:在character级groundTruth的bounding box的一半(宽高各是原来的一半,为了防止字符粘连)的所有像素点(图e中白色区域)——character级
- linking orientation正样本: 在word级groundTruth的bounding box中同一个单词的所有像素点像素值一样,值为这个单词的bounding box的方向(在[-Π/2, Π/2]之间,并归一到[0,1]之间)(图f中白色区域)——word级
-
-
-
-
- 三种prediction map示例
-

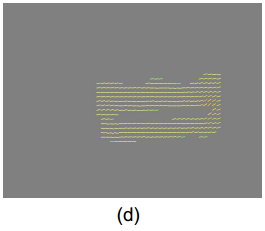
Fig. 5.. (a) Original image. (b) Prediction map of text regions. (c) Prediction map of characters. (d) Prediction map of linking orientations.
-
-
Step 2:融合3个map,生成检测结果
- 第一,用text region map生成每个candidate of text region(矩形,连通分量分析?)
-
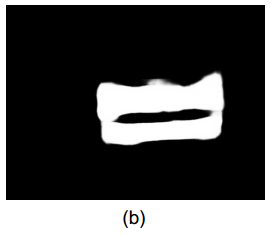
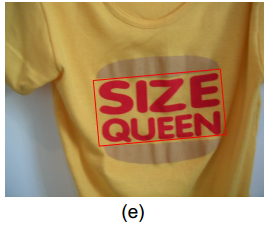
Fig. 5. Detection formation. (b) Prediction map of text regions. (e) Text region (red rectangle).
-
-
- 第二,在每个text region里生成candidates of characters(连通分量分析?)
-
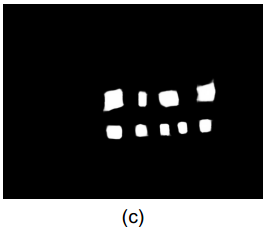
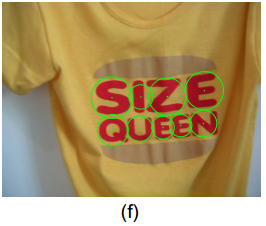
Fig. 5. Detection formation. (b) Prediction map of characters. The center and radius of the circles represent the location and scale of the
corresponding characters. (f) Characters (green circles)
-
-
- 第三,每个text region 里的所有candidates of characters构建一个图模型,每个character为一个顶点,用delaunay triangulation(参考文献4)生成的三角形的边作为每两个顶点的边,边的权值定义为两个字符的相似性
-
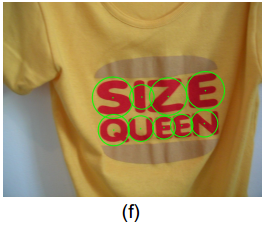
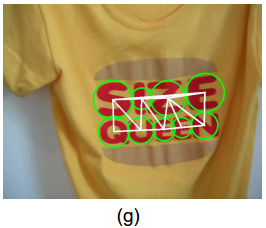
Fig. 5. Detection formation. (b) Prediction map of characters. (g) Delaunay triangulation.
-
-
-
- Delaunay triangulation?【待补充】
-
-
-
-
-
- 相似性度量
- 相似性度量s = 空间相似性a + 方向相似性o
- 相似性度量
-
-

-
-
-
-
- 空间相似性是要求同一text region里的character距离相近
-
-
-

-
-
-
-
-
-
- d(i,j)表示两个节点(character的中心)的欧氏距离
- D表示所有边的平均值(图g中的所有白线的均值)
-
-
-
-
-
-
-
-
-
- 方向相似性是要求每两个character形成的直线方向与linking orientation map预测的方向尽可能一致
-
-
-

-
-
-
-
-
-
- Φ(i,j)表示两个节点(character的中心)形成的直线的角度(与水平的夹角)
- Ψ(i,j)表示在linking orientation map上两个节点之间的区域的所有像素点的平均值(linking orientation map上的每个像素点的值表示该像素点的方向角度)
- Λ操作表示计算两个角度之间的夹角
-
-
-
-
-
-
-
- 第四,用最大生成树(参考文献5)求图模型的割,割中的每个集合组成一个text line
-
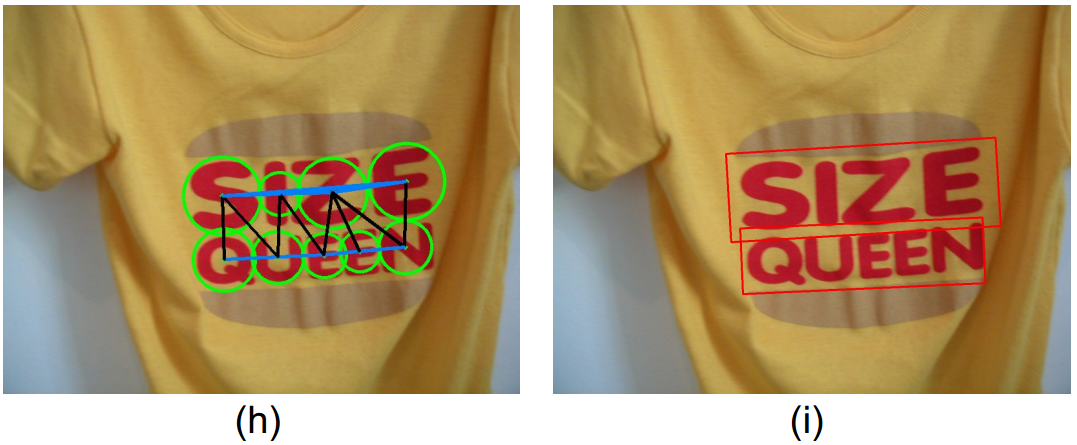
Fig. 5. (h) Graph partition. Blue lines: linkings retained. Black lines: linkings eliminated.(i) Detections.
-
-
-
- 如何确定割中子集的个数K?
- 公式中使得Svm最大的k值
- 公式中使得Svm最大的k值
- 如何确定割中子集的个数K?
-
-

-
-
-
-
-
-
-
- λi1和λi2表示Ci的第一大和第二大特征根(二者比值越大的物理意义是什么?)
- Ci是第i个cluster的所有字符中心的坐标的协方差矩阵
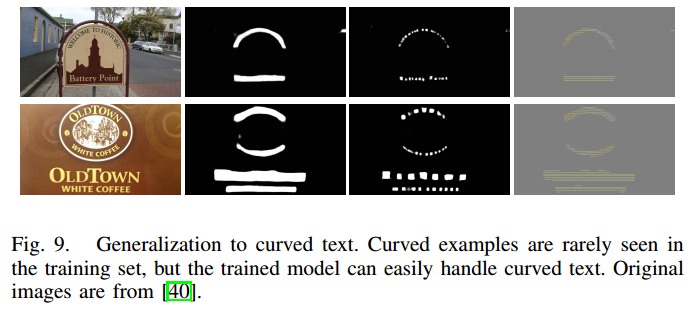
- 该假设是建立在字符是线性或者近线性的条件上,当处理非线性时,设置一个阈值T(0.8),当边的权重大于T时,该边不被选择,或者不被消除,则就可以处理curved的文本(原理是什么?)
-
-
-
-
-
-
-
-
-
- 最大生成树的细节?【待补充】
-
-
-
实验结果
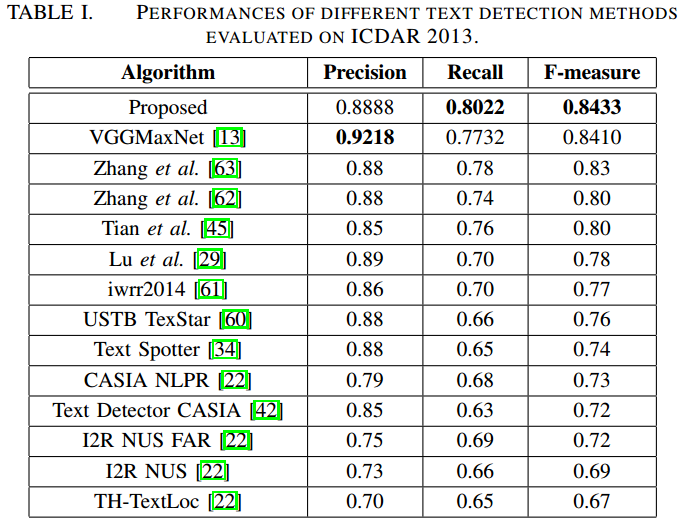
- ICDAR2013
-
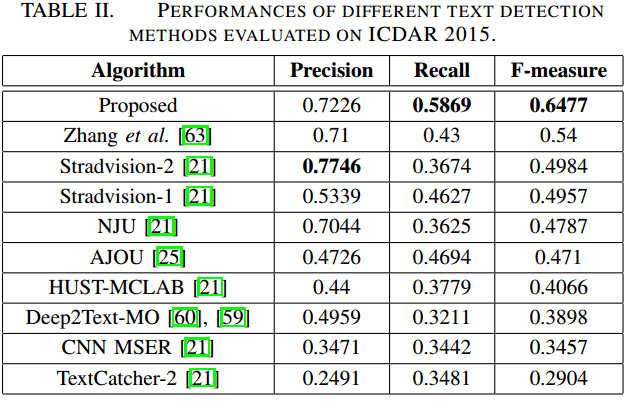
- ICDAR2015
-
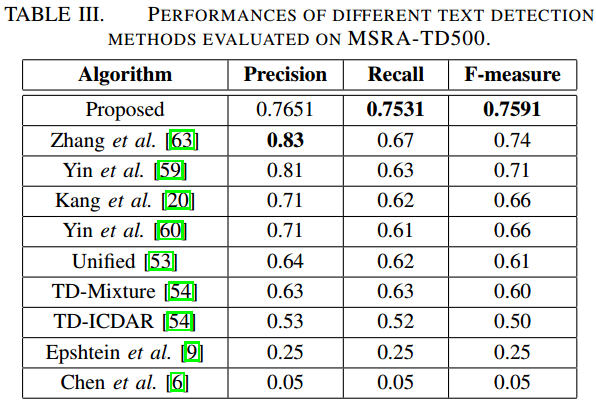
- MSRA-TD500
-
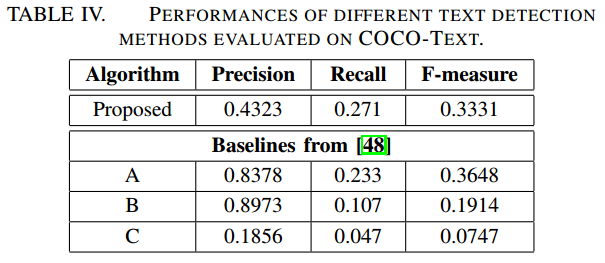
- COCO-text
-
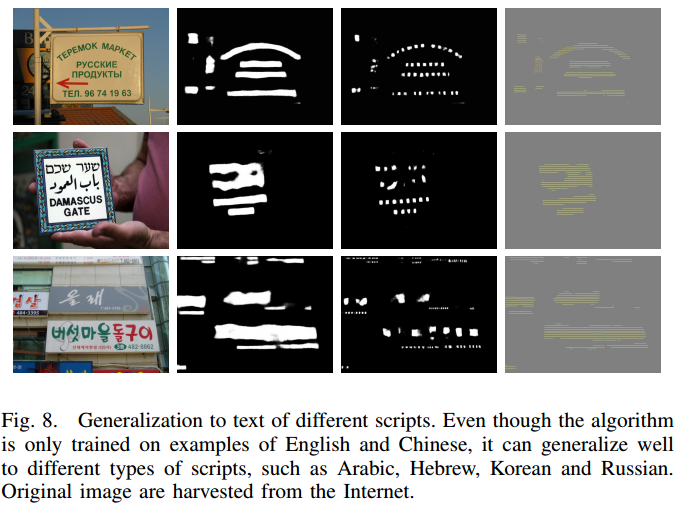
- 多语言
-
- 曲线文字
-
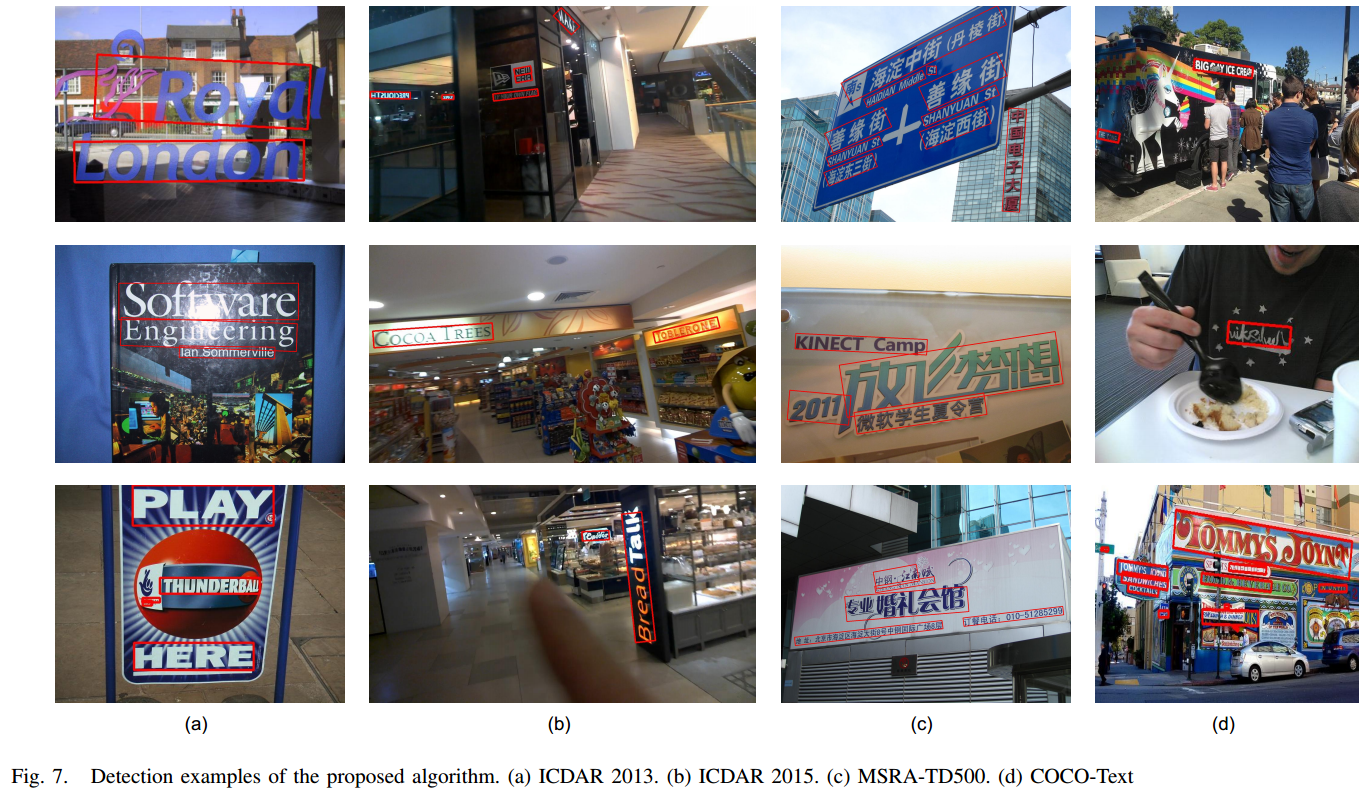
- 结果示例图
-
问题讨论
- 本文方法的局限性
- 对于模糊严重和高亮的样本,检测失败
- 模型太大(56M),速度太慢(对于640*480的图像,cpu模式要14s)
- 在图割模型求解部分,为什么要加入线性约束?λ1和λ2的比值越大的物理意义是什么?采用T值可以用来检测curved文字的原理是什么?
- λ1和λ2的比值越大,表示每个cluster里的分布越接近直线(类似于椭圆的长短轴比越大,越扁),所以要加入线性约束
- 没有设置T值约束时每一条边都可能被切掉,这样curved文字为了保持近线性的条件可能会被切成多段,而加入T值约束后,同一个弧上的顶点(character)往往比较相似,之间的边不会被切掉,故整个弧上的文字会作为一个整体被检测出来。
- 对于DSN的训练?(同时训练side output层和整个standard层?),在side-output层反向传播的时候只更新旁路的参数?
- side-output层只更新旁路(conv, deconv, sigmod)参数
- 空间相似性的定义中,为什么第一项的权重不是1-β,而是β?
- lingking orientation map的groundTruth中,矩形的水平夹角怎么定义?
- 矩形的长边的直线角度
- 需要补充的内容
- delunay triangulation的细节
- 最大生成树的细节
- 本文方法的局限性
-
总结与收获点
- 现在的检测方法越来越朝着:多方向文字检测,端到端训练,将更多的上下文信息整合到模型中,用dense prediction解决检测问题,这几条方向发展。
- 把多信息整合到一个模型的方法可以参考这篇文章
-
参考文献
- S. Xie and Z. Tu. Holistically-nested edge detection. In Proc. of ICCV, 2015.
- C. Lee, S. Xie, et.al. Deeply-Supervised Nets. In NIPS, 2014.
- S. Pemmaraju and S. Skiena. Computational Discrete Mathematics: Combinatorics and Graph Theory in Mathematica. Cambridge University Press, Cambridge, England, 2003.
- L. Kang, Y. Li, and D. Doermann. Orientation robust text line detection in natural images. In Proc. of CVPR, 2014.
- S. Pemmaraju and S. Skiena. Computational Discrete Mathematics: Combinatorics and Graph Theory in Mathematica. Cambridge University Press, Cambridge, England, 2003.


