Confusion Matrix of sklearn
Confusion Matrix
https://machinelearningmastery.com/confusion-matrix-machine-learning/
混淆矩阵是一种总结分类算法性能的技术。
如果单独看正确率,很有可能掩盖了一些小数据量的类的情况。换句话说分类的数据是不均衡的,相对于每类,有的类数据多,有的类数据少。
同时通过这个工具,你还可以明显地看出, 那些分类结果是好的,那些错误容易犯。
A confusion matrix is a technique for summarizing the performance of a classification algorithm.
Classification accuracy alone can be misleading if you have an unequal number of observations in each class or if you have more than two classes in your dataset.
Calculating a confusion matrix can give you a better idea of what your classification model is getting right and what types of errors it is making.
confusion_matrix API
https://scikit-learn.org/stable/modules/generated/sklearn.metrics.confusion_matrix.html#sklearn.metrics.confusion_matrix
混淆矩阵每一行, 都应一个类。
每一列对应预测的一个分类。
每一个元素,就是将一个类判断为另外一个类的概率。

>>> from sklearn.metrics import confusion_matrix
>>> y_true = [2, 0, 2, 2, 0, 1]
>>> y_pred = [0, 0, 2, 2, 0, 2]
>>> confusion_matrix(y_true, y_pred)
array([[2, 0, 0],
       [0, 0, 1],
       [1, 0, 2]])
plot_confusion_matrix API
https://scikit-learn.org/stable/modules/model_evaluation.html#confusion-matrix
混淆矩阵图,更加形象。
使用正规化的选项, 可以让各个类,在百分比上进行横向比较。
计数模式,可以帮助我们看到,那些类是数据量小, 哪些类数据量大。
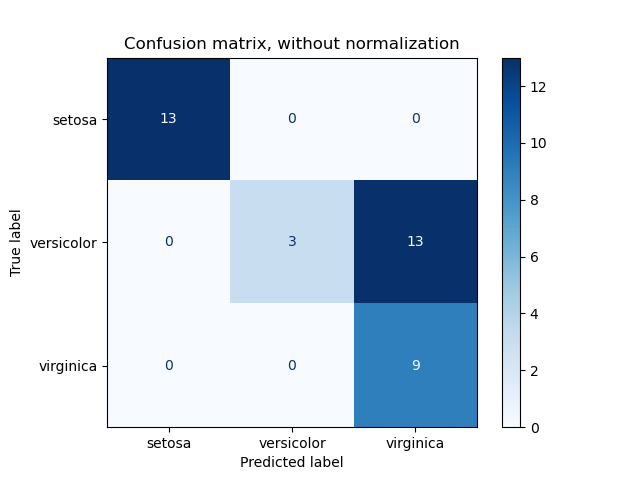
plot_confusion_matrixcan be used to visually represent a confusion matrix as shown in the Confusion matrix example, which creates the following figure:

https://scikit-learn.org/stable/auto_examples/model_selection/plot_confusion_matrix.html
Example of confusion matrix usage to evaluate the quality of the output of a classifier on the iris data set. The diagonal elements represent the number of points for which the predicted label is equal to the true label, while off-diagonal elements are those that are mislabeled by the classifier. The higher the diagonal values of the confusion matrix the better, indicating many correct predictions.
The figures show the confusion matrix with and without normalization by class support size (number of elements in each class). This kind of normalization can be interesting in case of class imbalance to have a more visual interpretation of which class is being misclassified.
Here the results are not as good as they could be as our choice for the regularization parameter C was not the best. In real life applications this parameter is usually chosen using Tuning the hyper-parameters of an estimator.
Out:
Confusion matrix, without normalization
[[13  0  0]
 [ 0 10  6]
 [ 0  0  9]]
Normalized confusion matrix
[[1.   0.   0.  ]
 [0.   0.62 0.38]
 [0.   0.   1.  ]]

print(__doc__)

import numpy as np
import matplotlib.pyplot as plt

from sklearn import svm, datasets
from sklearn.model_selection import train_test_split
from sklearn.metrics import plot_confusion_matrix

# import some data to play with
iris = datasets.load_iris()
X = iris.data
y = iris.target
class_names = iris.target_names

# Split the data into a training set and a test set
X_train, X_test, y_train, y_test = train_test_split(X, y, random_state=0)

# Run classifier, using a model that is too regularized (C too low) to see
# the impact on the results
classifier = svm.SVC(kernel='linear', C=0.01).fit(X_train, y_train)

np.set_printoptions(precision=2)

# Plot non-normalized confusion matrix
titles_options = [("Confusion matrix, without normalization", None),
                  ("Normalized confusion matrix", 'true')]
for title, normalize in titles_options:
    disp = plot_confusion_matrix(classifier, X_test, y_test,
                                 display_labels=class_names,
                                 cmap=plt.cm.Blues,
                                 normalize=normalize)
    disp.ax_.set_title(title)

    print(title)
    print(disp.confusion_matrix)

plt.show()

 浙公网安备 33010602011771号