Elastic Stack - Logstash
Logstash
https://www.elastic.co/cn/logstash
集中、转换和存储数据
Logstash 是免费且开放的服务器端数据处理管道,能够从多个来源采集数据,转换数据,然后将数据发送到您最喜欢的“存储库”中。
Logstash is an open source data collection engine with real-time pipelining capabilities. Logstash can dynamically unify data from disparate sources and normalize the data into destinations of your choice. Cleanse and democratize all your data for diverse advanced downstream analytics and visualization use cases.
Inputsedit
You use inputs to get data into Logstash. Some of the more commonly-used inputs are:
- file: reads from a file on the filesystem, much like the UNIX command
tail -0F- syslog: listens on the well-known port 514 for syslog messages and parses according to the RFC3164 format
- redis: reads from a redis server, using both redis channels and redis lists. Redis is often used as a "broker" in a centralized Logstash installation, which queues Logstash events from remote Logstash "shippers".
- beats: processes events sent by Beats.
For more information about the available inputs, see Input Plugins.
Filtersedit
Filters are intermediary processing devices in the Logstash pipeline. You can combine filters with conditionals to perform an action on an event if it meets certain criteria. Some useful filters include:
- grok: parse and structure arbitrary text. Grok is currently the best way in Logstash to parse unstructured log data into something structured and queryable. With 120 patterns built-in to Logstash, it’s more than likely you’ll find one that meets your needs!
- mutate: perform general transformations on event fields. You can rename, remove, replace, and modify fields in your events.
- drop: drop an event completely, for example, debug events.
- clone: make a copy of an event, possibly adding or removing fields.
- geoip: add information about geographical location of IP addresses (also displays amazing charts in Kibana!)
For more information about the available filters, see Filter Plugins.
Outputsedit
Outputs are the final phase of the Logstash pipeline. An event can pass through multiple outputs, but once all output processing is complete, the event has finished its execution. Some commonly used outputs include:
- elasticsearch: send event data to Elasticsearch. If you’re planning to save your data in an efficient, convenient, and easily queryable format… Elasticsearch is the way to go. Period. Yes, we’re biased :)
- file: write event data to a file on disk.
- graphite: send event data to graphite, a popular open source tool for storing and graphing metrics. http://graphite.readthedocs.io/en/latest/
- statsd: send event data to statsd, a service that "listens for statistics, like counters and timers, sent over UDP and sends aggregates to one or more pluggable backend services". If you’re already using statsd, this could be useful for you!
For more information about the available outputs, see Output Plugins.
Codecsedit
Codecs are basically stream filters that can operate as part of an input or output. Codecs enable you to easily separate the transport of your messages from the serialization process. Popular codecs include
json,msgpack, andplain(text).
- json: encode or decode data in the JSON format.
- multiline: merge multiple-line text events such as java exception and stacktrace messages into a single event.
For more information about the available codecs, see Codec Plugins.
input plugins
https://www.elastic.co/guide/en/logstash/current/input-plugins.html
Input plugins
An input plugin enables a specific source of events to be read by Logstash.
The following input plugins are available below. For a list of Elastic supported plugins, please consult the Support Matrix.
Pulls events from a RabbitMQ exchange
Reads events from a Redis instance
Streams events from files
Receives events from the Elastic Beats framework
File input
https://www.elastic.co/guide/en/logstash/current/plugins-inputs-file.html
Stream events from files, normally by tailing them in a manner similar to
tail -0Fbut optionally reading them from the beginning.Normally, logging will add a newline to the end of each line written. By default, each event is assumed to be one line and a line is taken to be the text before a newline character. If you would like to join multiple log lines into one event, you’ll want to use the multiline codec. The plugin loops between discovering new files and processing each discovered file. Discovered files have a lifecycle, they start off in the "watched" or "ignored" state. Other states in the lifecycle are: "active", "closed" and "unwatched"
File input example
https://www.elastic.co/guide/en/logstash/7.7/config-examples.html
input {
  file {
    path => "/tmp/*_log"
  }
}

filter {
  if [path] =~ "access" {
    mutate { replace => { type => "apache_access" } }
    grok {
      match => { "message" => "%{COMBINEDAPACHELOG}" }
    }
    date {
      match => [ "timestamp" , "dd/MMM/yyyy:HH:mm:ss Z" ]
    }
  } else if [path] =~ "error" {
    mutate { replace => { type => "apache_error" } }
  } else {
    mutate { replace => { type => "random_logs" } }
  }
}

output {
  elasticsearch { hosts => ["localhost:9200"] }
  stdout { codec => rubydebug }
}
logstash 和filebeat 是什么关系?
https://www.zhihu.com/question/54058964
因为logstash是jvm跑的,资源消耗比较大,所以后来作者又用golang写了一个功能较少但是资源消耗也小的轻量级的logstash-forwarder。
不过作者只是一个人,加入http://elastic.co公司以后,因为es公司本身还收购了另一个开源项目packetbeat,而这个项目专门就是用golang的,有整个团队,所以es公司干脆把logstash-forwarder的开发工作也合并到同一个golang团队来搞,于是新的项目就叫filebeat了。
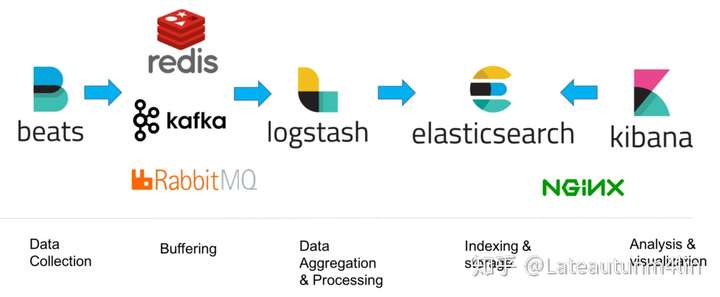
从关系上看filebeat 是替代 Logstash Forwarder 的下一代 Logstash 收集器,为了更快速稳定轻量低耗地进行收集工作,它可以很方便地与 Logstash 还有直接与 Elasticsearch 进行对接,它们之间的逻辑与拓扑可以参看 Beats 基础,具体的使用可以查看下列的架构,这个也是很多大牛推荐的架构。
http://soft.dog/2015/12/24/beats-basic/#section


 浙公网安备 33010602011771号