matlab实现直方图均衡化
matlab函数用法:
J = histeq(I,hgram) 将原始图像I的直方图变成用户指定的向量hgram。hgram中的各元素的值域为[0,1]。
J = histeq(I,n) 指定直方图均衡后的灰度级数n,默认值为64。
[J,T] = histeq(I,...) 返回从能将图像I的灰度直方图变换成图像J的直方图变换T。
用matlab来进行直方图均匀化需要我们了解相关函数的使用,再理解基本的步骤即可。
A = imread(filename) 从 filename指定的文件读取图像,并从文件内容推断出其格式。如果filename为多图像文件,则imread读取该文件中的第一个图像。
I = rgb2gray(RGB) 将真彩色图像 RGB 转换为灰度图像 I。rgb2gray 函数通过消除色调和饱和度信息,同时保留亮度,来将 RGB 图像转换为灰度图。
figure使用默认属性值创建一个新的图窗窗口。。
imhist(___)显示直方图的图。如果输入图像是索引图像,则直方图将在颜色图的颜色条上方显示像素值的分布。
imshow(I)在图窗中显示灰度图像 I。imshow使用图像数据类型的默认显示范围,并优化图窗、坐标区和图像对象属性以便显示图像。
ylim(limits)设置当前坐标区或图的 y 坐标轴范围。将 limits 指定为 [ymin ymax] 形式的二元素向量,其中 ymax 大于 ymin。
J = histeq(I,n) 变换灰度图像 I,以使输出灰度图像J 具有 n 个 bin 的直方图大致平坦。当n 远小于 I 中的离散灰度级数时,J 的直方图更平坦。
代码实现:
了解了matlab中个函数的用法以后,就可以编写.m文件了
test1.m文件
p = imread('p1.jpg');  %读取图像
pg = rgb2gray(p);  %将RGB图像转换为灰度图像。

figure('Name','原图','NumberTitle','off'),imshow(pg);  %显示原图

figure('Name','直方图','NumberTitle','off'),imhist(pg);  %显示直方图
ylim('auto');  %设置直方图的xy坐标的值,用auto自动设置

g = histeq(pg,256);  %直方图均衡化。

figure('Name','均衡化后的图','NumberTitle','off'), imshow(g);  %显示均衡化后的图
figure('Name','均衡化后的直方图','NumberTitle','off'), imhist(g);  %显示均衡化后的直方图

open histeq
这里关键的代码应该histeq函数中。此处我们传入两个参数会执行以下代码,此片段代码是用于判断我们传入的参数是否合理,并初始化有关图像增强和累积直方图的部分变量。
elseif nargin == 2
    if numel(cm) == 1
        %HISTEQ(I,N)
        validateattributes(a,{'uint8','uint16','double','int16','single'}, ...
            {'nonsparse'}, mfilename,'I',1);
        validateattributes(cm, {'single','double'},...
            {'nonsparse','integer','real','positive','scalar'},...
            mfilename,'N',2);
        m = cm;
        hgram = ones(1,m)*(numel(a)/m);
        n = NPTS;
        isIntensityImage = true;

if min(size(hgram)) > 1
   error(message('images:histeq:hgramMustBeAVector'))
end
接着进入到均匀化步骤,首先判断是否是图像增强,这里是,其次调用computeCumulativeHistogram函数来得到均匀化后矩阵,最后调用grayxformmex来进行颜色的匹配,computeCumulativeHistogram函数来得到均匀化后矩阵,最后调用grayxformmex来进行颜色的匹配。
% Intensity image or indexed image
if isIntensityImage
    classChanged = false;
    if isa(a,'int16')
        classChanged = true;
        a = im2uint16(a);
    end

    [nn,cum] = computeCumulativeHistogram(a,n);
    T = createTransformationToIntensityImage(a,hgram,m,n,nn,cum);
    % Mex call is equivalent to:
    % b = uint8((255.0*T(a+1));
    % or uint16, 65535.0 etc
b = grayxformmex(a, T);

if nargout == 0
        if ismatrix(b)
            imshow(b);
            return;
        else
            out = a;
            return;
        end
    elseif classChanged
        out = im2int16(b);
    else
        out = b;
    end
下面是createTransformationToIntensityImage函数的具体实现
function T = createTransformationToIntensityImage(a,hgram,m,n,nn,cum)
% Create transformation to an intensity image by minimizing the error
% between desired and actual cumulative histogram.

% Generate cumulative hgram
cumd = cumsum(hgram); %计算累积直方图

% Calc error
% tol = nn w/ 1st and last element set to 0, then divide by 2 and tile to MxN
tol = ones(m,1)*min([nn(1:n-1),0;0,nn(2:n)])/2;
% Calculate errors btw cumulative histograms
err = (cumd(:)*ones(1,n)-ones(m,1)*cum(:)')+tol; %计算直方图的误差

% Find which combo yielded errors above tolerance
d = find(err < -numel(a)*sqrt(eps));
if ~isempty(d)
    % Set to max err
   err(d) = numel(a)*ones(size(d));   %找出哪个组合超过了允许的误差值
end

% Get min error
% T will be the bin mapping of a to hgram
% T(oldbinval) = newbinval
[dum,T] = min(err); %#ok   %得到最小的误差值
% Normalize T
T = (T-1)/(m-1); %灰度级由1到256变为0到255
结果:
分析:
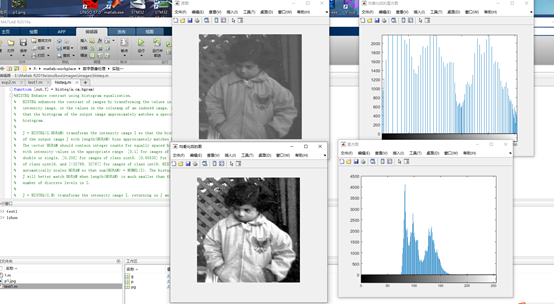
第一幅图是未经进行处理后得出的原图,直接由matlab调用函数读取的图片,第二张图是经过了均匀化处理后的原图,可以看出,未进行处理的原图灰度不分明,图片中的灰度不易分辨,视觉效果差,经过均匀化处理后的图片较为分明,孩子的上衣得到增强,看起来更白了,孩子的背景木栏也变得更有条理,第三张和第四张图分别是处理前后的直方图,如果一幅图像占有全部可能的灰度级,并且均匀分布。该图像具有高对比度和多变的灰色色调。图像细节丰富,质量更高。

 浙公网安备 33010602011771号