逻辑回归:原理及python实现
Table of Contents
逻辑回归概述
逻辑斯蒂回归(Logistics Regression,LR)又叫逻辑回归或对数几率回归(Logit Regression),是一种用于二分类的线性模型。
Sigmoid函数
Sigmoid函数
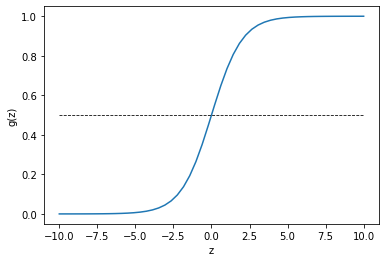
其图像如下,在x=0处函数值为0.5,x趋向于无穷时,函数值分别趋向0和1。
import numpy as np
import matplotlib.pyplot as plt
import warnings
warnings.filterwarnings('ignore')

X = np.linspace(-10,10)
y = []
for i in X:
    y.append(1/(1+np.exp(-i)))
plt.plot(X,y)
plt.plot(X,np.ones(len(X))/2,'--',c='black',linewidth='0.8')
plt.xlabel('z')
plt.ylabel('g(z)')
plt.show()

二项逻辑回归
线性回归用于解决回归问题,其输出\(z=wx^T+b\)是实数,如何将线性回归模型加以改造使其可以用于分类呢?一个朴素的想法就是对线性回归的结果做一个变换
使得
其中
即把线性回归所得的函数值映射到\(\{-1,1\}\)。
逻辑回归首先使用Sigmoid函数将线性回归的值映射到区间\([0,1]\),然后将大于0.5(可调整)的值映射为类别1,小于0.5的值映射为类别-1。\(g(z)\)可以理解为分类为正例的概率,越靠近1,被分类为正例的概率越大,在临界值0.5处最容易被误分类。
对数几率理解
上一节说到,将\(g(z)\)理解为样本被分类为正例的概率。一个事件的几率(odds)是指该事件发生的概率与该事件不发生的概率的比值。则将
称为对数几率(log odds)或logit函数,且将
代入sigmoid函数并变形有
因此,逻辑回归可以看作对对数几率(Logit)进行的线性回归,这也是对数几率回归名字的由来。
逻辑回归的参数优化及正则化
上一节已经描述了逻辑回归的思路,即将线性回归的结果映射为分类变量,在读这一节之前,需要了解一下最大似然估计的思想。
梯度下降法优化参数
最大似然法确定损失函数(对数损失)
对于每个样本点\((x_i,y_i)\),假设\(y_i=1,y_i=0\)的概率分别为
将其合并为
假设每个样本点独立同分布,样本数为n,由最大似然法(MLE)构造似然函数得
由于似然函数表示的是取得现有样本的概率,应当予以最大化,因此,取似然函数的对数的相反数作为损失函数
损失函数的优化
对上一节的损失函数求导可得
对于函数
有
当\(z=x_i^T\theta\)时
故
使用梯度下降法$$\theta = \theta - \alpha X^T(g_{\theta}(X) - y )$$
其中
正则化
Logistic Regression也可以使用正则化,方法同样是在损失函数后增加正则化项。
逻辑回归的实现
sklearn实现
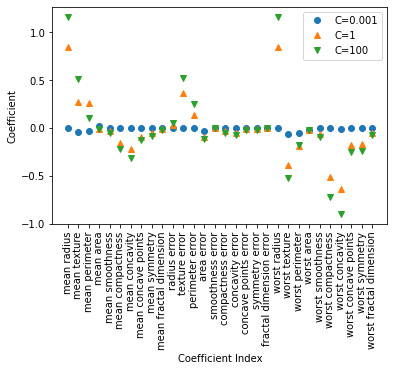
sklearn中LogisticRegression默认使用L2正则化,参数penalty可修改正则化方式。下面是使用sklearn自带的乳腺癌数据集进行逻辑回归训练的代码,下图是不同正则化参数训练所得模型系数,可以看出skleran中正则化项C越小,正则化程度越强,参数的变换范围越小。sklearn中的C应该是上式中的C的相反数。
# 乳腺癌数据上使用Logistic Regression
from sklearn.datasets import load_breast_cancer
from sklearn.linear_model import LogisticRegression
from sklearn.model_selection import train_test_split

cancer = load_breast_cancer()
X_train,X_test,y_train,y_test = train_test_split(cancer.data,cancer.target,stratify = cancer.target,random_state=42)

for C,maker in zip([0.001,1,100],['o','^','v']):
    logistic = LogisticRegression(C = C,penalty='l2',max_iter=100).fit(X_train,y_train)
    print('训练精度(C={}):{}'.format(C,logistic.score(X_train,y_train)))
    print('测试精度(C={}):{}'.format(C,logistic.score(X_test,y_test)))
    plt.plot(logistic.coef_.T,maker,label = 'C={}'.format(C))
plt.xticks(range(cancer.data.shape[1]),cancer.feature_names,rotation = 90)
plt.xlabel('Coefficient Index')
plt.ylabel('Coefficient')
plt.legend()
plt.show()
训练精度(C=0.001):0.9530516431924883
测试精度(C=0.001):0.9440559440559441
训练精度(C=1):0.9460093896713615
测试精度(C=1):0.958041958041958
训练精度(C=100):0.9413145539906104
测试精度(C=100):0.965034965034965

python从零实现
下面是python从零实现的代码。同样的,先定义了一个LogistcReg类,并初始化参数,在fit过程中,未使用pytorch的自动求导而是直接利用上面推导出的公式来进行梯度下降。在类中还定义了,概率、评分、预测等方法用于输出相关数据。
import numpy as np
import random

import pandas as pd
from sklearn.linear_model import LogisticRegression


class LogisticReg:
    def __init__(self, X, y, batch=10, learning_rate=0.01, epoch=3, threshhold_value=0.5,random_seeds=50):
        self.random_seeds = random_seeds
        self.features = np.insert(X,0,values = np.ones(X.shape[0]),axis=1)
        self.labels = y
        self.batch = batch
        self.learning_rate = learning_rate
        self.epoch = epoch
        self.theta = np.random.normal(0, 0.01, size=(self.features.shape[1],1))
        self.threshhold_value = threshhold_value

        random.seed(self.random_seeds)

    def sigmoid(self, features):
        return 1/(1+np.exp(-np.dot(features, self.theta)))

    def data_iter(self):
        range_list = np.arange(self.features.shape[0])
        random.shuffle(range_list)
        for i in range(0, len(range_list),self.batch):
            batch_indices = range_list[i:min(i+self.batch, len(range_list))]
            yield self.features[batch_indices], self.labels[batch_indices].reshape(-1,1)

    def fit(self):
        for i in range(self.epoch):
            for batch_features, batch_labels in self.data_iter():
                self.theta -= self.learning_rate * np.dot(np.mat(batch_features).T,
                                                       self.sigmoid(batch_features) - batch_labels)

    def pred_prob(self, pre_X):
        pre_X = np.insert(pre_X,0,np.ones(pre_X.shape[0]),axis=1)
        return self.sigmoid(pre_X)

    def predict(self, pre_X):
        return self.pred_prob(pre_X) >= self.threshhold_value

    def score(self, pre_y, true_y):
        return sum(pre_y.flatten() == true_y.flatten())/len(pre_y)

    def param(self):
        return self.theta.flatten()


def main():
    # 导入数据
    data = pd.read_excel('../bankloan.xls')
    display(data.head(3))
    X = data.iloc[:, :-1].values
    y = data.iloc[:, -1].values

    logit = LogisticReg(X, y)
    logit.fit()
    y_pre = logit.predict(X)
    print(f'前五行正例概率:\n{logit.pred_prob(X)[:5]}')
    print(f'准确率:{logit.score(y_pre,y)}')
    print(f'参数向量:{logit.param()}')

    skl_LogReg = LogisticRegression(max_iter=1000).fit(X, y)
    print(f'sklearn准确率:{skl_LogReg.score(X, y)}')


if __name__ == '__main__':
    main()
| 年龄 | 教育 | 工龄 | 地址 | 收入 | 负债率 | 信用卡负债 | 其他负债 | 违约 | |
|---|---|---|---|---|---|---|---|---|---|
| 0 | 41 | 3 | 17 | 12 | 176 | 9.3 | 11.359392 | 5.008608 | 1 |
| 1 | 27 | 1 | 10 | 6 | 31 | 17.3 | 1.362202 | 4.000798 | 0 |
| 2 | 40 | 1 | 15 | 14 | 55 | 5.5 | 0.856075 | 2.168925 | 0 |
前五行正例概率:
[[2.71836750e-19]
 [2.88481260e-09]
 [3.29344356e-61]
 [7.11139973e-53]
 [1.00000000e+00]]
准确率:0.8042857142857143
参数向量:[-0.08272148 -1.48932592  0.15983636 -6.65078674 -2.42456947  0.43262372
  4.64195568  3.20970401  0.85901102]
sklearn准确率:0.8085714285714286


