arcgis 4.x Point3dSymbol 随着line变化的名称方式
https://developers.arcgis.com/javascript/latest/sample-code/visualization-point-styles/index.html 官方案例地址
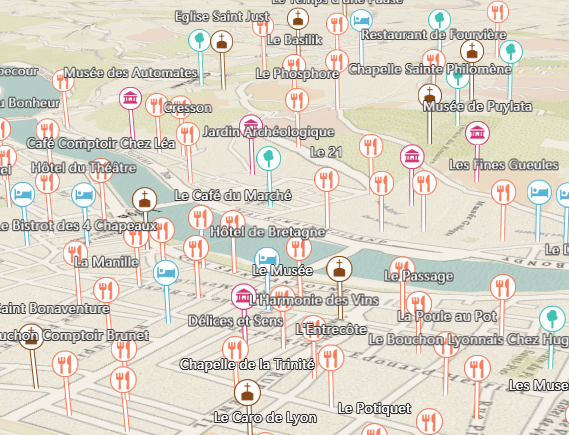
1.效果截图
2.symbol的创建格式
{
    type: "point-3d", //json格式类型标注
    symbolLayers: [{
        type: "icon", //
        resource: {
            href: name //图标加載路徑
        },
        size: 20, 图标大小
        outline: {
            color: "white", // 图标外圆颜色
            size: 2         // 边框宽度
        }
    }],

    verticalOffset: {
        screenLength: 40,
        maxWorldLength: 200,   //最大显示高度
        minWorldLength: 35     //最小显示高度
    },

    callout: {
        type: "line",    // 联系线的类型
        color: "white",  // 颜色
        size: 2,         // 宽度
        border: {
            color: color // 边线颜色
        }
    }
};
3. 不知道如何创建随动态line变化的name
一开始用的GraphicLayer 来加载 发现并不能实现名称自动的问题 然后决定使用renderer渲染器来解决这个问题
4. FeatureLayer 的使用方法
使用渲染器的话 就不得不提到这个图层了。一开始我对FeatureLayer的认识还停留在对已经编辑好的服务进行渲染显示的层度 后来认真看了一下api发现 它支持
source属性(一个graphics容器数组) 支持add添加 这样就好办多了 于是 代码如下
var graphics = [{
	geometry: {
		type: "point",
		x: 12352848.781849042,
		y: 2482358.72638897,
		spatialReference: {
			wkid: 102100
		}
	},
	attributes: {
		name: "测试名称",
		type: "name",
		aons: "测试名称"
	}
}]


function getUniqueValueSymbol(name, color) {
	// The point symbol is visualized with an icon symbol. To clearly see the location of the point
	// we displace the icon vertically and add a callout line. The line connects the offseted symbol with the location
	// of the point feature.
	return {
		type: "point-3d", // autocasts as new PointSymbol3D()
		symbolLayers: [{
			type: "icon", // autocasts as new IconSymbol3DLayer()
			resource: {
				href: name
			},
			size: 20,
			outline: {
				color: "white",
				size: 2
			}
		}],

		verticalOffset: {
			screenLength: 40,
			maxWorldLength: 200,
			minWorldLength: 35
		},

		callout: {
			type: "line", // autocasts as new LineCallout3D()
			color: "white",
			size: 2,
			border: {
				color: color
			}
		}
	};
}


var pointsRenderer = {
	type: "unique-value", // autocasts as new UniqueValueRenderer()
	field: "type",
	uniqueValueInfos: [{
			value: "name",
			symbol: getUniqueValueSymbol(
				"https://developers.arcgis.com/javascript/latest/sample-code/visualization-point-styles/live/Museum.png",
				"#ffffff"
			)
		},
		{
			value: "Museum",
			symbol: getUniqueValueSymbol(
				"https://developers.arcgis.com/javascript/latest/sample-code/visualization-point-styles/live/Museum.png",
				"#D13470"
			)
		},
		{
			value: "Restaurant",
			symbol: getUniqueValueSymbol(
				"https://developers.arcgis.com/javascript/latest/sample-code/visualization-point-styles/live/Restaurant.png",
				"#F97C5A"
			)
		},
		{
			value: "Church",
			symbol: getUniqueValueSymbol(
				"https://developers.arcgis.com/javascript/latest/sample-code/visualization-point-styles/live/Church.png",
				"#884614"
			)
		},
		{
			value: "Hotel",
			symbol: getUniqueValueSymbol(
				"https://developers.arcgis.com/javascript/latest/sample-code/visualization-point-styles/live/Hotel.png",
				"#56B2D6"
			)
		},
		{
			value: "Park",
			symbol: getUniqueValueSymbol(
				"https://developers.arcgis.com/javascript/latest/sample-code/visualization-point-styles/live/Park.png",
				"#40C2B4"
			)
		}
	]
};

var Fealayer = new FeatureLayer({
	source: graphics,
	fields: [{
		name: "name",
		alias: "name",
		type: "string"
	}, {
		name: "type",
		alias: "type",
		type: "string"
	}, {
		name: "aons",
		alias: "aons",
		type: "string"
	}],
	objectIdField: "name",
	geometryType: "point",
	renderer: pointsRenderer,
	labelingInfo: [{
		labelExpressionInfo: {
			expression: "$feature.aons"
		},
		symbol: {
			type: "label-3d",
			symbolLayers: [{
				type: "text",
				material: {
					color: "white"
				},
				halo: {
					size: 1,
					color: [50, 50, 50]
				},
				size: 10
			}]
		}
	}]
});
5.结论
使用featureLayer + LabelClass的组合可以高效便捷的创建点分布已经名称跟随 非常方便且实用的一种渲染形式

 浙公网安备 33010602011771号