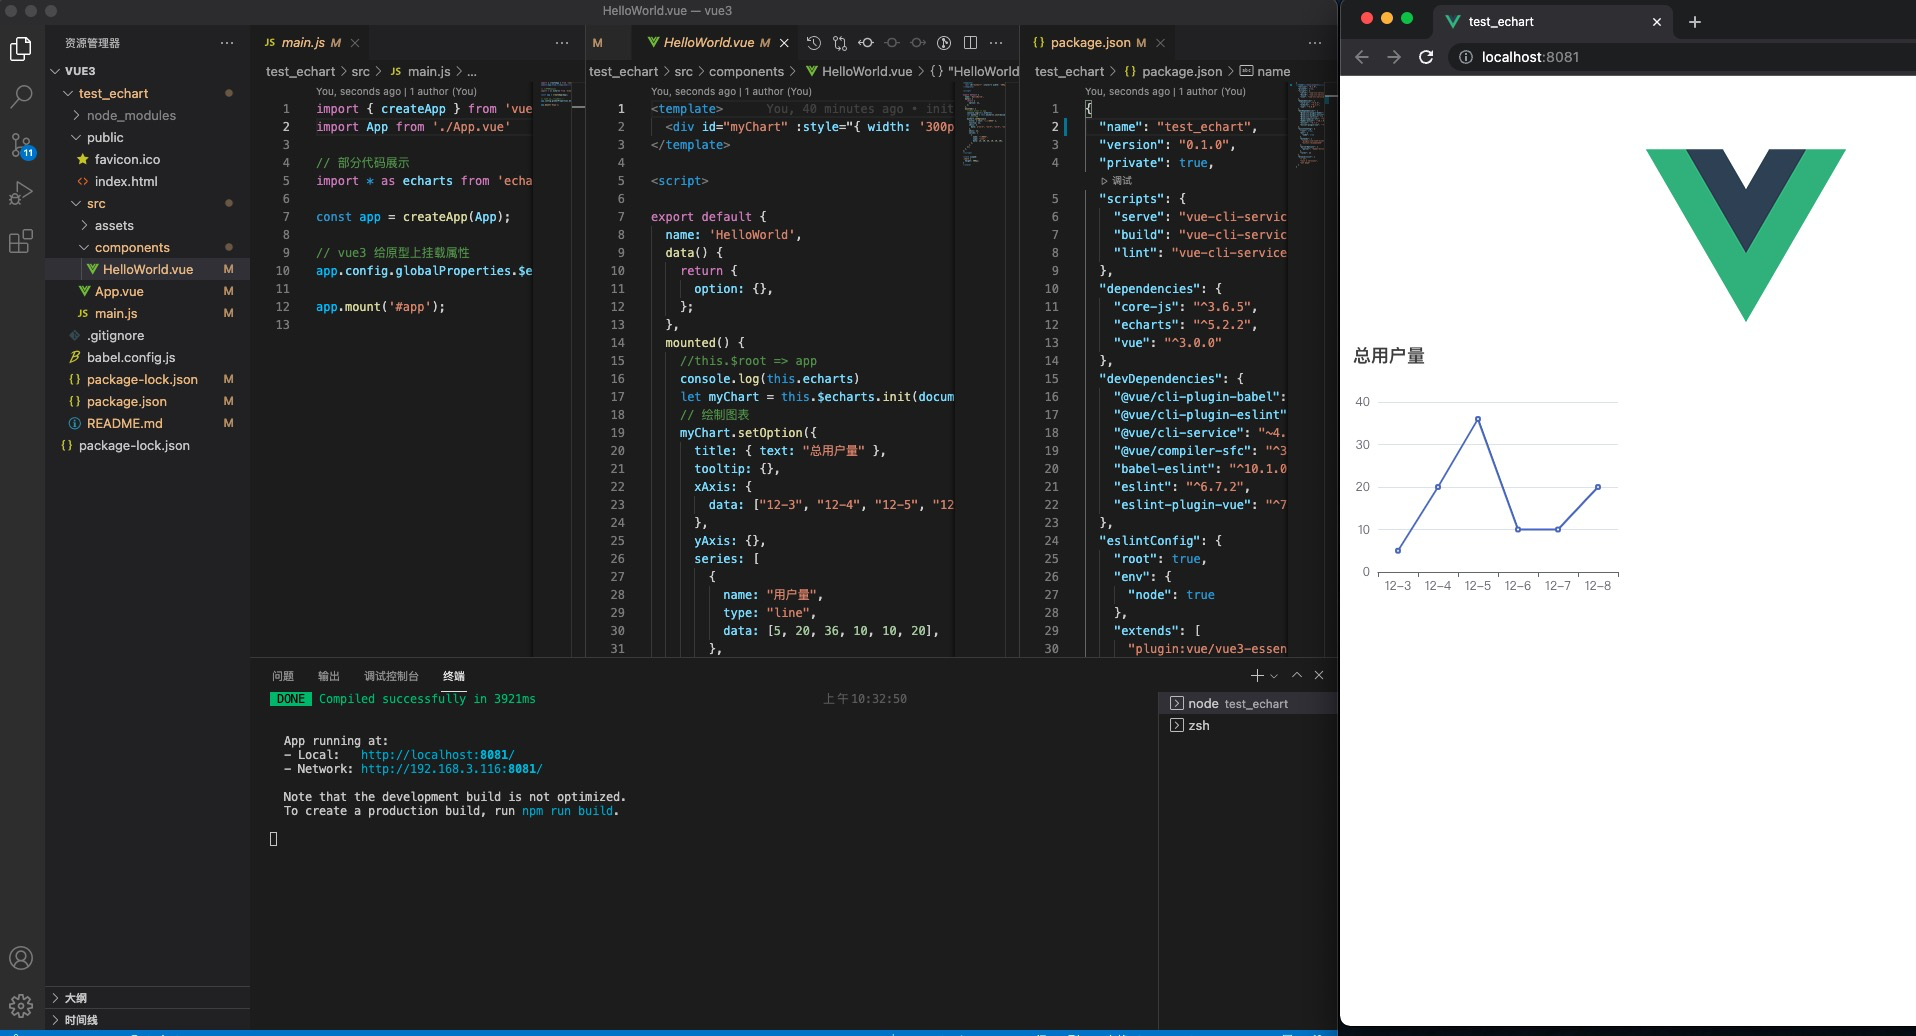
在vue3 中使用echarts
1、安装 echarts
npm install echarts --save
2、main.js 中引入
// 部分代码展示
import * as echarts from 'echarts'

const app = createApp(App);

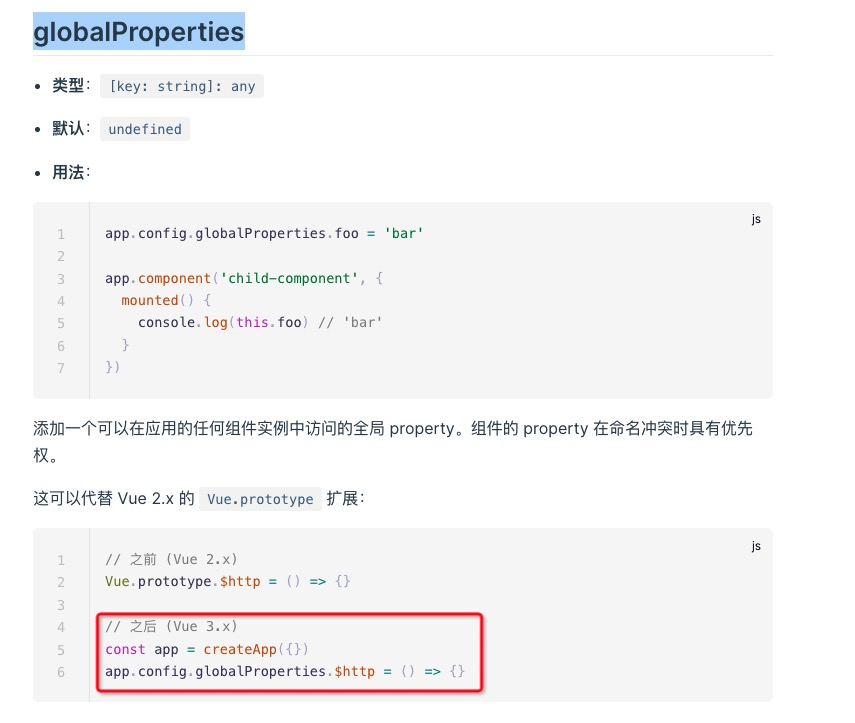
// vue3 给原型上挂载属性
app.config.globalProperties.$echarts = echarts;


app.use(store).use(router).use(ElementPlus).mount('#app');
3、组件中使用
<template>
  <div id="myChart" :style="{ width: '300px', height: '300px' }"></div>
</template>

<script>

export default {
  data() {
    return {
      option: {},
    };
  },
  mounted() {
    //this.$root => app
    console.log(this.echarts)
    let myChart = this.$echarts.init(document.getElementById("myChart"));
    // 绘制图表
    myChart.setOption({
      title: { text: "总用户量" },
      tooltip: {},
      xAxis: {
        data: ["12-3", "12-4", "12-5", "12-6", "12-7", "12-8"],
      },
      yAxis: {},
      series: [
        {
          name: "用户量",
          type: "line",
          data: [5, 20, 36, 10, 10, 20],
        },
      ],
    });
  },
};
</script>

<style scoped>
.chart {
  height: 400px;
}
</style>

globalPropertie


