import React, {Component} from 'react';
import {
    AppRegistry,
    StyleSheet,
    Text,
    Button,
    View,
    TouchableOpacity,
    Dimensions,
} from 'react-native';
import Echarts from 'native-echarts';
let {width,height} =Dimensions.get('window')
export default class EchartsTest extends Component {

    constructor(props) {
        super(props);

        this.state ={
            numDataY:["2", "53", "24", "6", "100", "20",'30'],
            othernumDataY:["10", "40", "20", "80", "120", "25",'5'],
        }
    }
    render() {
        const option= {
            //图形位置样式
                grid:{
                    right:15,
                    bottom:30,
                },
                title: {
                    text: '访客数量',
                        textStyle:{
                        color:'#8e8e93',
                        fontSize:14,
                        padding:[10,0,0,10],
                    },
                    top:0,
                    left:5,
                },
                //点击图形某个位置的显示弹框
                tooltip: {
                    trigger:'axis',
                },
                //统计数据的种类切换
                legend: {
                    orient:'vertical',
                    data: [{name:'访客数量',icon: 'circle',},{name:'付款金额',icon: 'circle'}],
                    selectedMode:'multiple',
                    backgroundColor:'#fff',
                    align:'left',
                    right:20,//距离右边界20
                    top:5,
                },
                toolbox:{
                        orient:'vertical',
                        show:true,
                        showTitle:true,
                        feature:{
                        magicType:{
                            type: 'bar',
                        },
                    },
                },
                xAxis: [
                    {
                        axisTick:{
                            show:true,
                            alignWithLabel:true,
                        },
                        data: ["周一", "周二", "周三", "周四", "周五", "周六","周日"],
                    }
                ],
                yAxis: [
                    {
                        axisTick:{
                            show:false,
                            alignWithLabel:false,
                        },
                        nameLocation:'end',
                        nameTextStyle:{
                            color:'#8e8e93',
                            fontSize:12,
                            align:'right',
                            padding:[0,0,0,10],
                            left:10,
                        },
                        interval:0,//强制分割间隔
                        nameGap:15,
                        name:'访客数量(个)',
                        offset:-5,
                    }
                ],
                color:['#e62129','#007aff'],
                //数据配置
                series: [
                    {
                    name: '访客数量',
                    type: 'bar',
                    data:this.state.numDataY ,
                    },
                    {
                        name: '付款金额',
                        type: 'line',
                        data:this.state.othernumDataY ,
                    }
                ]
            }
        return (
            <View style={styles.container}>
                <Echarts option={option}
                         height={200}
                />
            </View>
        );
    }
}
const styles = StyleSheet.create({
    container: {
        flex: 1,
        backgroundColor: '#f9f9f9',
    },
    echartstyle: {
        height: 50,
        width: 100,
    },
    button: {
        backgroundColor: '#d9534f',
        padding: 8,
        borderRadius: 4,
        marginBottom: 20
    }
});
首先这个组件在模拟器上和debug模式下是没有任何问题但是但是在安卓打包apk运行时,显示出问题一片空白,看源码
 <View style={{flex: 1, height: this.props.height || 400,}}>
        <WebView
          ref="chart"
          scrollEnabled = {false}
          injectedJavaScript = {renderChart(this.props)}
          style={{
            height: this.props.height || 400,
          }}
          source={require('./tpl.html')}
        />
      </View>
Echarts用的webView然后引入一个文件,而这个文件的路径对于ios来说是没有问题的,但是在安卓来说这个路径就是错误的,那就在安卓里没有这个文件,所以copy一个tpl文件,复制到如下路径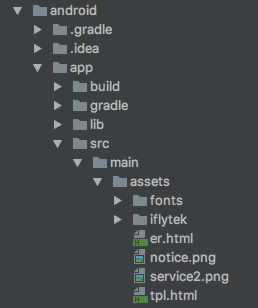
然后在修改一下webView的source
 const source = (Platform.OS == 'ios') ? require('./tpl.html') : {'uri':'file:///android_asset/tpl.html'}
    return (
      <View style={{flex: 1, height: this.props.height || 400,}}>
        <WebView
          ref="chart"
          scrollEnabled = {false}
          injectedJavaScript = {renderChart(this.props)}
          style={{
            height: this.props.height || 400,
          }}
          source={source}
        />
      </View>
重新编译一下原始代码重新运行就ok,(太特么坑爹了),
补充一点,之后碰到上面改过之后还是显示不了,还是空白,后来在option把function()或()=>{}及属性:函数,就显示不了。坑死了


 浙公网安备 33010602011771号