
ECharts使用总结归纳
UserNAME:你为什么写这篇文章?
My:最近项目中有统计报表的需求,使用了ECharts,“度娘”过程中东查西找太麻烦,自己写一篇加深印象,方便以后查阅。
辅助文档------>https://echarts.baidu.com/option.html (里面有各种教程、配置项)
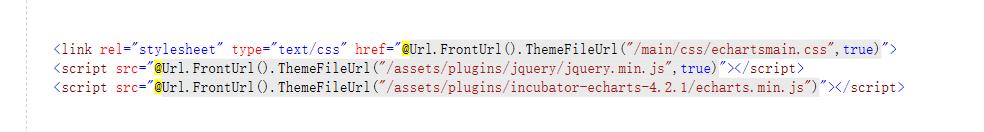
1.引用文件 https://www.echartsjs.com/download.html(我自己用的v4.2.1,我用到柱形、饼图、折线图,所有只用了 echartsmain.css、echarts.min.js、jquery.min.js这三个文件,看个人需求)
2. 为 ECharts 准备一个具备大小(宽高)的 DOM 并实现js代码
注意:由于var myChart1 = echarts.init(document.getElementById('main1'));里的echarts.init()是JS的方法,所以不能使用jQuery的元素选择器
通过ajax调用获取数据
      <div id="main1" class="echars"></div>
                <div id="main2" class="echars"></div>
                <div id="main3" class="echars"></div>
 <script type="text/javascript">
   var myChart1 = echarts.init(document.getElementById('main1'));
            var myChart2 = echarts.init(document.getElementById('main2'));
            var myChart3= echarts.init(document.getElementById('main3));
$.ajax({
type: 'POST',
url: "@Request.RawUrl",
dataType: 'json',
data: { TIME2: TIME2 }
}).done(function (response) {
type: 'POST',
url: "@Request.RawUrl",
dataType: 'json',
data: { TIME2: TIME2 }
}).done(function (response) {
var types = new Array;
var values = new Array;
for (var i = 0; response.Success == true && i < response.Model[0].TYPELIST.length; i++) {
types.push(response.Model[0].TYPELIST[i].NAME);
values.push(response.Model[0].TYPELIST[i].NAMECOUNT);
}
var labelOption = {
normal: {
fontSize: 34,
}
};
var values = new Array;
for (var i = 0; response.Success == true && i < response.Model[0].TYPELIST.length; i++) {
types.push(response.Model[0].TYPELIST[i].NAME);
values.push(response.Model[0].TYPELIST[i].NAMECOUNT);
}
var labelOption = {
normal: {
fontSize: 34,
}
};
/*柱形图*/
var option = {
color: ["rgb(30,144,255)"],
title:{
textStyle: {
fontSize:5,
}
},
var option = {
color: ["rgb(30,144,255)"],
title:{
textStyle: {
fontSize:5,
}
},
tooltip: {
trigger: 'axis',
axisPointer: {
type: 'shadow'
},
textStyle: {
fontSize: 34,
}
},
grid: {
top: '10%',
},
xAxis: {
data: types,
axisLabel:{
fontSize: 34
}
},
yAxis: {
type: 'value',
axisLabel: {
fontSize: 34
}
},
series: [{
name: '上报数量',
type: 'bar',
data: values,
label: labelOption,
}]
};
/*饼图*/
var option2 = {
color: ["rgb(0,206,209)", "rgb(30,144,255)"],
tooltip: {
trigger: 'item',
formatter: "{b} {c}: {d}%",
textStyle: {
fontSize: 32
}
},
legend: {
type: 'scroll',
orient: 'vertical',
bottom:'15%',
data: ['未完成', '完成'],
textStyle: {
fontSize: 34
}
},
series: [
{
name: ' ',
type: 'pie',
radius: '50%',
center: ['50%', '30%'],
data: [
{
value: response.Model[0]["UNZONCOUNT"],
name: '未完成',
},
{
value: response.Model[0]["OKZONCOUNT"],
name: '完成',
{
value: response.Model[0]["OKZONCOUNT"],
name: '完成',
},
],
label: {
normal: {
show: true,
position:'outside',
textStyle: {
fontSize:34
}
},
emphasis: {
show: true
}
},
lableLine: {
normal: {
show: true,
},
emphasis: {
show: true
}
}
}
]
};
],
label: {
normal: {
show: true,
position:'outside',
textStyle: {
fontSize:34
}
},
emphasis: {
show: true
}
},
lableLine: {
normal: {
show: true,
},
emphasis: {
show: true
}
}
}
]
};
补充:折现图(获取数据方法大同小异)
 $.ajax({
            type: 'POST',
                url: "@Request.RawUrl",
                dataType: 'json',
                data: {TIME2: TIME2 }
            }).done(function (response) {

                var types = new Array;
                var values = new Array;
                types.push(Object.keys(response.Model[0]["result"]));
                values.push(Object.values(response.Model[0]["result"]));

                var labelOption = {
                    normal: {
                        fontSize: 34,
                    }
                };

               types[0].splice(0,8);
               values[0].splice(0,8);

            /*折线图*/
            var option3= {

                title: {
                    textStyle: {
                        fontSize: 34,
                    }
                },

                tooltip: {
                    trigger: 'axis',
                    textStyle: {
                        fontSize: 34,
                    }
                },
                legend: { data: types[0] },
                grid: {
                    containLabel: true,

                },
                xAxis: {
                    type: 'category',
                    boundaryGap: false,
                    data: types[0],
                    axisLabel: {
                        fontSize: 24,
                        rotate:60
                    }
                },
                yAxis: {
                    type: 'value',
                    axisLabel: {
                        fontSize: 34
                    },
                    scale: true,
                },
                series: [{
                    name: '上报数量',
                    type: 'line',
                    data: values[0],
                    label: labelOption,
                    itemStyle: {
                        normal: {
                            color: '#436EEE',
                            lineStyle: {
                                color:'#436EEE'
                            }
                        }
                    }
                }]
            };
具体配置参数可参考 https://echarts.baidu.com/option.html#title
以下是最重要的!!!!!柱形和饼图配置好后 画在div上
myChart1.setOption(option);
                myChart2.setOption(option2);
                myChart3.setOption(option3);
