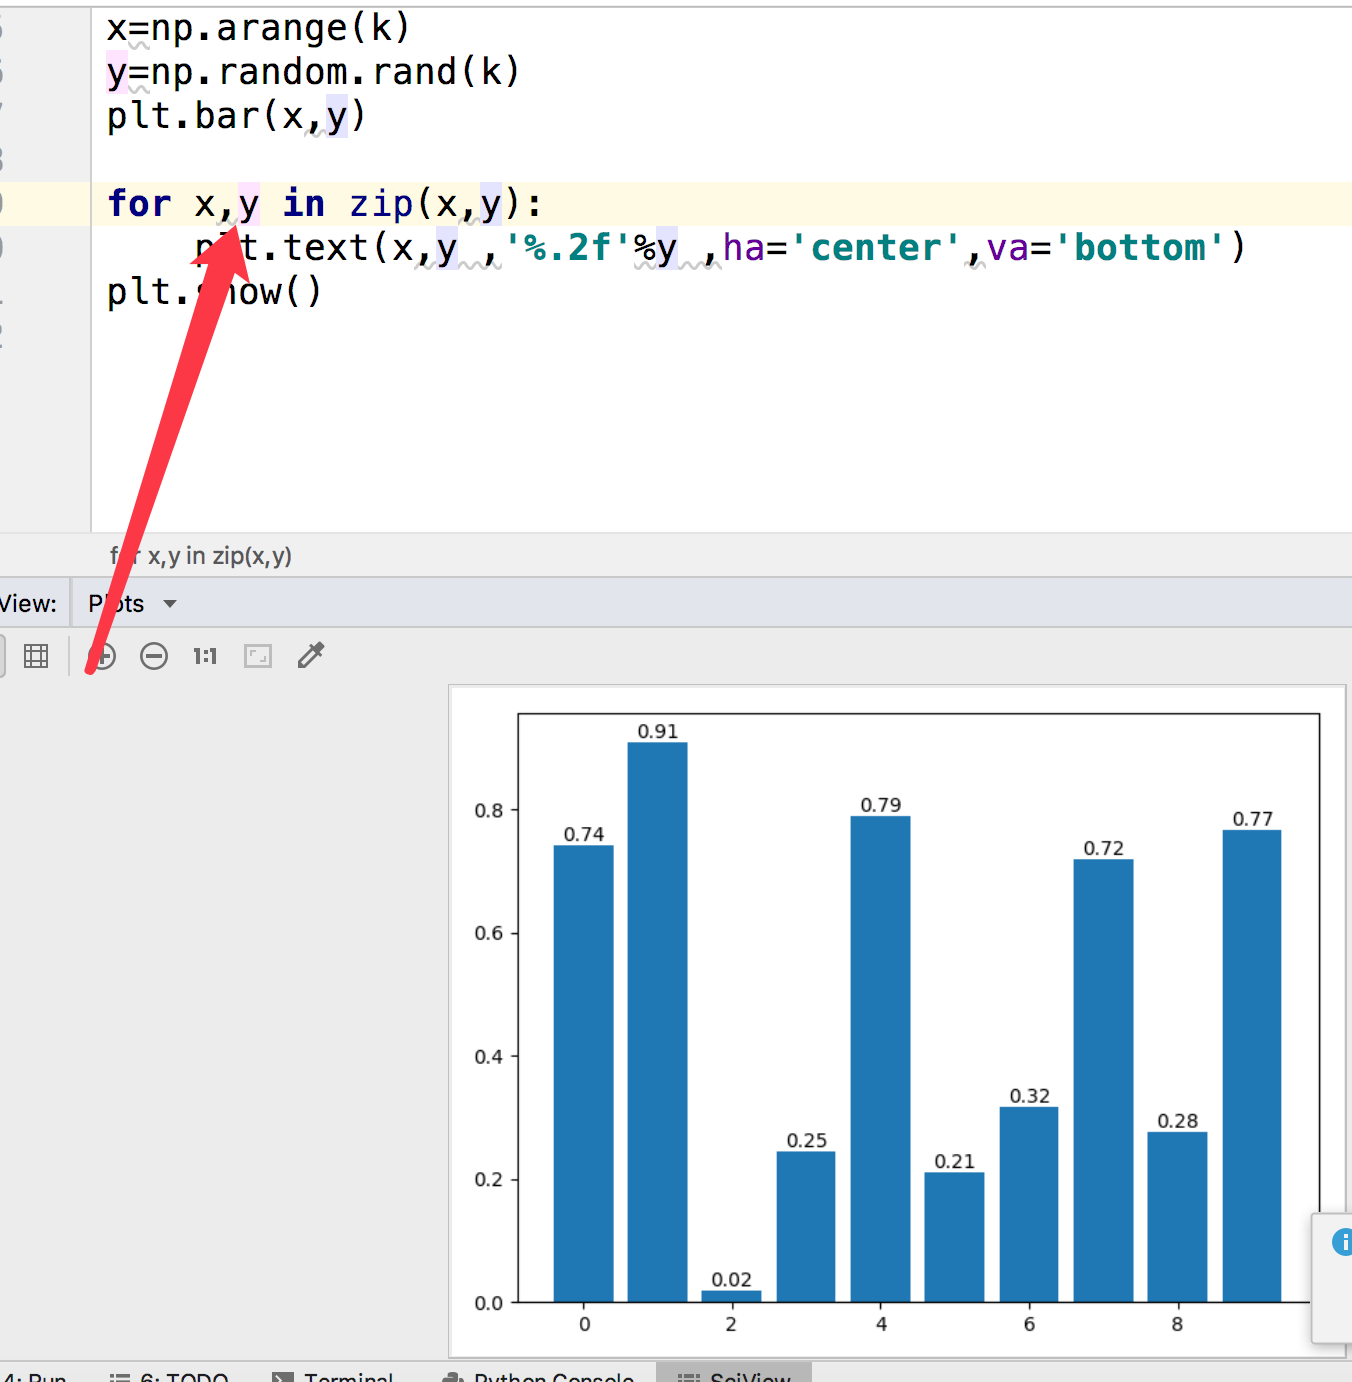
TypeError: only size-1 arrays can be converted to Python scalars
Traceback (most recent call last):
File "/Users/mac126/数据分析/mayplotlib/mayplotlib.py", line 50, in <module>
plt.text(x,y ,'%.2f'%y ,ha='center',va='bottom')
TypeError: only size-1 arrays can be converted to Python scalars
源码
import matplotlib.pyplot as plt
import numpy as np
k=10
x=np.arange(k)
y=np.random.rand(k)
plt.bar(x,y)

for x in zip(x,y):
    plt.text(x,y ,'%.2f'%y ,ha='center',va='bottom')
plt.show()
发现是少了一个参数y加上就好了


