
graphviz 程序生成多种类型图表详解
简介
一幅图抵得上千言万语,这在描述复杂的计算机系统时尤为正确。当系统环境变得更加复杂时,用图将它们表示出来并记入文档就显得更加重要。例如,虚拟化技术有很多优点,但它们通常会让环境变得更加复杂和更难理解。Graphviz 是一个可以创建图表的灵活应用程序,可以轻松实现脚本化。本文将介绍 Graphviz 的安装、使用,以及其中使用 DOT 语言的基础知识,并提供了一些示例脚本。本文有助于您了解 Graphviz 应用程序的基础知识,以及如何编写自动创建图表的脚本。
还有另外一个我觉得更加牛逼的作用,在使用 markdown 时无法直接将图片直接粘贴上去,还得想办法将图片传到某一个中间服务再引入,有么有?而 graphviz 可以完美的解决这个问题,在 markdown 中也可以直接编写相应的代码生成相应的图表,使用起来相当 easy,越用越 happy。
针对 graphviz 想要了解更加详细内容,请查看其对对应的 官方网址
安装 graphviz
Graphviz 是一个开源工具,可以运行在类似于 UNIX® 的大多数平台和 Microsoft® Windows® 之上。graphviz 支持 Windows、Mac OS X、FreeBSD、Solaris、Linux 等多种系统
- Ubuntu 或 Debian 下安装:
sudo apt-get install graphviz
或
sudo yum install graphviz
- Mac 下安装使用 brew 命令:
我本人 mac 上安装的时候并没有装 ruby,故需要先安装 ruby 再进行安装 graphviz
ruby -e "$(curl -fsSL https://raw.githubusercontent.com/Homebrew/install/master/install)" < /dev/null 2> /dev/null ; brew install caskroom/cask/brew-cask 2> /dev/null
brew install graphviz
- Windows 下安装:
由于本人一直使用的是 mac 和 linux,故此次试验并没有在 windows 上做验证,请查看官方文档进行安装。
DOT 语言基础
安装 Graphviz 之后,就可以开始使用工具创建图表,第一步是创建一个 DOT 文件。该 DOT 文件是一个文本文件,描述了图表的组成元素以及它们之间的关系,以便该工具可以生成这些组成元素和它们之间的关系的图形化表示。
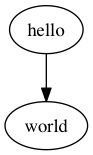
1. 编写以 dot 为后缀的源代码文件 hello.dot,内容如下:
  digraph {
     hello -> world;
  }
2. 使用 dot 命令编译
dot hello.dot -T png -o hello.png
完整的命令格式为:
<cmd> <inputfile> -T <format> -o <outputfile>
其中graphviz 的 <cmd> 有好几种,每种使用方法都完全相同,差别只在于渲染出来的图片效果不一样。 man 中的简介是这样的
| <cmd> | 介绍 |
|---|---|
| dot | 渲染的图具有明确方向性。 |
| neato | 渲染的图缺乏方向性。 |
| twopi | 渲染的图采用放射性布局。 |
| circo | 渲染的图采用环型布局。 |
| fdp | 渲染的图缺乏方向性。 |
| sfdp | 渲染大型的图,图片缺乏方向性。 |
可以透过 man <cmd> 取得进一步说明。但还是亲自用用比较容易理解。在本文中,凡没有说明的图,预设都是以 dot 渲染出来的。
3. 查看效果
运行 2 中的命令后会生成对应的 png 文件,双击打开查看效果如下所示:
基础应用
1. 编写一个案例 dot 文件为:example1.dot
graph example1 {
    Server1 -- Server2
    Server2 -- Server3
    Server3 -- Server1
}
上述内容中共有三个节点(Server1、Server2 和 Server3)。-- 定义了节点之间的联系。这个使用 DOT 语言的例子说明,Server2、 Server2 连接到 Server3,而 Server3 连接到 Server1。
创建 DOT 文件后,可以运行 dot 命令来生成图表,如 2 中所示。–T png 将输出格式指定为 PNG,而 –o example1.png 指定必须将输出保存到一个名叫 example1.png 的文件中。
2. 从 DOT 文件生成图像
$ dot example1.dot –T png –o example1.png
生成的图表如下:
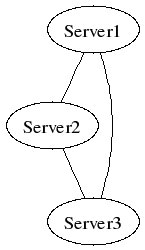
第一个示例 (example1.dot) 描述了一个无向图,即用不带箭头的直线表示节点之间的联系的图。
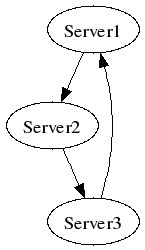
有向图不仅能表示节点之间的联系,而且能用箭头表示节点之间流动的方向。要创建有向图,可以在 DOT 文件的第一行上指定 digraph 而非 graph,并在节点之间使用 ->,而不是 --。
3. 生成有向图,创建 dot 文件:example2.dot
digraph example2 {
    Server1 -> Server2
    Server2 -> Server3
    Server3 -> Server1
}
使用 dot 命令生成对应的图表如下:
你也可以轻松控制图中每个节点的形状、颜色和标签。具体方法是列出每个节点的名称,然后将选项放在名称后面的括号中。例如,代码行
Server1[shape=box, label="Server1\nWebServer", fillcolor="#ABACBA", style=filled]
定义了 Server1 节点应该是一个长方形,有一个 Server1\nWeb Server 标签(\n 表示一个新行),颜色设为十六进制 (hex) 颜色 #ABACBA,而且该颜色应该填充了节点。
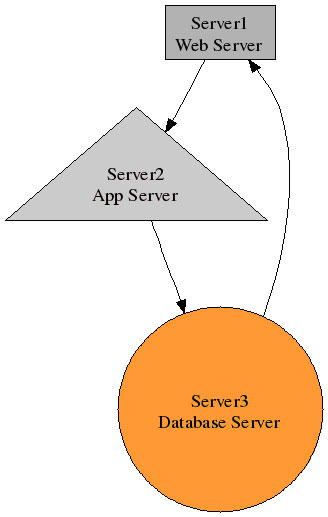
4. 生成有颜色和形状的图表
创建 dot 文件:example3.dot
digraph example3 {
    Server1 -> Server2
    Server2 -> Server3
    Server3 -> Server1

    Server1 [shape=box, label="Server1\nWeb Server", fillcolor="#ABACBA", style=filled]
    Server2 [shape=triangle, label="Server2\nApp Server", fillcolor="#DDBCBC", style=filled]
    Server3 [shape=circle, label="Server3\nDatabase Server", fillcolor="#FFAA22", style=filled]
}
对应的生成相应图表如下:
编写脚本创建 Graphviz 图表
在了解了 Graphviz DOT 语言的基础知识之后,您可以开始创建脚本,从而动态创建一个 DOT 文件。这允许您动态创建始终准确且保持最新的图表。
以下示例是一个 bash shell 脚本(hmc_to_dot.sh),它连接到 Hardware Management Console (HMC),收集托管服务器和逻辑分区 (LPAR) 的相关信息,然后使用这些信息来创建 DOT 输出。
#!/bin/bash

HMC="$1"
serverlist=`ssh -q -o "BatchMode yes" $HMC lssyscfg -r sys -F "name" | sort`

echo "graph hmc_graph{"
for server in $serverlist; do
    echo " \"$HMC\" -- \"$server\" "
    lparlist=`ssh -q -o "BatchMode yes" $HMC lssyscfg -m $server -r lpar -F "name" | sort`
    for lpar in $lparlist; do
             echo "    \"$server\" -- \"$lpar\" "
    done
done
echo "}"
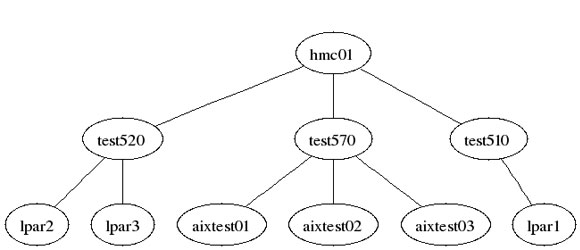
通过提供一个 HMC 服务器名称作为参数传递给脚本,便可运行此脚本。该脚本将传递的第一个参数设置为 $HMC 变量。设置 $serverlist 变量的方法是连接到 HMC 并获得该 HMC 控制的所有托管服务器的清单。在这些托管服务器上进行循环,而脚本将为每台托管服务器打印一行 "HMC" -- "server" ,这表明 Graphviz 在每台 HMC 与其托管服务器之间绘制了一条直线。此外针对每台托管服务器,脚本再次连接到 HMC 并获得该托管系统上的 LPAR 清单,然后通过它们循环打印一行 "server" -- "LPAR"。这表明 Graphviz 在每台托管服务器与其 LPAR 之间都绘制了一条直线。(此脚本要求您在运行脚本的服务器与 HMC 之间设置 Secure Shell (SSH) 密钥身份验证)。
命令执行如下:
./hmc_to_dot.sh hmc_name
以上执行对应输出的内容如下所示:
graph hmc_graph{
    "hmc01" -- "test520"
        "test520" -- "lpar2"
        "test520" -- "lpar3"
    "hmc01" -- "test570"
        "test570" -- "aixtest01"
        "test570" -- "aixtest02"
        "test570" -- "aixtest03"
    "hmc01" -- "test510"
        "test510" -- "lpar1"
}
你可以轻松从脚本生成图,具体方法是运行以下命令:
./hmc_to_dot.sh hmc_server_name | dot -T png -o hmc_graph.png
运行脚本,该脚本会动态创建 DOT 语言,然后将这些输出传递给 dot 命令,以便让它创建一个文件名为 hmc_graph.png 的图表。下图显示了创建的图表。
基础语法总结(供有识之士参考)
具体的图说明内容包含属性(attr)、节点(node)、边(edge)和子图(subgraph)说明。
节点属性如下 :
| Name | Default | Values |
|---|---|---|
| color | black | node shape color |
| comment | any string (format-dependent) | |
| distortion | 0.0 | node distortion for shape=polygon |
| fillcolor | lightgrey/black | node fill color |
| fixedsize | false | label text has no affect on node size |
| fontcolor | black | type face color |
| fontname | Times-Roman | font family |
| fontsize | 14 | point size of label |
| group | name of node’s group | |
| height | .5 | height in inches |
| label | node name | any string |
| layer | overlay range | all, id or id:id |
| orientation | 0.0 | node rotation angle |
| peripheries | shape-dependent | number of node boundaries |
| regular | false | force polygon to be regular |
| shape | ellipse | node shape; see Section 2.1 and Appendix E |
| shapefile | external EPSF or SVG custom shape file | |
| sides | 4 | number of sides for shape=polygon |
| skew | 0.0 | skewing of node for shape=polygon |
| style | graphics options, e.g. bold, dotted, filled; cf. Section 2.3 | |
| URL | URL associated with node (format-dependent) | |
| width | .75 | width in inches |
| z | 0.0 | z coordinate for VRML output |
边框属性:
| Name | Default | Values |
|---|---|---|
| arrowhead | normal | style of arrowhead at head end |
| arrowsize | 1.0 | scaling factor for arrowheads |
| arrowtail | normal | style of arrowhead at tail end |
| color | black | edge stroke color |
| comment | any string (format-dependent) | |
| constraint | true | use edge to affect node ranking |
| decorate | if set, draws a line connecting labels with their edges | |
| dir | forward | forward, back, both, or none |
| fontcolor | black | type face color |
| fontname | Times-Roman | font family |
| fontsize | 14 | point size of label |
| headlabel | label placed near head of edge | |
| headport | n,ne,e,se,s,sw,w,nw | |
| headURL | URL attached to head label if output format is ismap | |
| label | edge label | |
| labelangle | -25.0 | angle in degrees which head or tail label is rotated off edge |
| labeldistance | 1.0 | scaling factor for distance of head or tail label from node |
| labelfloat | false | lessen constraints on edge label placement |
| labelfontcolor | black | type face color for head and tail labels |
| labelfontname | Times-Roman | font family for head and tail labels |
| labelfontsize | 14 | point size for head and tail labels |
| layer | overlay range | all, id or id:id |
| lhead | name of cluster to use as head of edge | |
| ltail | name of cluster to use as tail of edge | |
| minlen | 1 | minimum rank distance between head and tail |
| samehead | tag for head node; edge heads with the same tag are | |
| sametail | merged onto the same port | |
| style | tag for tail node; edge tails with the same tag are merged onto the same port | |
| taillabel | graphics options, e.g. bold, dotted, filled; cf. Section 2.3 | |
| tailport | label placed near tail of edge n,ne,e,se,s,sw,w,nw | |
| tailURL | URL attached to tail label if output format is ismap | |
| weight | 1 | integer cost of stretching an edge |
图属性如下:
| Name | Default | Values |
|---|---|---|
| bgcolor | background color for drawing, plus initial fill color | |
| center | false | center drawing on page |
| clusterrank | local | may be global or none |
| color | black | for clusters, outline color, and fill color if fillcolor not defined |
| comment | any string (format-dependent) | |
| compound | false | allow edges between clusters |
| concentrate | false | enables edge concentrators |
| fillcolor | black | cluster fill color |
| fontcolor | black | type face color |
| fontname | Times-Roman | font family |
| fontpath | list of directories to search for fonts | |
| fontsize | 14 | point size of label |
| label | any string | |
| labeljust | centered | ”l” and ”r” for left- and right-justified cluster labels, respectively |
| labelloc | top | ”t” and ”b” for top- and bottom-justified cluster labels, respectively |
| layers | id:id:id… | |
| margin | .5 | margin included in page, inches |
| mclimit | 1.0 | scale factor for mincross iterations |
| nodesep | .25 | separation between nodes, in inches. |
| nslimit | if set to f, bounds network simplex iterations by (f)(number of nodes) when setting x-coordinates | |
| nslimit1 | if set to f, bounds network simplex iterations by (f)(number of nodes) when ranking nodes | |
| ordering | if out out edge order is preserved | |
| orientation | portrait | if rotate is not used and the value is landscape, use landscape orientation |
| page | unit of pagination, e.g. “8.5,11” | |
| pagedir | BL | traversal order of pages |
| quantum | if quantum ¿ 0.0, node label dimensions will be rounded to integral multiples of quantum | |
| rank | same, min, max, source or sink | |
| rankdir | TB | LR (left to right) or TB (top to bottom) |
| ranksep | .75 | separation between ranks, in inches. |
| ratio | approximate aspect ratio desired, fill or auto | |
| remincross | if true and there are multiple clusters, re-run crossing minimization | |
| rotate | If 90, set orientation to landscape | |
| samplepoints | 8 | number of points used to represent ellipses and circles on output (cf. Appendix C |
| searchsize | 30 | maximum edges with negative cut values to check when looking for a minimum one during network simplex |
| size | maximum drawing size, in inches | |
| style | graphics options, e.g. filled for clusters | |
| URL | URL associated with graph (format-dependent) |
具体实例
这里列举几个常用到的例子,还有更加详细的例子还可以参考 官网例子中心
下面是一个二叉树代码:
digraph g {
    node [shape = record,height=.1];
    node0[label = "<f0> |<f1> G|<f2> "];
    node1[label = "<f0> |<f1> E|<f2> "];
    node2[label = "<f0> |<f1> B|<f2> "];
    node3[label = "<f0> |<f1> F|<f2> "];
    node4[label = "<f0> |<f1> R|<f2> "];
    node5[label = "<f0> |<f1> H|<f2> "];
    node6[label = "<f0> |<f1> Y|<f2> "];
    node7[label = "<f0> |<f1> A|<f2> "];
    node8[label = "<f0> |<f1> C|<f2> "];
    "node0":f2 -> "node4":f1;
    "node0":f0 -> "node1":f1;
    "node1":f0 -> "node2":f1;
    "node1":f2 -> "node3":f1;
    "node2":f2 -> "node8":f1;
    "node2":f0 -> "node7":f1;
    "node4":f2 -> "node6":f1;
    "node4":f0 -> "node5":f1;
}

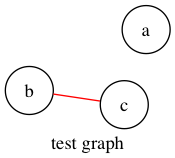
python 调用
除了可以使用 dot 文件编写图形外,也可以使用python编写相关的代码,生成图形文件, 安装 python 对应的 graphviz 相应的模块
pip install pygraphviz
引用 pygraphviz
import pygraphviz as pgv
初始化图类
G = pgv.AGraph()
增加节点和边
  G.add_node('a')       # adds node 'a'
  G.add_edge('b','c')   # adds edge 'b'-'c' (and also nodes 'b', 'c')
设置属性
  G.graph_attr['label'] = 'test graphf'
  G.node_attr['shape'] = 'circle'
  G.edge_attr['color'] = 'red'
设置输出的格式
  G.layout()              # default to neato
  G.layout(prog='dot')    # use do
输出到文件
  G.draw('file.png')              # write previously positioned graph to PNG file
  G.draw('file.ps',prog='circo')  # use circo to position, write PS file
效果如下图所示:
结束语
由于当今的动态虚拟环境的存在,系统在不断变化,很难保持文档与图表的时效性和准确性。本文介绍了 Graphviz 的基础知识,以及如何通过编写脚本,利用 Graphviz 的强大功能来创建最新、最准确的自动化环境图表。您可以从 cron 运行这些脚本,并将图表放在 Web 服务器上,这样就可以在您需要时随时重新创建图表,并通过 Web 浏览器轻松访问它们。
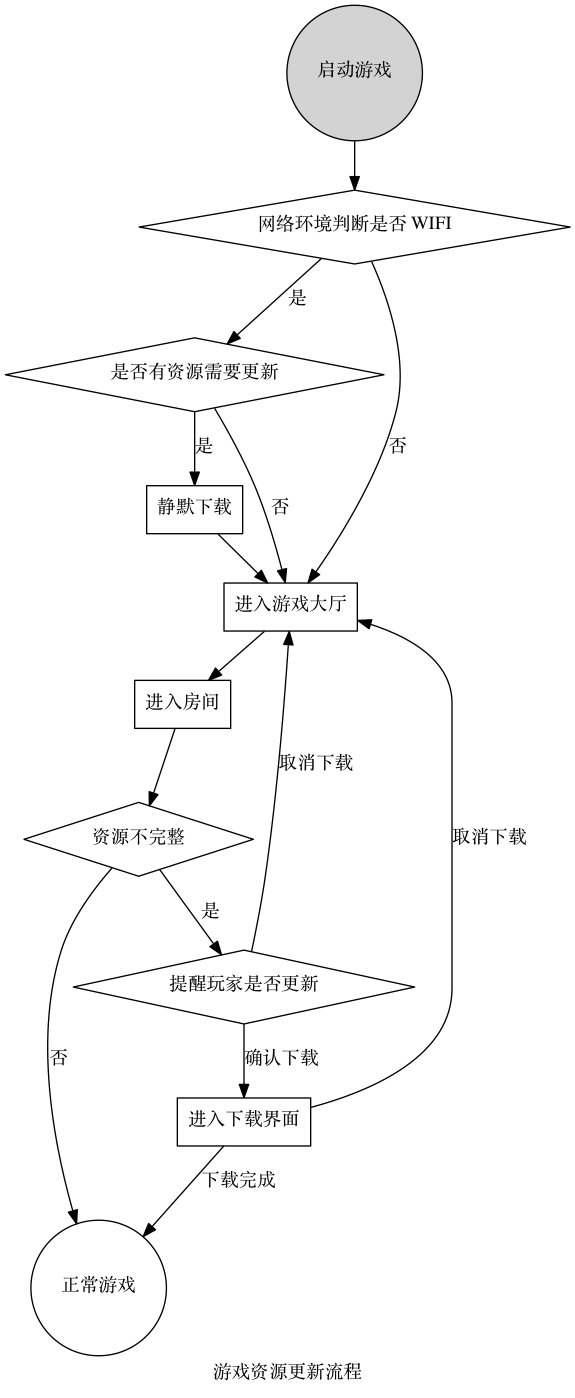
总结使用案例
案例一:
digraph startgame {
    label="游戏资源更新流程"
    rankdir="TB"
    start[label="启动游戏" shape=circle style=filled]
    ifwifi[label="网络环境判断是否 WIFI" shape=diamond]
    needupdate[label="是否有资源需要更新" shape=diamond]
    startslientdl[label="静默下载" shape=box]
    enterhall[label="进入游戏大厅" shape=box]

    enterroom[label="进入房间" shape=box]
    resourceuptodate[label="资源不完整" shape=diamond]
    startplay[label="正常游戏" shape=circle fillcolor=blue]
    warning[label="提醒玩家是否更新" shape=diamond]
    startdl[label="进入下载界面" shape=box]
    //{rank=same; needupdate, enterhall}

    {shape=diamond; ifwifi, needupdate}

    start -> ifwifi
    ifwifi->needupdate[label="是"]
    ifwifi->enterhall[label="否"]
    needupdate->startslientdl[label="是"]
    startslientdl->enterhall
    needupdate->enterhall[label="否"]

    enterhall -> enterroom
    enterroom -> resourceuptodate
    resourceuptodate -> warning[label="是"]
    resourceuptodate -> startplay[label="否"]
    warning -> startdl[label="确认下载"]
    warning -> enterhall[label="取消下载"]
    startdl -> enterhall[label="取消下载"]
    startdl -> startplay[label="下载完成"]
}
案例二:
digraph G{

    size = "5, 5";//图片大小
    main[shape=box];/*形状*/

    main->parse;
    parse->execute;

    main->init[style = dotted];//虚线

    main->cleanup;
    edge[color = green]; // 连接线的颜色

    execute->{make_string; printf}//连接两个

    init->make_string;
    main->printf[style=bold, label="100 times"];//线的 label

    make_string[label = "make a\nstring"]// \n, 这个node的label,注意和上一行的区别

    node[shape = box, style = filled, color = ".7.3 1.0"];//一个node的属性

    execute->compare;
}


 浙公网安备 33010602011771号