PHP制作图表 JpGraph
JpGraph 是PHP图表库,以下是如何操作:
1、JpGraph 下载地址:http://www.html580.com/11710/demo 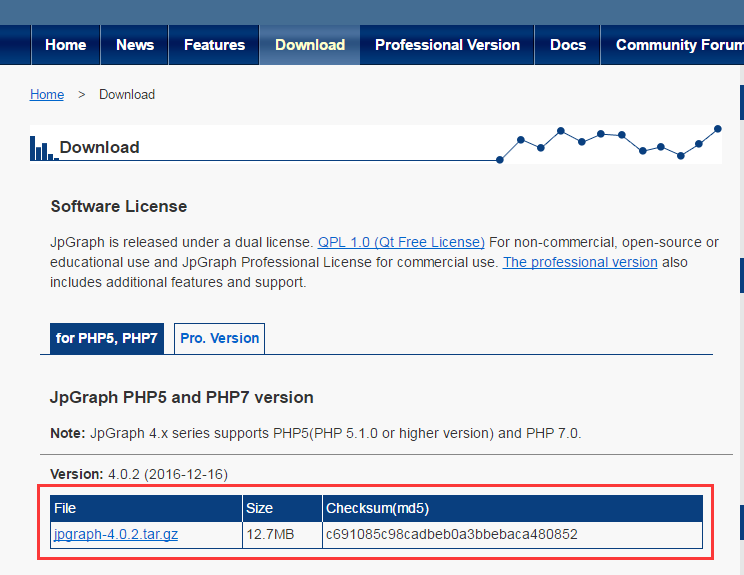
2、在PHP中引入相关JpGraph的文件
include ("jpgraph-4.0.2/src/jpgraph.php");
include ("jpgraph-4.0.2/src/jpgraph_bar.php");
include ("jpgraph-4.0.2/src/jpgraph_line.php");
include ("jpgraph-4.0.2/src/jpgraph_pie.php");
include ("jpgraph-4.0.2/src/jpgraph_pie3d.php");
3、miconv 中文转码
function miconv($names) {
    if(is_array($names)){
        foreach($names as $name){
            $newname[] = iconv('UTF-8','GB2312',$name);
        }
    }else{
        $newname = iconv('UTF-8','GB2312',$names);
    }
    return $newname;
}
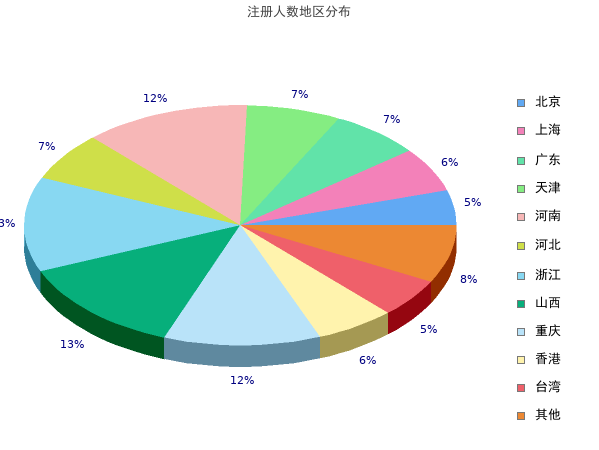
4、生成大饼图
//模拟数据
$data = array(18 ,23, 26 , 27 , 48 , 25 , 49 , 50 , 45 , 23 , 20 ,30);
//模拟数据对应地区
$month = miconv(array('北京','上海','广东','天津' , '河南' , '河北' , '浙江' , '山西' , '重庆','香港','台湾','其他'));
//图表宽高
$graph = new PieGraph(600 , 450);
$graph->SetShadow();

$graph->title->Set(iconv("UTF-8","GB2312//IGNORE","注册人数地区分布"));
$pieplot = new PiePlot3D($data);
$graph->title->SetFont(FF_SIMSUN,FS_BOLD);
$graph->legend->SetFont(FF_SIMSUN,FS_BOLD);
//0.01距左边的偏移 0.2距上方的偏移 后面两个默认为 right top
$graph->legend->SetPos(0.01,0.2,'right','right');
//设置图例一列显示
$graph->legend->SetColumns(1);
//设置行距
$graph->legend->SetLineSpacing(15);
//设置饼图的中心位置
$pieplot->SetCenter(0.4) ;
//设置图例
$pieplot->SetLegends($month);
$graph->Add($pieplot);
$graph->Stroke();
大饼图效果图:
5、生成线形图
$data1 = array(523,634,371,278,685,587,490,256,398,545,367,577); //第一条曲线的数组

$graph = new Graph(500,300);
$graph->SetScale("textlin");
$graph->SetShadow();
$graph->img->SetMargin(60,30,30,70); //设置图像边距

$graph->graph_theme = null; //设置主题为null,否则value->Show(); 无效

$lineplot1=new LinePlot($data1); //创建设置两条曲线对象
$lineplot1->value->SetColor("red");
$lineplot1->value->Show();
$graph->Add($lineplot1);  //将曲线放置到图像上

$graph->title->Set(iconv("UTF-8","GB2312//IGNORE","网志博客信息统计表"));   //设置图像标题
$graph->xaxis->title->Set(iconv("UTF-8","GB2312//IGNORE","月份")); //设置坐标轴名称
$graph->yaxis->title->Set(iconv("UTF-8","GB2312//IGNORE","流量"));
$graph->title->SetMargin(10);
$graph->xaxis->title->SetMargin(10);
$graph->yaxis->title->SetMargin(10);

$graph->title->SetFont(FF_SIMSUN,FS_BOLD); //设置字体
$graph->yaxis->title->SetFont(FF_SIMSUN,FS_BOLD);
$graph->xaxis->title->SetFont(FF_SIMSUN,FS_BOLD);
$graph->xaxis->SetTickLabels($gDateLocale->GetShortMonth());
$graph->Stroke();  //输出图像
线形图效果图: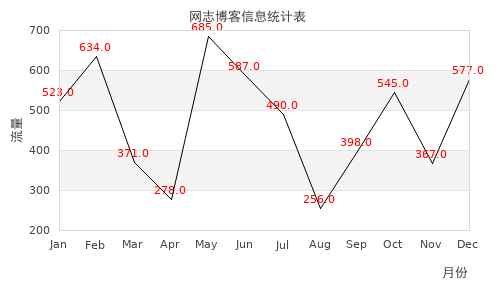
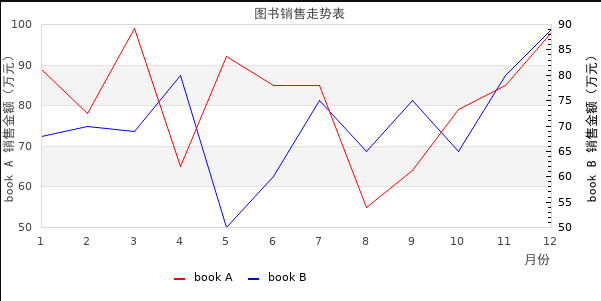
6、多个折线图
$data1 = array(89, 78, 99, 65, 92, 85, 85, 55, 64, 79, 85, 98);//设置统计数据
$data2 = array(68, 70, 69, 80, 50, 60, 75, 65, 75, 65, 80, 89);//设置统计数据

$graph = new Graph(600, 300);//创建统计图对象
$graph->SetScale('textlin');//设置刻度样式
$graph->SetY2Scale('lin');
$graph->SetShadow();//设置背景带阴影
$graph->img->SetMargin(40, 50, 20, 70);// 设置图表灰度四周边距,顺序为左右上下
$graph->title->Set(iconv('utf-8', 'GB2312//IGNORE', '图书销售走势表'));//设置走势图的标题

$lineplot1 = new LinePlot($data1);//建立LinePlot对象
$lineplot2 = new LinePlot($data2);//建立LinePlot对象
$graph->Add($lineplot1);
$graph->AddY2($lineplot2);

$graph->xaxis->title->Set(iconv('utf-8', 'GB2312//IGNORE', "月份"));//设置x轴的标题
$graph->yaxis->title->Set(iconv('utf-8', 'GB2312//IGNORE', "book A 销售金额(万元)"));//设置y轴的标题
$graph->y2axis->title->Set(iconv('utf-8', 'GB2312//IGNORE', "book B 销售金额(万元)"));//设置y轴的标题
$graph->y2axis->title->SetMargin(20);//设置右边的title到图的距离
$graph->title->SetFont(FF_SIMSUN, FS_BOLD);//设置字体
$graph->yaxis->title->SetFont(FF_SIMSUN, FS_BOLD);
$graph->y2axis->title->SetFont(FF_SIMSUN, FS_BOLD);
$graph->xaxis->title->SetFont(FF_SIMSUN, FS_BOLD);
$lineplot1->SetColor('red');//设置颜色
$lineplot2->SetColor('blue');
$lineplot1->SetLegend('book A');//绑定
$lineplot2->SetLegend('book B');
$graph->legend->SetLayout(LEGEND_HOR);
$graph->legend->Pos(0.4, 0.95, 'center', 'bottom');
//图例文字框的位置 0.4,0.95 是以右上角为基准的,0.4是距左右距离,0.95是上下距离。
$graph->Stroke();//输出
多个折线图效果图:
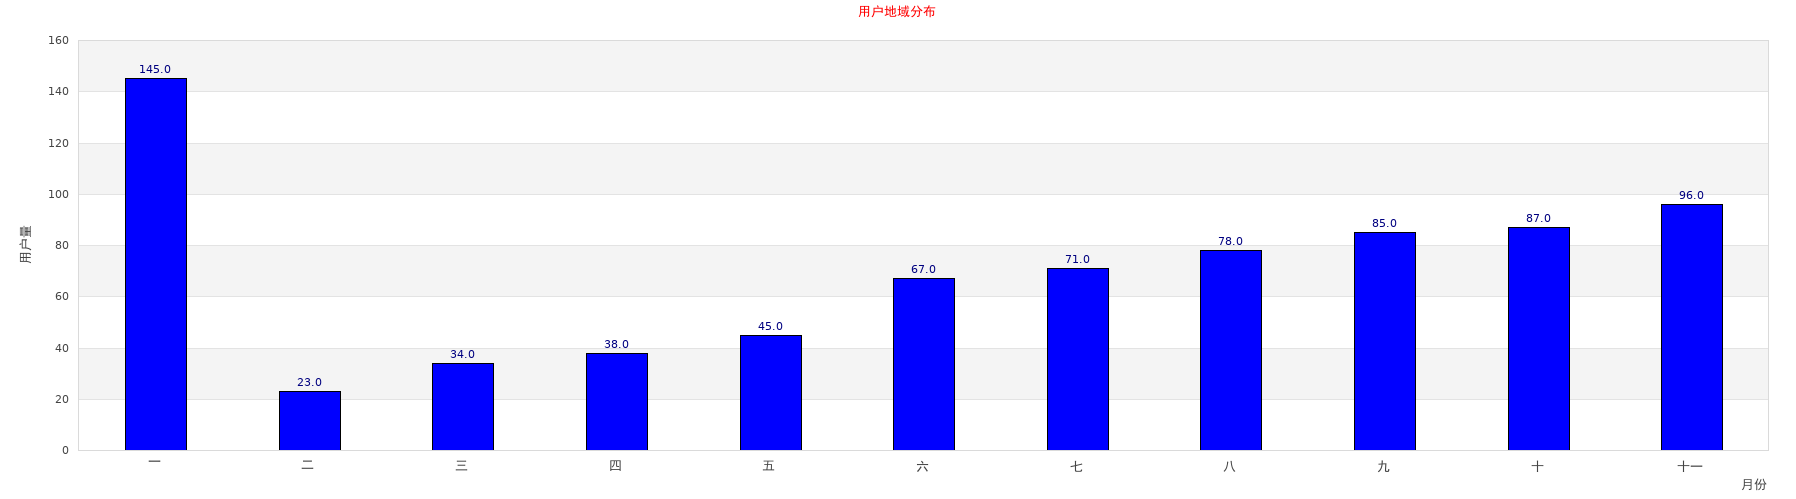
7、生成柱状图
$datay1  = array(145,23,34,38,45,67,71,78,85,87,96);
$datax = array("一","二","三","四","五","六","七","八","九","十","十一","十二");

$graph = new Graph(1800,500);  //创建新的Graph对象
$graph->SetScale("textlin");  //刻度样式
$graph->SetShadow();          //设置阴影
$graph->img->SetMargin(80,30,40,50); //设置边距

$graph->graph_theme = null; //设置主题为null,否则value->Show(); 无效

$barplot = new BarPlot($datay1);  //创建BarPlot对象
$barplot->SetFillColor('blue'); //设置颜色
$barplot->value->Show(); //设置显示数字
$graph->Add($barplot);  //将柱形图添加到图像中

$graph->title->Set(iconv("UTF-8","GB2312//IGNORE","用户地域分布"));
$graph->xaxis->title->Set(iconv("UTF-8","GB2312//IGNORE","月份")); //设置标题和X-Y轴标题
$graph->yaxis->title->Set(iconv("UTF-8","GB2312//IGNORE","用户量"));
$graph->title->SetColor("red");
$graph->yaxis->title->SetMargin(20);
$graph->xaxis->SetTickLabels(miconv($datax));

$graph->title->SetFont(FF_SIMSUN,FS_BOLD);  //设置字体
$graph->yaxis->title->SetFont(FF_SIMSUN,FS_BOLD);
$graph->xaxis->title->SetFont(FF_SIMSUN,FS_BOLD);
$graph->xaxis->SetFont(FF_SIMSUN,FS_BOLD);

$graph->Stroke();
柱状图效果图:
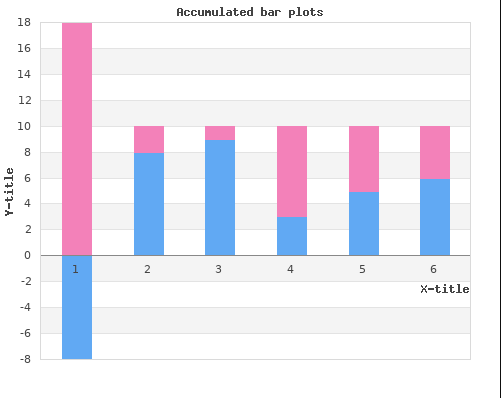
8、生成树形图
//创建图表的数据,可以自定义
$data1y=array(-8,8,9,3,5,6);
$data2y=array(18,2,1,7,5,4);

// 图表的长宽
$graph = new Graph(500,400);
$graph->SetScale("textlin");
$graph->SetShadow();

//图表的外边距
$graph->img->SetMargin(40,30,20,40);
// Create the bar plots
$b1plot = new BarPlot($data1y);
$b1plot->SetFillColor("orange");
$b1plot->value->Show();
$b2plot = new BarPlot($data2y);
$b2plot->SetFillColor("blue");
$b2plot->value->Show();
// Create the grouped bar plot
$gbplot = new AccBarPlot(array($b1plot,$b2plot));
// ...and add it to the graPH
$graph->Add($gbplot);

//设置图表的标题字体、大小
$graph->title->Set("Accumulated bar plots");
$graph->xaxis->title->Set("X-title");
$graph->yaxis->title->Set("Y-title");

//和上面标题对应,设置标题的字体和大小
$graph->title->SetFont(FF_FONT1,FS_BOLD);
$graph->yaxis->title->SetFont(FF_FONT1,FS_BOLD);
$graph->xaxis->title->SetFont(FF_FONT1,FS_BOLD);

$graph->Stroke();
树形图效果图:

 浙公网安备 33010602011771号