
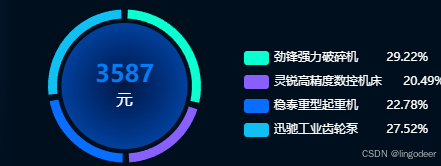
效果如上
外环代码:
series: [
        {
          name: "产品金额",
          type: "pie",
          radius: ["75%", "85%"],
          center: props.center,
          padAngle: 5, // 饼图扇形之间的间距
          avoidLabelOverlap: false,
          itemStyle: {
            borderRadius: 0
          },
          label: {
            show: false,
            position: "center",
            fontWeight: "bold"
          },
          emphasis: {
            label: {
              show: false,
              fontSize: 18
            }
          },
          labelLine: {
            show: false
          },
          data: props.data
        },
]
内环代码:
series:[
     ...外环代码,
     {
          name: "背景",
          type: "pie",
          radius: ["0%", "70%"], // 设置内环的半径
          center: props.center,
          data: [{ value: total, name: "产品金额" }],
          itemStyle: {
            color: new echarts.graphic.RadialGradient(0.5, 0.5, 1, [
              { offset: 0, color: "rgba(1, 71, 235, 0.20)" },
              { offset: 1, color: "rgba(2, 125, 247, 1)" }
            ]) // 设置内环的背景颜色
          },
          label: {
            show: true,
            position: "center",
            formatter: params => {
              return `{a|${params.value}}\n{b|元}`;
            },
            rich: {
              a: {
                fontSize: 24,
                color: new echarts.graphic.LinearGradient(0, 0, 1, 0, [
                  { offset: 0, color: "rgba(138, 203, 255, 1)" },
                  { offset: 1, color: "rgba(0, 74, 255, 1))" }
                ]).toString(),
                fontWeight: "bold"
              },
              b: {
                fontSize: 16,
                color: "#fff",
                padding: [5, 0, 0, 0]
              }
            }
          },
          labelLine: {
            show: false
          },
          silent: true // 防止鼠标事件触发
        }
]
右侧图例代码:
legend: {
        orient: "vertical", // 显示方式 纵向
        right: "0%",
        top: 50,
        width: 200,
        textStyle: {
          color: "#fff",
          fontSize: 12
        },
        data: props.data.map(item => item.name), // 仅显示实际数据的图例项
        formatter: name => {
          const item = props.data.find(item => item.name === name);
          const percentage = ((item.value / total) * 100).toFixed(2);
          return `${name.padEnd(15, " ")}${percentage}%`;
        }
      },
 浙公网安备 33010602011771号