matplotmib绘制简单折线图
安装matplotlib模块
$ python -m pip install matplotlib
绘制简单折线图
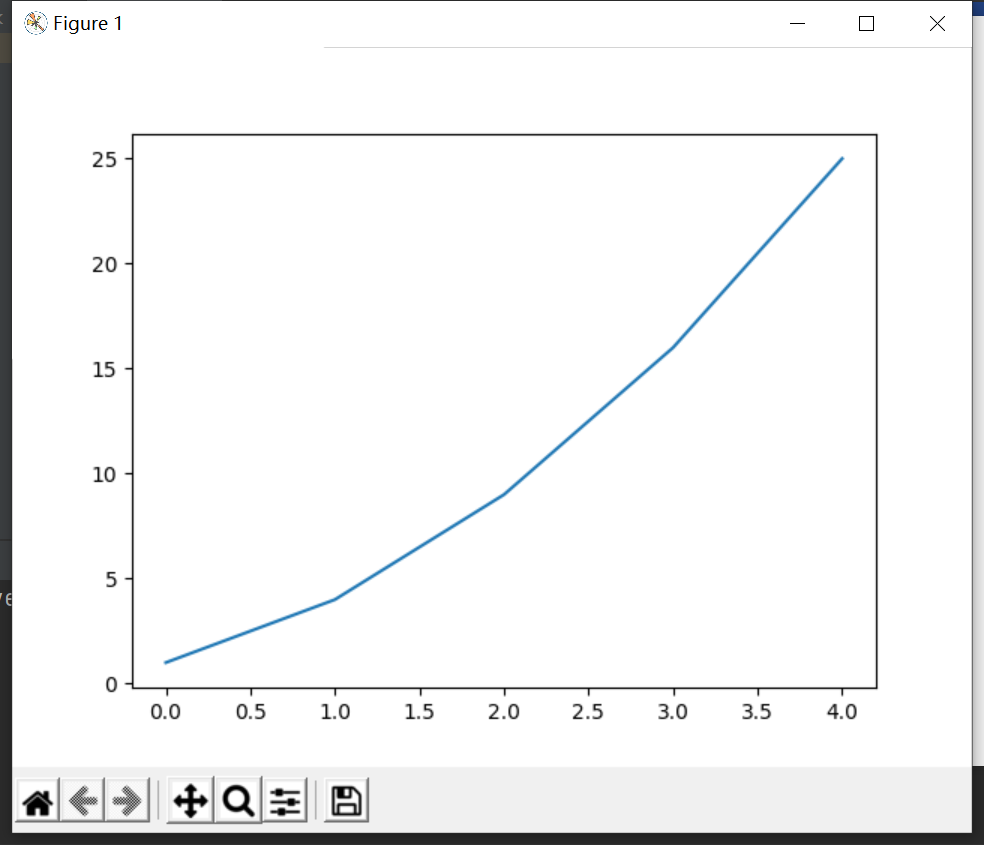
import matplotlib.pyplot as plt # 导入模块matplotlib并起别名plt,方便调用

squares = [1,4,9,16,25]         # 创建列表,作图用的数据
fig,ax = plt.subplots()         # fig表示整张图片,ax表示fig图片中的图表,函数subplots()在一张图片中绘制一个或多个图表
ax.plot(squares)                # 根据给定数据squares绘制图表
plt.show()                      # 打开matplotlib查看器并显示绘制的图表
效果图