python绘制曲线图
import matplotlib.pyplot as plt; plt.rcdefaults()
import numpy as np
import matplotlib.pyplot as plt
import math
import matplotlib as mpl
# mpl.use('Agg')
import seaborn as sns
import matplotlib.pyplot as plt
import json
import os
import os.path as osp
import numpy as np
import pandas as pd
DIV_LINE_WIDTH = 50
font_size = 80
# colors for plot
COLORS = ([
# deepmind style
'#009E73',
'#CC79A7',
'#0072B2',
'#F0E442',
'#D55E00',
'#0072B2',
'#009E73',
'#CC79A7',
'#D55E00',
# '#CC79A7',
'#F0E442',
# built-in color
'blue', 'green', 'red', 'cyan', 'magenta', 'yellow', 'black', 'purple', 'pink',
'brown', 'orange', 'teal', 'lightblue', 'lime', 'lavender', 'turquoise',
'darkgreen', 'tan', 'salmon', 'gold', 'darkred', 'darkblue',
# personal color
'#313695', # DARK BLUE
'#74add1', # LIGHT BLUE
'#4daf4a', # GREEN
'#f46d43', # ORANGE
'#d73027', # RED
'#984ea3', # PURPLE
'#f781bf', # PINK
'#ffc832', # YELLOW
'#000000', # BLACK
])
# 平滑处理,类似tensorboard的smoothing函数
def smooth(data, weight=0.75):
smoothed = []
scalar = data
last = scalar[0]
for point in scalar:
smoothed_val = last * weight + (1 - weight) * point
smoothed.append(smoothed_val)
last = smoothed_val
return np.array(smoothed)
# smooth = 3
# convkernel = np.ones(2 * smooth + 1)
# mean = np.convolve(mean, convkernel, mode='same')/\
# np.convolve(np.ones_like(mean), convkernel, mode='same')
def main():
algos = ['algo1', 'algo2', 'algo3']
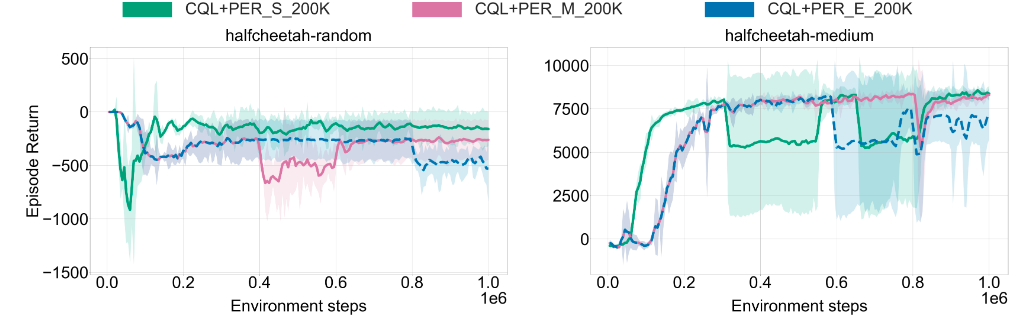
tasks_names = ['halfcheetah-random','halfcheetah-medium' ]
# print("algos: ", algos)
# tasks = ['E:/1study/2022/0-paper/3-SCI_offline rl PER/data of the experiemnts for offline PER/1. CQL+PER(without+200K+whole)/hopper/hopper-medium-expert/run-cql_hopper-medium-expert-v2_PER_S_200K_seed_',
# 'E:/1study/2022/0-paper/3-SCI_offline rl PER/data of the experiemnts for offline PER/1. CQL+PER(without+200K+whole)/hopper/hopper-medium-expert/run-cql_hopper-medium-expert-v2_PER_W_1000K_seed_',
# 'E:/1study/2022/0-paper/3-SCI_offline rl PER/data of the experiemnts for offline PER/1. CQL+PER(without+200K+whole)/hopper/hopper-medium-expert/run-cql_hopper-medium-expert-v2_seed_']
tasks_0 = [
'E:/1study/2022/0-paper/3-SCI_offline rl PER/data of the experiemnts for offline PER/3. CQL+PER(200K, for 0,1,2 stages)/halfcheetah-random/run-cql_halfcheetah-random-v2_PER_S_200K_seed_',
'E:/1study/2022/0-paper/3-SCI_offline rl PER/data of the experiemnts for offline PER/3. CQL+PER(200K, for 0,1,2 stages)/halfcheetah-random/run-cql_halfcheetah-random-v2_PER_M_200K_stage1_seed_',
'E:/1study/2022/0-paper/3-SCI_offline rl PER/data of the experiemnts for offline PER/3. CQL+PER(200K, for 0,1,2 stages)/halfcheetah-random/run-cql_halfcheetah-random-v2_PER_E_200K_stage2_seed_']
tasks_1 = [
'E:/1study/2022/0-paper/3-SCI_offline rl PER/data of the experiemnts for offline PER/3. CQL+PER(200K, for 0,1,2 stages)/halfcheetah-medium/run-cql_halfcheetah-medium-v2_PER_S_200K_seed_',
'E:/1study/2022/0-paper/3-SCI_offline rl PER/data of the experiemnts for offline PER/3. CQL+PER(200K, for 0,1,2 stages)/halfcheetah-medium/run-cql_halfcheetah-medium-v2_PER_M_200K_stage1_seed_',
'E:/1study/2022/0-paper/3-SCI_offline rl PER/data of the experiemnts for offline PER/3. CQL+PER(200K, for 0,1,2 stages)/halfcheetah-medium/run-cql_halfcheetah-medium-v2_PER_E_200K_stage2_seed_']
# tasks_2 = [
# 'E:/1study/2022/0-paper/3-SCI_offline rl PER/data of the experiemnts for offline PER/1. CQL+PER(without+200K+whole)/walker2d/walker2d-medium-expert/run-cql_walker2d-medium-expert-v2_PER_S_200K_seed_',
# 'E:/1study/2022/0-paper/3-SCI_offline rl PER/data of the experiemnts for offline PER/1. CQL+PER(without+200K+whole)/walker2d/walker2d-medium-expert/run-cql_walker2d-medium-expert-v2_PER_W_1000K_seed_',
# 'E:/1study/2022/0-paper/3-SCI_offline rl PER/data of the experiemnts for offline PER/1. CQL+PER(without+200K+whole)/walker2d/walker2d-medium-expert/run-cql_walker2d-medium-expert-v2_seed_']
# tasks_0 = [
# 'E:/1study/2022/0-paper/3-SCI_offline rl PER/data of the experiemnts for offline PER/2. CQL+PER_whole_1000K_3_TD_Error/hopper/hopper-medium/run-cql_hopper-medium-v2_PER_W_1000K_seed_',
# 'E:/1study/2022/0-paper/3-SCI_offline rl PER/data of the experiemnts for offline PER/2. CQL+PER_whole_1000K_3_TD_Error/hopper/hopper-medium/run-offline_per_hopper_cql_hopper-medium-v2_PER_W_1000K_max_seed_',
# 'E:/1study/2022/0-paper/3-SCI_offline rl PER/data of the experiemnts for offline PER/2. CQL+PER_whole_1000K_3_TD_Error/hopper/hopper-medium/run-offline_per_hopper_cql_hopper-medium-v2_PER_W_1000K_medium_0.75_seed_']
# tasks_1 = [
# 'E:/1study/2022/0-paper/3-SCI_offline rl PER/data of the experiemnts for offline PER/2. CQL+PER_whole_1000K_3_TD_Error/halfcheetah/halfcheetah-medium/run-cql_halfcheetah-medium-v2_PER_W_1000K_seed_',
# 'E:/1study/2022/0-paper/3-SCI_offline rl PER/data of the experiemnts for offline PER/2. CQL+PER_whole_1000K_3_TD_Error/halfcheetah/halfcheetah-medium/run-offline_per_halfcheetah_cql_halfcheetah-medium-v2_PER_W_1000K_max_seed_',
# 'E:/1study/2022/0-paper/3-SCI_offline rl PER/data of the experiemnts for offline PER/2. CQL+PER_whole_1000K_3_TD_Error/halfcheetah/halfcheetah-medium/halfcheetah-medium-v2_PER_W_1000K_medium_0.75_seed_']
# tasks_2 = [
# 'E:/1study/2022/0-paper/3-SCI_offline rl PER/data of the experiemnts for offline PER/2. CQL+PER_whole_1000K_3_TD_Error/walker2d/walker2d-medium/run-cql_walker2d-medium-v2_PER_W_1000K_seed_',
# 'E:/1study/2022/0-paper/3-SCI_offline rl PER/data of the experiemnts for offline PER/2. CQL+PER_whole_1000K_3_TD_Error/walker2d/walker2d-medium/walker2d-mudium-v2_PER_W_1000K_max_seed_',
# 'E:/1study/2022/0-paper/3-SCI_offline rl PER/data of the experiemnts for offline PER/2. CQL+PER_whole_1000K_3_TD_Error/walker2d/walker2d-medium/walker2d-medium-v2_PER_W_1000K_medium_0.75_seed_']
tasks_all = [tasks_0, tasks_1]
fig, ax = plt.subplots(1,2, figsize=(80,20))
#fig = plt.figure(figsize = (30,10), dpi = 80)
#plt.figure()
myfig = plt.gcf()
plt.rcParams['font.family'] = 'Times New Roman'
plt.style.use('seaborn')
plt.subplots_adjust(hspace=0.4)
seed_number = ['10', '11', '12']
logdir_tail = '-tag-eval_episode_reward.csv'
num = [0 for i in range(len(tasks_0))]
for i in range(len(tasks_all)):
for j in range(len(tasks_all[i])):
logdir_head = tasks_all[i][j]
# plt.title(logdir_head, fontsize=22)
# plt.xlabel('Timesteps', fontsize=22)
# plt.ylabel('Episode Reward', fontsize=22)
# plt.grid(linestyle='dashed')
current_steps = []
current_data = []
for algo_num in range(len(seed_number)):
algo = seed_number[algo_num]
logdir = logdir_head + algo + logdir_tail
# print(logdir)
# if logdir = 'E:/1study/2022/0-paper/3-SCI_offline rl PER/data of the experiemnts for offline PER/2. CQL+PER_whole_1000K_3_TD_Error/walker2d/walker2d-medium/run-cql_walker2d-medium-v2_PER_W_1000K_seed_10-tag-eval_episode_reward.csv':
# import pdb
# pdb.set_trace()
# if logdir == 'E:/1study/2022/0-paper/3-SCI_offline rl PER/data of the experiemnts for offline PER/2. CQL+PER_whole_1000K_3_TD_Error/halfcheetah/halfcheetah-medium/run-offline_per_halfcheetah_cql_halfcheetah-medium-v2_PER_W_1000K_medium_0.75_seed_10-tag-eval_episode_reward.csv':
# import pdb
# pdb.set_trace()
data = pd.read_csv(logdir)
# print(data)
data = np.array(data)
#print(data.shape[0])
#print(data)
current_steps = data[:, 1]
current_data.append(data[:, 2])
epoches = np.array(current_steps)
current_data = np.array(current_data)
mean = np.mean(current_data, axis=0)
std = np.std(current_data, axis=0)
smooth = 1
convkernel = np.ones(2 * smooth + 1)
mean = np.convolve(mean, convkernel, mode='same')/\
np.convolve(np.ones_like(mean), convkernel, mode='same')
#std = np.convolve(std, convkernel, mode='same')/\
#np.convolve(np.ones_like(std), convkernel, mode='same')
#mean = smooth(mean)
#std = smooth(std)
sns.lineplot(epoches, mean, ax=ax[i], legend=False, lw=12, color=COLORS[j], markers="o")
ax[i].fill_between(epoches, mean + std, mean - std, color=COLORS[j], alpha=.15)
num[j] = ax[i].fill_between(epoches, mean, mean, color=COLORS[j], lw=0.01, alpha=1)
# plt.plot(epoches, mean, color=COLORS[task_num], label=algos[task_num], linewidth=3)
# plt.fill_between(epoches, mean - std,
# mean + std, color=COLORS[task_num], alpha=.2)
ax[i].grid(True)
ax[i].set_title(tasks_names[i], fontsize=font_size, pad=30)
ax[i].set_xlabel('Environment steps', fontdict={'size':80}, labelpad=40)
ax[0].set_ylabel('Episode Return', fontdict={'size':80})
ax[i].get_yaxis().get_offset_text().set(va='bottom', ha='left')
ax[i].xaxis.get_offset_text().set_fontsize(80)#设置1e6的大小与位置
ax[i].tick_params(labelsize=80) #刻度字体大小40
ax[i].ticklabel_format(style='sci', scilimits=(0,0), axis='x',fontsize="80")
ax[i].lines[len(tasks_all[i])-1].set_linestyle("--")
fig.legend((num[0],num[1],num[2]), ("CQL+PER_S_200K","CQL+PER_M_200K","CQL+PER_E_200K"),'upper center',columnspacing=5, \
labelspacing=5, handlelength=3, handleheight=1.2, borderaxespad=-0.5, ncol=30, frameon=False, fontsize=80, \
facecolor='gray', framealpha=1)
# plt.legend((num[0], num[1]), ['1st', '2nd'], loc=0,
# title='legends', ncol=2, markerfirst=False,
# numpoints=2, frameon=True, fancybox=True,
# facecolor='gray', edgecolor='r', shadow=True)
# plt.title('hopper')
# plt.legend()
plt.show()
myfig.savefig("offline_3_stages.png",dpi=300, bbox_inches = 'tight')
if __name__ == "__main__":
main()
# # list is the baselines to show
# mbmrl = ['M-DPILCO', 'MLSM-v0', 'MLSM-v1', 'L2A', 'GSSM', 'GSSM+APS']
# y_pos = np.arange(len(mbmrl))
# # mean performance of 5 runs
# pn_performance = [0.635,0.641,0.593,0.892,0.581,0.528]
# # standard deviation of 5 runs
# pn_std = [0.077,0.098,0.082,0.033,0.091,0.068]
# rects = plt.bar(y_pos,pn_performance, yerr=pn_std, align='center', alpha=0.8)
# plt.xticks(y_pos, mbmrl)
# plt.ylabel('Average Cost', fontsize=12)
# plt.title('Meta Testing Performance in Cart-Pole Systems', fontsize=14)
# def autolabel(rects):
# """Attach a text label above each bar in *rects*, displaying its height."""
# for rect in rects:
# height = rect.get_height()
# plt.annotate('{}'.format(height),
# xy=(rect.get_x() + rect.get_width() / 2, height),
# xytext=(0, 3), # 3 points vertical offset
# textcoords="offset points",
# ha='center', va='bottom')
# autolabel(rects)
# plt.show()

 浙公网安备 33010602011771号