绘制双子图含图例完整代码
import matplotlib.pyplot as plt
from matplotlib import ticker
import seaborn as sns
import pandas as pd
import numpy as np
plt.style.use('ggplot')
# fig, ax = plt.subplots(1,len(scenarios), figsize=(25,4.5))
# plt.show()
# colors = ["#468de4", 'orange', 'green', '#e44a44', 'purple']
colors = ['orange', 'purple']
data = {"Ave_reward":[], "Step":[]}
reward = []
# name = './tikick/{}_{}.csv'.format(file_name[i], aname)
name = ['PongNoFrameskip-v0_0_bcq.csv','PongNoFrameskip-v0_0_bcq_0.csv']
# f, (ax1, ax2) = plt.subplots(1, 2, sharey=True)
#************** below is the first figure ***************#
file = pd.read_csv(name[0])
for key in file:
if "avg_reward" in key:
reward.append(file[key].tolist())
plt_step = np.array(pd.read_csv(name[0])["step"].tolist())
plt_reward = np.array(reward)
data["Ave_reward"] = plt_reward.mean(0)
data["step"] = plt_step
ax = plt.subplot(121)
font_size = 10
x_step = plt_step.tolist()
y_mean = data["Ave_reward"].tolist()
y_max = plt_reward.max(0).tolist()
y_min = plt_reward.min(0).tolist()
# sns.lineplot(x_step, y_mean)
sns.lineplot(x_step, y_mean, ax=ax, legend=True, label = u'RCSCA_Net', lw=3, color=colors[0])
# plt.fill_between(x_step,y_max,y_min,facecolor="green",edgecolor="red",alpha=0.3)
num = plt.fill_between(x_step,y_max,y_min,alpha=0.2,label='bcq')
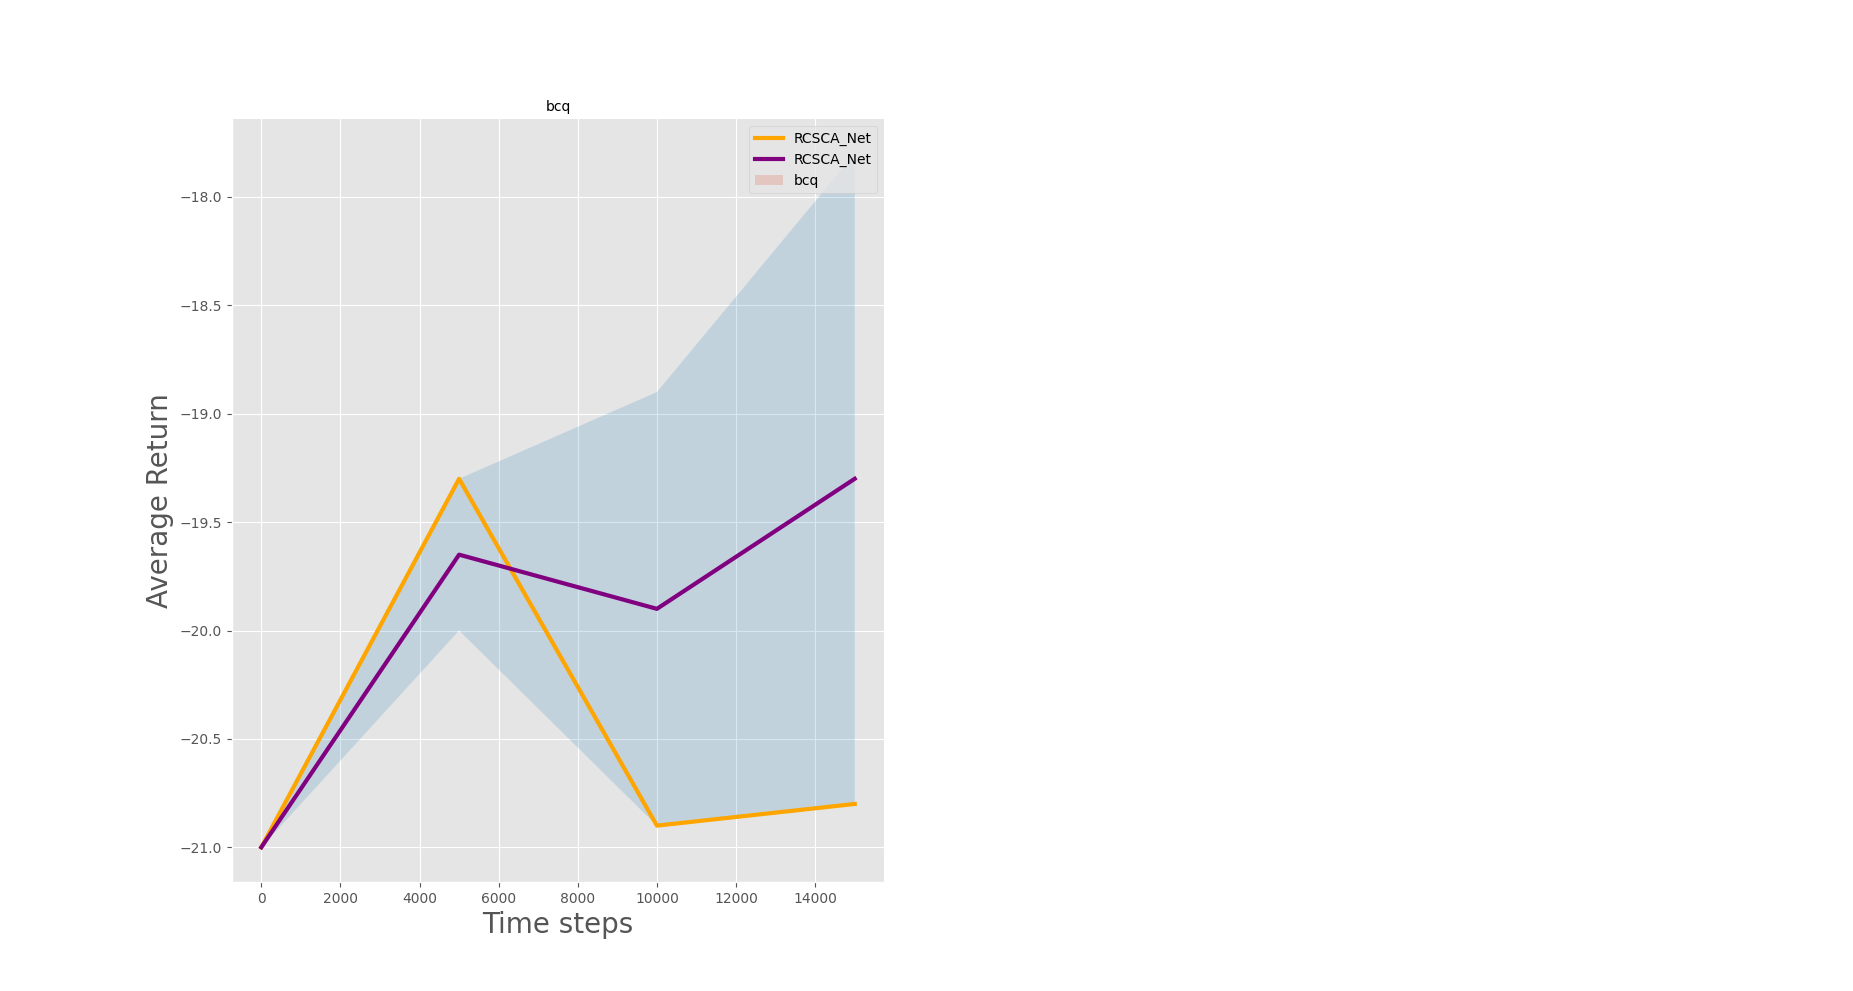
ax.set_title("BCQ", fontsize=font_size)
ax.spines['top'].set_visible(False)
ax.spines['right'].set_visible(False)
ax.set_xlabel('Time steps', fontdict={'size':20})
ax.tick_params(labelsize=font_size)
x_name = 'Average Return'
ax.set_ylabel(x_name, fontdict={'size':20})
plt.legend()
# fig.legend((num,), ('upper right',),'upper center',ncol=5)
# plt.legend(bbox_to_anchor=(-0.5, 1.40), ncol=2, labels='TiKick(ours)', \
# fontsize=22, frameon=True, facecolor='white', framealpha=1)
# ax.grid(True)
#************** below is the second figure ***************#
file = pd.read_csv(name[1])
for key in file:
if "avg_reward" in key:
reward.append(file[key].tolist())
plt_step = np.array(pd.read_csv(name[1])["step"].tolist())
plt_reward = np.array(reward)
data["Ave_reward"] = plt_reward.mean(0)
data["step"] = plt_step
ax = plt.subplot(121)
font_size = 10
x_step = plt_step.tolist()
y_mean = data["Ave_reward"].tolist()
y_max = plt_reward.max(0).tolist()
y_min = plt_reward.min(0).tolist()
# sns.lineplot(x_step, y_mean)
sns.lineplot(x_step, y_mean, ax=ax, legend=True, label = u'RCSCA_Net',lw=3, color=colors[1])
# plt.fill_between(x_step,y_max,y_min,facecolor="green",edgecolor="red",alpha=0.3)
num = plt.fill_between(x_step,y_max,y_min,alpha=0.2,label='bcq')
ax.set_title("bcq", fontsize=font_size)
ax.spines['top'].set_visible(False)
ax.spines['right'].set_visible(False)
ax.set_xlabel('Time steps', fontdict={'size':20})
ax.tick_params(labelsize=font_size)
x_name = 'Average Return'
# ax.set_ylabel(x_name, fontdict={'size':font_size})
# plt.legend()
# fig.legend((num,), ('upper right',),'upper center',ncol=5)
# plt.legend(bbox_to_anchor=(-0.5, 1.40), ncol=2, labels='TiKick(ours)', \
# fontsize=22, frameon=True, facecolor='white', framealpha=1)
ax.grid(True)
plt.show()
import pdb
pdb.set_trace()