ggplot2 Manhattan Plots | ggmanh | ggplot画曼哈顿图
2023年11月08日
用TCGA的数据做了一个genome-wide的GSEA分析
library(ggmanh)
library(SeqArray)
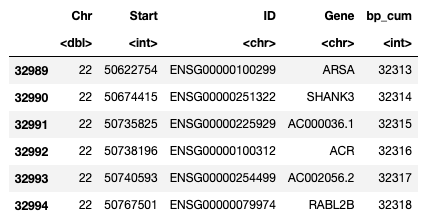
只需要把gene转化为chr和position即可
hg38.anno <- read.csv("https://github.com/leezx/RToolbox/raw/master/data/gene.anno.GRCh38.ensembl90.csv", sep = ";", header = F)
hg38.anno <- hg38.anno[!duplicated(hg38.anno$V9),]

rownames(hg38.anno) <- hg38.anno$V9

stem.gsea$chromosome <- hg38.anno[rownames(stem.gsea),]$V1
stem.gsea$position <- hg38.anno[rownames(stem.gsea),]$V3

diff.gsea$chromosome <- hg38.anno[rownames(diff.gsea),]$V1
diff.gsea$position <- hg38.anno[rownames(diff.gsea),]$V3
stem.gsea <- subset(stem.gsea, chromosome %in% c(1:22,"X"))
stem.gsea$chromosome <- factor(stem.gsea$chromosome, c(1:22,"X"))
options(repr.plot.width=7, repr.plot.height=4)
g <- manhattan_plot(x = stem.gsea, pval.colname = "stem_pvalue", chr.colname = "chromosome", pos.colname = "position",
                    plot.title = "Genome-wide GSEA analysis (stem signature)", y.label = "-log10(P value)")
g
参考:http://localhost:17435/notebooks/data_center/public_DB/DB-TCGA-CCLE-GTEx.ipynb
最经典的一种genome wide图形,可以显示全基因组的hit。
GWAS的数据
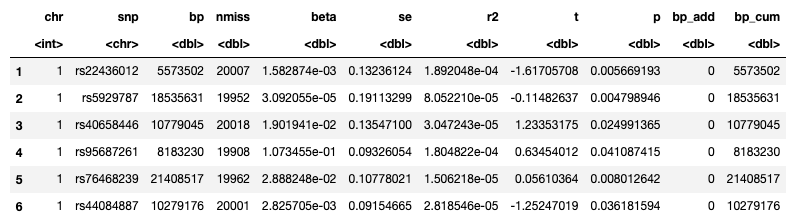
需要里面的Chr,start,bp_cum,以及最核心的p-value。
我准备的CRIPSR screen数据。
参考:
- How I Create Manhattan Plots Using ggplot
- http://localhost:17435/notebooks/tmpData/ApcKO_cellranger/psi/R_process.ipynb

 浙公网安备 33010602011771号