jupyter使用 matplotlib 画图
参考:
https://www.cnblogs.com/lone5wolf/p/10870200.html
https://blog.csdn.net/qq_39735236/article/details/79066032
jupyter 魔法语句
# jupyter中添加
%matplotlib inline
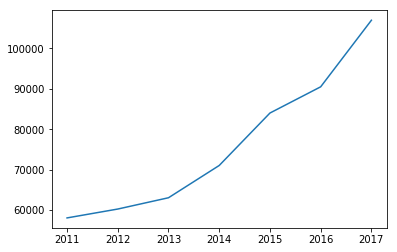
简单折线图
import matplotlib.pyplot as plt

x_data = ['2011','2012','2013','2014','2015','2016','2017']
y_data = [58000,60200,63000,71000,84000,90500,107000]

plt.plot(x_data,y_data)
plt.show()

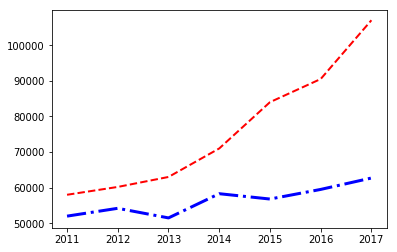
双折线图
import matplotlib.pyplot as plt
x_data = ['2011','2012','2013','2014','2015','2016','2017']
y_data = [58000,60200,63000,71000,84000,90500,107000]
y_data2 = [52000,54200,51500,58300,56800,59500,62700]

plt.plot(x_data,y_data,color='red',linewidth=2.0,linestyle='--')
plt.plot(x_data,y_data2,color='blue',linewidth=3.0,linestyle='-.')
plt.show()

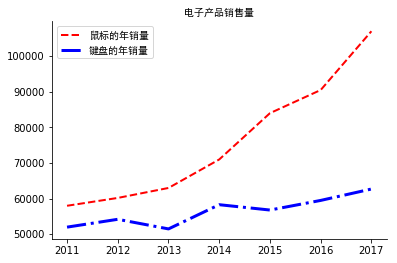
带图例的折线图
字体可选自己喜欢的字体,放到任意文件夹, 绝对路径指定即可
import matplotlib.pyplot as plt
import matplotlib.font_manager as fm  #字体管理器

x_data = ['2011','2012','2013','2014','2015','2016','2017']
y_data = [58000,60200,63000,71000,84000,90500,107000]
y_data2 = [52000,54200,51500,58300,56800,59500,62700]

ln1, = plt.plot(x_data,y_data,color='red',linewidth=2.0,linestyle='--')
ln2, = plt.plot(x_data,y_data2,color='blue',linewidth=3.0,linestyle='-.')

my_font = fm.FontProperties(fname="/home/zcr/soft/simhei.ttf")

plt.title("电子产品销售量",fontproperties=my_font) #设置标题及字体

plt.legend(handles=[ln1,ln2],labels=['鼠标的年销量','键盘的年销量'],prop=my_font)

ax = plt.gca()
ax.spines['right'].set_color('none')  # right边框属性设置为none 不显示
ax.spines['top'].set_color('none')    # top边框属性设置为none 不显示

plt.show()


