logstash output到kafka记录与总结( No entry found for connection 2)
简述
本文记录logstash的output配置为kafka的过程。这里是简单的例子,输入为stdin,本文主要目的是为了记录在这次配置过程中遇到的问题和解决的过程及总结。
关于kafka集群的搭建可以参考:https://www.cnblogs.com/ldsggv/p/11010497.html
一、logstash的conf文件配置
input{
 stdin {}
}
output{
stdout { codec => rubydebug }
kafka {
    bootstrap_servers => "192.168.183.195:9092,192.168.183.194:9092,192.168.183.196:9092"    #生产者
codec => json
    topic_id => "kafkalogstash"    #设置写入kafka的topic
  }
}
这里配置完成之后,如果kafka集群没有问题,那么启动logstash,就可以测试发送消息了;
启动:
bin/logstash -f logstash-kafka.conf
然后等待启动,
当提示:
[INFO ] 2019-06-11 17:52:51.163 [[main]-pipeline-manager] AppInfoParser - Kafka version : 2.1.0
[INFO ] 2019-06-11 17:52:51.164 [[main]-pipeline-manager] AppInfoParser - Kafka commitId : eec43959745f444f
[INFO ] 2019-06-11 17:52:51.342 [Converge PipelineAction::Create<main>] pipeline - Pipeline started successfully {:pipeline_id=>"main", :thread=>"#<Thread:0xa43495c sleep>"}
The stdin plugin is now waiting for input:
[INFO ] 2019-06-11 17:52:51.444 [Ruby-0-Thread-1: /usr/share/logstash/lib/bootstrap/environment.rb:6] agent - Pipelines running {:count=>1, :running_pipelines=>[:main], :non_running_pipelines=>[]}
[INFO ] 2019-06-11 17:52:51.708 [Api Webserver] agent - Successfully started Logstash API endpoint {:port=>9601}
此时启动成功
然后输入消息,正常的输出为下图,在kafka集群也能看到对应的topic信息,也能通过kafka-console-consumer.sh消费消息
456
{
    "@timestamp" => 2019-06-11T10:20:09.615Z,
          "host" => "emr-worker-4.cluster-96380",
      "@version" => "1",
       "message" => "456"
}
[INFO ] 2019-06-11 18:20:10.642 [kafka-producer-network-thread | producer-1] Metadata - Cluster ID: S8sBZgHPRJOv-nULn_bVGw

{
    "@timestamp" => 2019-06-11T11:48:11.234Z,
          "host" => "emr-worker-4.cluster-96380",
      "@version" => "1",
       "message" => ""
}
上面是正确的输出结果,但是我从一开始是没有成功的,输出为:
[INFO ] 2019-06-11 17:53:33.558 [kafka-producer-network-thread | producer-1] Metadata - Cluster ID: S8sBZgHPRJOv-nULn_bVGw
[ERROR] 2019-06-11 17:53:33.581 [kafka-producer-network-thread | producer-1] Sender - [Producer clientId=producer-1] Uncaught error in kafka producer I/O thread:
java.lang.IllegalStateException: No entry found for connection 2
    at org.apache.kafka.clients.ClusterConnectionStates.nodeState(ClusterConnectionStates.java:330) ~[kafka-clients-2.1.0.jar:?]
    at org.apache.kafka.clients.ClusterConnectionStates.disconnected(ClusterConnectionStates.java:134) ~[kafka-clients-2.1.0.jar:?]
    at org.apache.kafka.clients.NetworkClient.initiateConnect(NetworkClient.java:921) ~[kafka-clients-2.1.0.jar:?]
    at org.apache.kafka.clients.NetworkClient.ready(NetworkClient.java:287) ~[kafka-clients-2.1.0.jar:?]
    at org.apache.kafka.clients.producer.internals.Sender.sendProducerData(Sender.java:335) ~[kafka-clients-2.1.0.jar:?]
    at org.apache.kafka.clients.producer.internals.Sender.run(Sender.java:308) ~[kafka-clients-2.1.0.jar:?]
    at org.apache.kafka.clients.producer.internals.Sender.run(Sender.java:233) [kafka-clients-2.1.0.jar:?]
    at java.lang.Thread.run(Thread.java:748) [?:1.8.0_201]
[ERROR] 2019-06-11 17:53:33.586 [kafka-producer-network-thread | producer-1] Sender - [Producer clientId=producer-1] Uncaught error in kafka producer I/O thread:
java.lang.IllegalStateException: No entry found for connection 2
    at org.apache.kafka.clients.ClusterConnectionStates.nodeState(ClusterConnectionStates.java:330) ~[kafka-clients-2.1.0.jar:?]
    at org.apache.kafka.clients.ClusterConnectionStates.disconnected(ClusterConnectionStates.java:134) ~[kafka-clients-2.1.0.jar:?]
    at org.apache.kafka.clients.NetworkClient.initiateConnect(NetworkClient.java:921) ~[kafka-clients-2.1.0.jar:?]
    at org.apache.kafka.clients.NetworkClient.ready(NetworkClient.java:287) ~[kafka-clients-2.1.0.jar:?]
    at org.apache.kafka.clients.producer.internals.Sender.sendProducerData(Sender.java:335) ~[kafka-clients-2.1.0.jar:?]
    at org.apache.kafka.clients.producer.internals.Sender.run(Sender.java:308) ~[kafka-clients-2.1.0.jar:?]
    at org.apache.kafka.clients.producer.internals.Sender.run(Sender.java:233) [kafka-clients-2.1.0.jar:?]
    at java.lang.Thread.run(Thread.java:748) [?:1.8.0_201]
问题分析:
根据提示可以看出是连接的问题,通过ping 和telnet都可以确定网络可以连通,那么问题出在哪里了啊?
解决:
首先上面的问题是出现在线上搭建的时候,之后我再本地实验没有任何问题,之后再线上的kafka集群内下载了logstahs,相同的配置也OK,
此时可以确认是我线上的logstash配置有问题,但是确认不到问题的位置
之后下载了kafka-client-2.1.0,在本地查看出现问题的代码位置,才确认问题;
根据上面的提示跟踪代码
代码是在 initiateConnect(NetworkClient.java:921) ~[kafka-clients-2.1.0.jar:?] 这里抛出了异常:
    private void initiateConnect(Node node, long now) {
        String nodeConnectionId = node.idString();
        try {
            this.connectionStates.connecting(nodeConnectionId, now, node.host(), clientDnsLookup);
            InetAddress address = this.connectionStates.currentAddress(nodeConnectionId);
            log.debug("Initiating connection to node {} using address {}", node, address);
            selector.connect(nodeConnectionId,
                    new InetSocketAddress(address, node.port()),
                    this.socketSendBuffer,
                    this.socketReceiveBuffer);
        } catch (IOException e) {
            /* attempt failed, we'll try again after the backoff */
            connectionStates.disconnected(nodeConnectionId, now);
            /* maybe the problem is our metadata, update it */
            metadataUpdater.requestUpdate();
            log.warn("Error connecting to node {}", node, e);
        }
    }
进入selector.connect()方法中可以看到,根据注释很快就确定了原因:
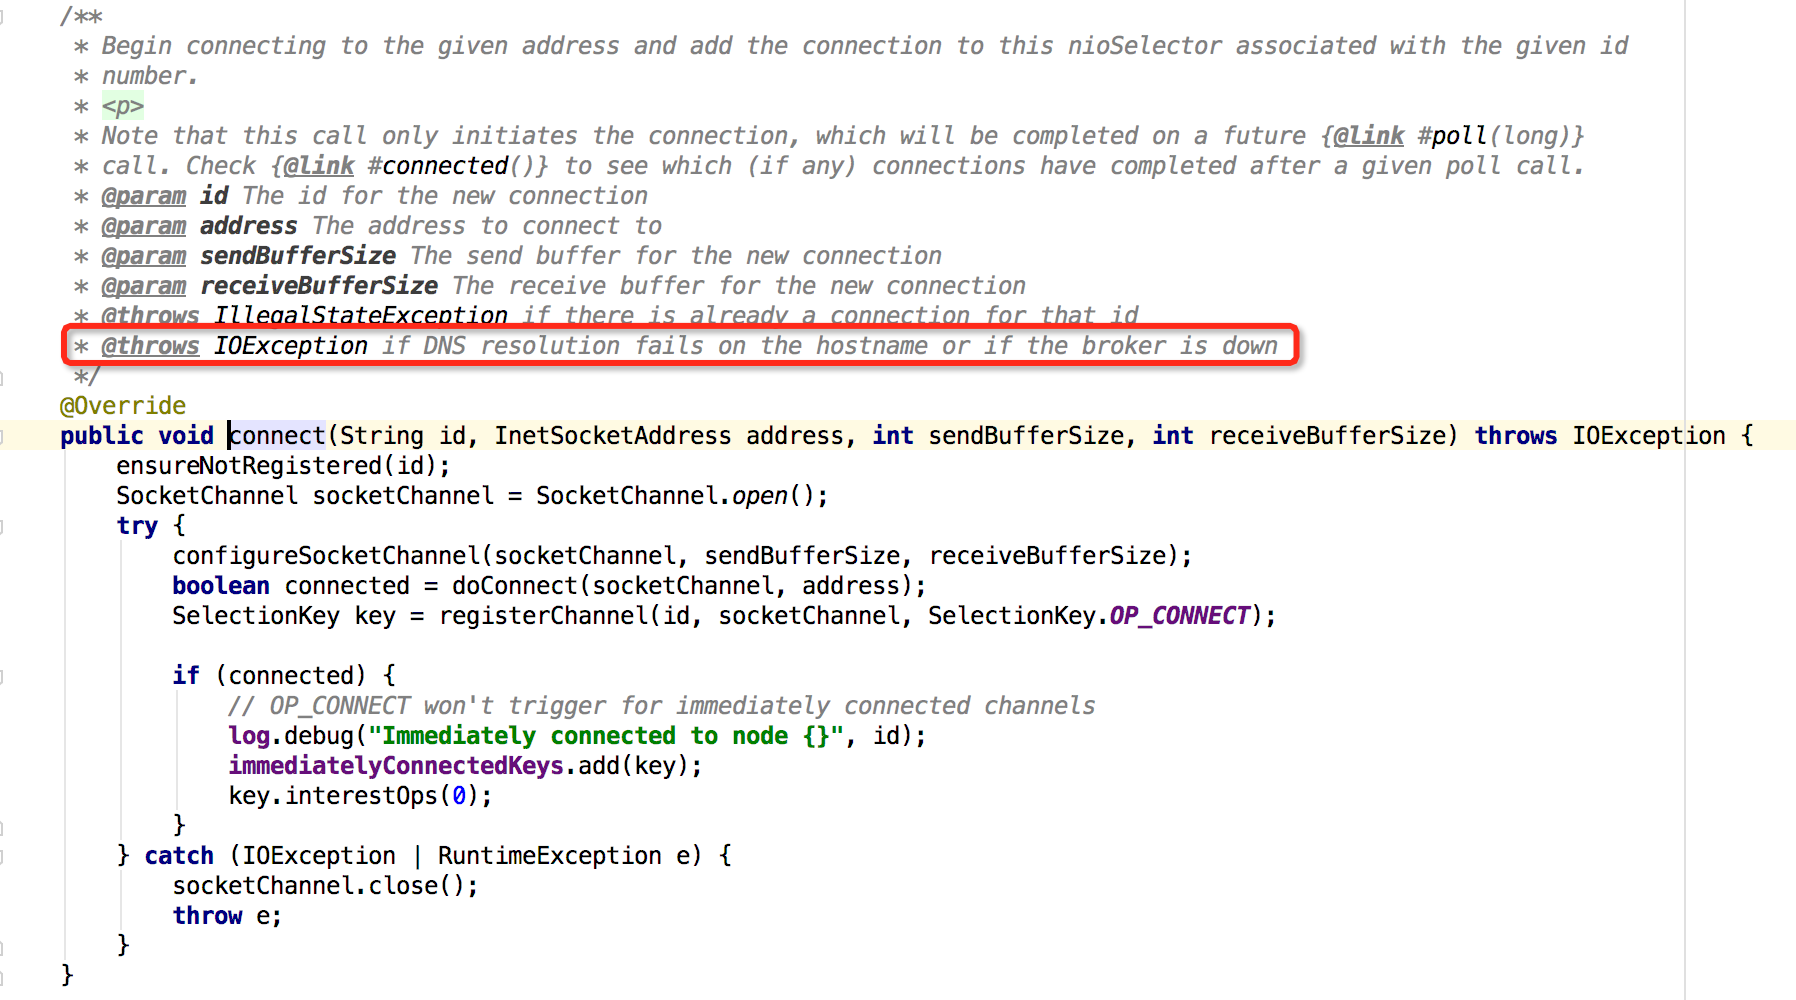
从图中的位置可以看到如果DNS在hostname解析失败,或者broker down掉,那么就会抛出这个异常,但是我的集群肯定没问题,那么就是DNS的问题,此时联想我本地的集群和线上的kafka集群都是由于都是集群都配置各自的/etc/hosts,但是线上logstash的机器在其他区域下,因此如果kafka的Producer通过dns解析本地路由然后和kafka集群通信的时候,如果本地解析不到就会报错,
Producer通过一个线程在一直跑,因为上面的错误日志是永远打印不完的,
因此解决的方法就是:
配置/etc/hosts;里面的内容是kafka集群的各个hostname和ip的对应关系,配置完成,重新启动logstash,运行正常。
总结:
在此疑惑的一点是,我明明配置了 bootstrap_servers => "192.168.183.195:9092,192.168.183.194:9092,192.168.183.196:9092" 那为什么还是dns解析不到地址,还是说producer在发型消息的时候没有使用我的配置?
为了进一步确认问题,我自己在本地跟踪和代码:
首先在Producer通过new KafkaProducer<>(props)方式创建的时候,会创建一个KafkaProducer实例,同时会newSender,Sender implements Runnable,之后会启动一个线程会在后台运行,将消息发送给kafka集群
因此主要看Sender的run方法就行,跟踪run方法有一个方法是sendProducerData(now);这个是发送数据,还有一个是client.poll(pollTimeout, now) 主要看这俩个方法就OK,
 1  private long sendProducerData(long now) {
 2         Cluster cluster = metadata.fetch();
 3         // get the list of partitions with data ready to send
 4         RecordAccumulator.ReadyCheckResult result = this.accumulator.ready(cluster, now);
 5
 6         // if there are any partitions whose leaders are not known yet, force metadata update
 7         if (!result.unknownLeaderTopics.isEmpty()) {
 8             // The set of topics with unknown leader contains topics with leader election pending as well as
 9             // topics which may have expired. Add the topic again to metadata to ensure it is included
10             // and request metadata update, since there are messages to send to the topic.
11             for (String topic : result.unknownLeaderTopics)
12                 this.metadata.add(topic);
13
14             log.debug("Requesting metadata update due to unknown leader topics from the batched records: {}",
15                 result.unknownLeaderTopics);
16             this.metadata.requestUpdate();
17         }
18
19         // remove any nodes we aren't ready to send to
20         Iterator<Node> iter = result.readyNodes.iterator();
21         long notReadyTimeout = Long.MAX_VALUE;
22         while (iter.hasNext()) {
23             Node node = iter.next();
24             if (!this.client.ready(node, now)) {
25                 iter.remove();
26                 notReadyTimeout = Math.min(notReadyTimeout, this.client.pollDelayMs(node, now));
27             }
28         }
29
30         // create produce requests
31         Map<Integer, List<ProducerBatch>> batches = this.accumulator.drain(cluster, result.readyNodes, this.maxRequestSize, now);
32         addToInflightBatches(batches);
33         if (guaranteeMessageOrder) {
34             // Mute all the partitions drained
35             for (List<ProducerBatch> batchList : batches.values()) {
36                 for (ProducerBatch batch : batchList)
37                     this.accumulator.mutePartition(batch.topicPartition);
38             }
39         }
40
41         accumulator.resetNextBatchExpiryTime();
42         List<ProducerBatch> expiredInflightBatches = getExpiredInflightBatches(now);
43         List<ProducerBatch> expiredBatches = this.accumulator.expiredBatches(now);
44         expiredBatches.addAll(expiredInflightBatches);
45
46         // Reset the producer id if an expired batch has previously been sent to the broker. Also update the metrics
47         // for expired batches. see the documentation of @TransactionState.resetProducerId to understand why
48         // we need to reset the producer id here.
49         if (!expiredBatches.isEmpty())
50             log.trace("Expired {} batches in accumulator", expiredBatches.size());
51         for (ProducerBatch expiredBatch : expiredBatches) {
52             String errorMessage = "Expiring " + expiredBatch.recordCount + " record(s) for " + expiredBatch.topicPartition
53                 + ":" + (now - expiredBatch.createdMs) + " ms has passed since batch creation";
54             failBatch(expiredBatch, -1, NO_TIMESTAMP, new TimeoutException(errorMessage), false);
55             if (transactionManager != null && expiredBatch.inRetry()) {
56                 // This ensures that no new batches are drained until the current in flight batches are fully resolved.
57                 transactionManager.markSequenceUnresolved(expiredBatch.topicPartition);
58             }
59         }
60         sensors.updateProduceRequestMetrics(batches);
61
62         // If we have any nodes that are ready to send + have sendable data, poll with 0 timeout so this can immediately
63         // loop and try sending more data. Otherwise, the timeout will be the smaller value between next batch expiry
64         // time, and the delay time for checking data availability. Note that the nodes may have data that isn't yet
65         // sendable due to lingering, backing off, etc. This specifically does not include nodes with sendable data
66         // that aren't ready to send since they would cause busy looping.
67         long pollTimeout = Math.min(result.nextReadyCheckDelayMs, notReadyTimeout);
68         pollTimeout = Math.min(pollTimeout, this.accumulator.nextExpiryTimeMs() - now);
69         pollTimeout = Math.max(pollTimeout, 0);
70         if (!result.readyNodes.isEmpty()) {
71             log.trace("Nodes with data ready to send: {}", result.readyNodes);
72             // if some partitions are already ready to be sent, the select time would be 0;
73             // otherwise if some partition already has some data accumulated but not ready yet,
74             // the select time will be the time difference between now and its linger expiry time;
75             // otherwise the select time will be the time difference between now and the metadata expiry time;
76             pollTimeout = 0;
77         }
78         sendProduceRequests(batches, now);
79         return pollTimeout;
80     }
public List<ClientResponse> poll(long timeout, long now) {
        ensureActive();

        if (!abortedSends.isEmpty()) {
            // If there are aborted sends because of unsupported version exceptions or disconnects,
            // handle them immediately without waiting for Selector#poll.
            List<ClientResponse> responses = new ArrayList<>();
            handleAbortedSends(responses);
            completeResponses(responses);
            return responses;
        }

        long metadataTimeout = metadataUpdater.maybeUpdate(now);
        try {
            this.selector.poll(Utils.min(timeout, metadataTimeout, defaultRequestTimeoutMs));
        } catch (IOException e) {
            log.error("Unexpected error during I/O", e);
        }

        // process completed actions
        long updatedNow = this.time.milliseconds();
        List<ClientResponse> responses = new ArrayList<>();
        handleCompletedSends(responses, updatedNow);
        handleCompletedReceives(responses, updatedNow);
        handleDisconnections(responses, updatedNow);
        handleConnections();
        handleInitiateApiVersionRequests(updatedNow);
        handleTimedOutRequests(responses, updatedNow);
        completeResponses(responses);

        return responses;
    }
从上面代码看poll方法里面会更新一次kafka的元数据,在更新完成之后,元数据里面的node信息,就不在是自己配置的bootstrap_servers ,而是集群node的信息,此时,再去运行sendProducerData的方法的时候在这个方法的24行,进入ready方法,之后执行initiateConnect方法,也就是最开始出现问题的方法,在这里的node信息是集群里面的leader信息,sender发送信息也只会和leader进行交流,此时会根据配置的hostname解析ip,如果运行producer的机器没有配置,那就会出现上面的问题
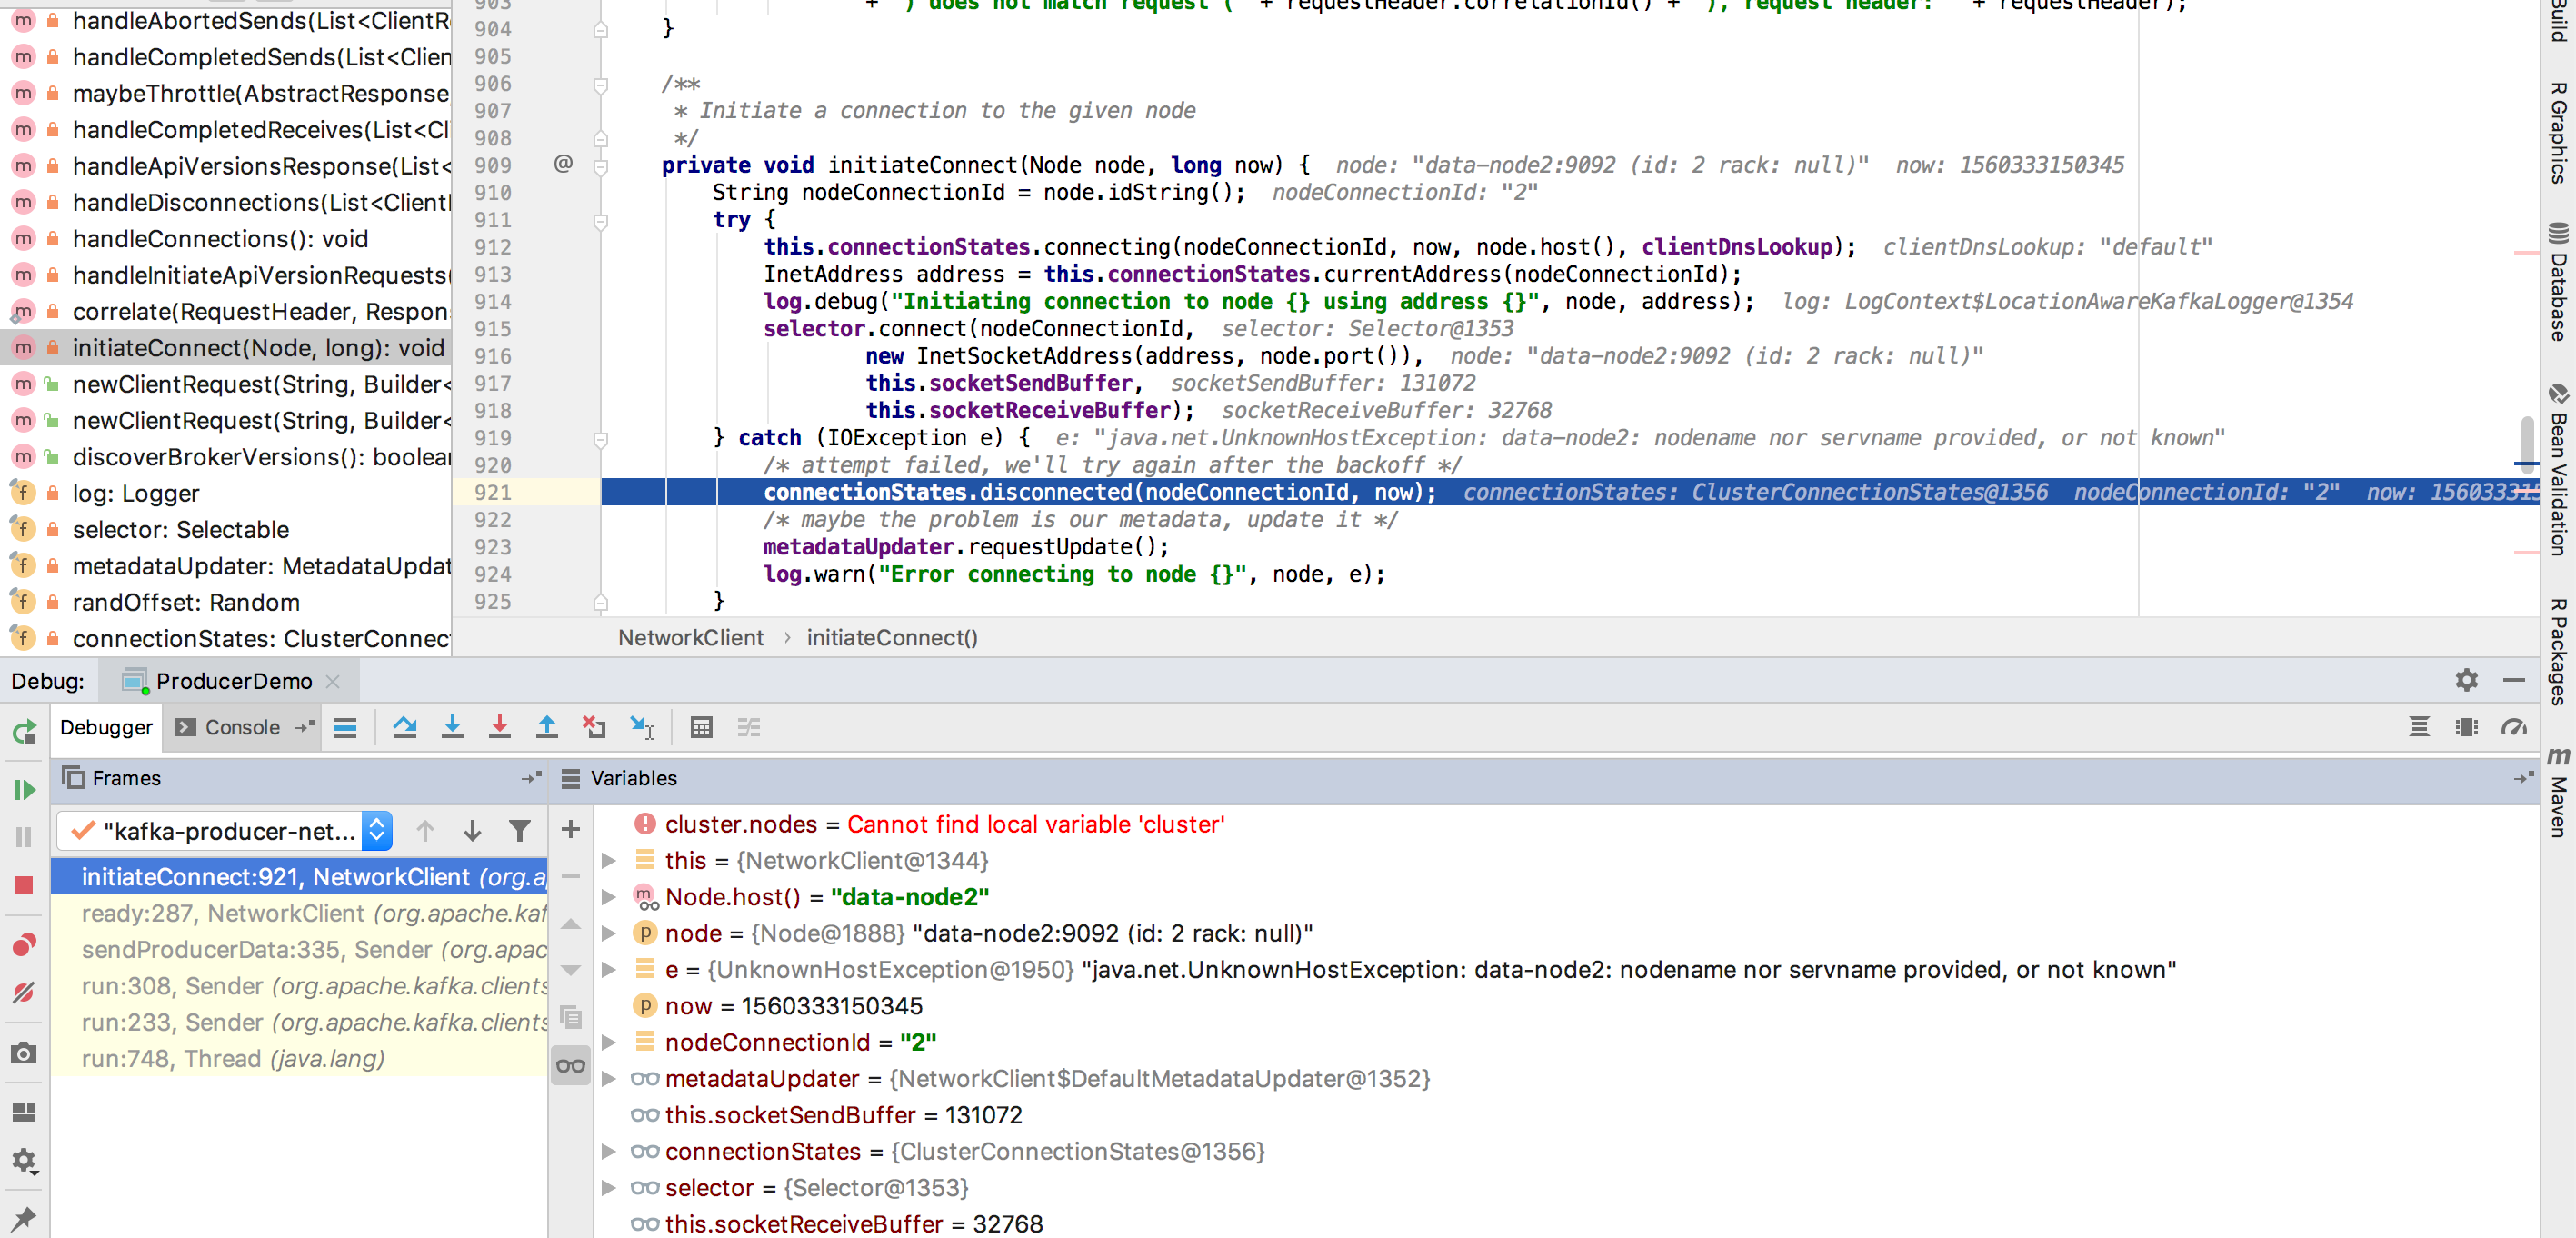
从上面的debug截图可以看出来,node确实从kafka集群同步的node信息,由于kafka集群对外的都是leader,所以producer不会使用配置的bootstrap_servers,而是通过它发现集群的信息,然后根据集群的信息,来确定和哪个node通信。其实producer和sender的创建很复杂,这里之后捡了和这个问题相关的说了,有兴趣的同学可以跟一根源码,会很有收获哟
问题到这里就解决了,究其原因还是因为配置的问题导致的,但是经过这个问题,查看kafka client的代码,对kafka的理解更深了一步。算是因祸得福吧《^_^》

 浙公网安备 33010602011771号