
Echart 改变X轴、Y轴、折线的颜色和数值
在操作E-chart时需要根据需求改变颜色和属性
图1:
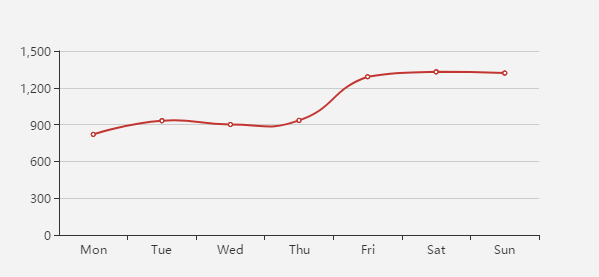
option = {
xAxis: {
type: 'category',
data: ['Mon', 'Tue', 'Wed', 'Thu', 'Fri', 'Sat', 'Sun']
},
yAxis: {
type: 'value'
},
series: [{
data: [820, 932, 901, 934, 1290, 1330, 1320],
type: 'line',
smooth: true
}]
};
图2:
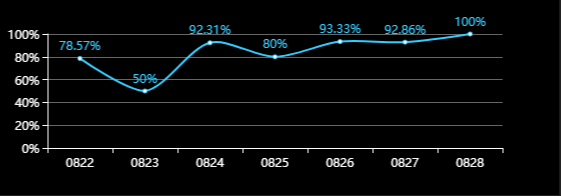
解决方案:
 option = {
              //标题
            title: {
                text: title,
                //标题样式
                textStyle: {
                    fontWeight: 'normal',
                    color: '#fff',
                },
                //top: 20,
            },
            xAxis: {
                type: 'category',
                //x轴字体颜色
                axisLine: {
                    lineStyle: {
                        color: '#fff'
                    }
                },
                data: ['0822','0823','0824','0826','0827','0828']
            },
            yAxis: {
                type: 'value',
                //y轴颜色
                axisLine: {
                    lineStyle: {
                        color: '#fff'
                    }
                },
                //y轴设置为百分比
                axisLabel: {
                    formatter: '{value}%',
                },
                //坐标轴内线的样式
                splitLine: {
                    lineStyle: {
                        color: '#666',
                        //type:'dashed'虚线
                    }
                }
            },
            series: [{
                //折线上数字
                label: {
                    normal: {
                        show: true,
                        position: 'top',
                        formatter:'{c}%'
                    }
                },
                // 折线颜色
                itemStyle: {
                    normal: {
                        color: '#33CCFF',
                        lineStyle: {
                            color: '#33CCFF'
                        }
                    }
                },
                data:['78.57','50','80','93.33','92.86','100'],
                type: 'line',
                smooth: true
            }]
        };
        ;
        if (option && typeof option === "object") {
            myChart.setOption(option, true);
        }
    }
E-chart 点击事件
myChart.on('click', function (params) {
});

 浙公网安备 33010602011771号