Prometheus学习笔记

1:概述
Prometheus是一个监控系统和时序数据库,主要适合于云原生环境,它具有多维数据模型和强大的查询语言,并在一个生态系统中集成了检测,指标收集,服务发现和报警的功能。
2:什么是Prometheus
Prometheus是一个基于指标监控和报警的工具栈,Prometheus起源于SoundCloud,因为微服务的迅速发展,导致容器等实例数量以几何倍数增加,必须考虑设计一个符合以下几个功能的监控系统

1:多维度数据模型:可以按照实例,服务,端点和方法之类的维度随意对数据进行切片和切换
2:操作简单:可以随时随地的部署监控服务,甚至在本地部署,而且无需设置分布式存储后端或重新配置环境
3:可扩展的收集数据和分散架构,以便于可以可靠的监控服务的许多实例,独立的团队可以部署独立的监控服务
4:一种查询语言,可以利用数据模型进行有效的报警和图形展示

但是当前情况是,以上功能都分散在各个系统之中,直到2012年的SoundCloud启动了一个孵化项目把以上这些功能全部聚合到了一起,也就是我们现在所看到的Prometheus,Prometheus是用Go语言编写的,从一开始就是开源的,到2016年Prometheus成为继Kubernetes之后的CNCF的第二位成员。

到现在为止,Prometheus提供的工具或其他的生态系统组件集成可以提供完整的监控通道

1:检测(跟踪及暴露指标)
2:指标收集
3:指标存储
4:查询指标,用于报警,仪表盘等


Prometheus具有足够的通用性,可以监控各个级别的实例,自己的程序,第三方服务,主机,网络设备等,此外Prometheus主要还是特别适用于监控动态云环境和Kubernetes云原生环境

但是我们要注意的是Prometheus并不是万能的,目前还没有解决的问题也有很多,

1:日志和追踪(Prometheus只能处理指标,也成为时间序列)
2:基于机器学习或AI的异常检测
3:水平扩展,集群化存储(这个目前已经有了 Thanos)

这些功能当然也是非常的有价值的,但是Prometheus本身并无法去解决,而是留给了开发者们更多机会去创造
但是整体来讲与其他监控方案相比,Prometheus提供了许多的重要功能:

1:多维度数据模型,允许对指标进行跟踪
2:强大的查询语言(PromQL)
3:时间序列处理和报警的整合
4:与服务发现集成来确定需监控的内容
5:操作简单
6:执行高效

尽管这些功能中的许多功能如今在监控系统中变得越来越普遍,但Prometheus是第一个将这些功能集合在一起的开源的解决方案
3:操作简单
Prometheus的整个概念很简单并且操作也非常的简单,Prometheus是Go语言编写。所以可以直接引用二进制文件,并且无需任何依赖,外部运行时(例如java中的JVM),解释器(比如Python或者Ruby)或者共享系统库
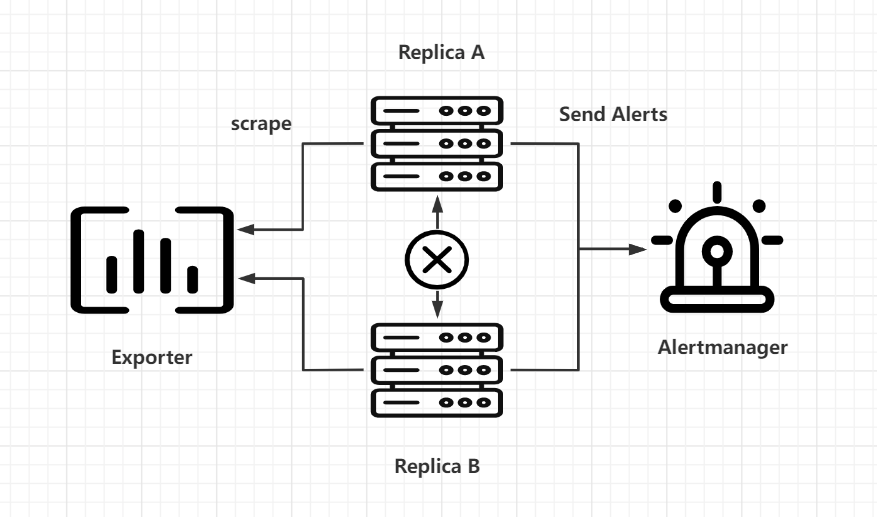
每个Prometheus服务器都独立于其他任何Prometheus服务器收集数据并评估报警规则,并且仅在本地存储数据,而且没有严格的集群或副本
要创建用于报警的高可用性配置,你仍然可以运行两个配置相同的Prometheus服务器,以计算相同的报警(AlterManager将对通知进行去重操作)
当然了Prometheus大规模部署还是比较复杂的,这个后面再说,此外Prometheus还暴露了一些接口允许第三方开发者来解决一些问题,比如远程存储。
4:性能高效
Prometheus需要能够同时从许多的系统和服务中收集详细的指标数据,为此,特别对以下组件做了高度优化

1:抓取和解析传入的指标
2:写入和读取时序数据库
3:评估基于TSDB数据和PromQL的表达式

根据社区的使用经验显示,一台大型的Prometheus服务器每秒可提取100万个时间序列样本,并使用1-2个字节来将每个样本存储在磁盘上
5:系统架构
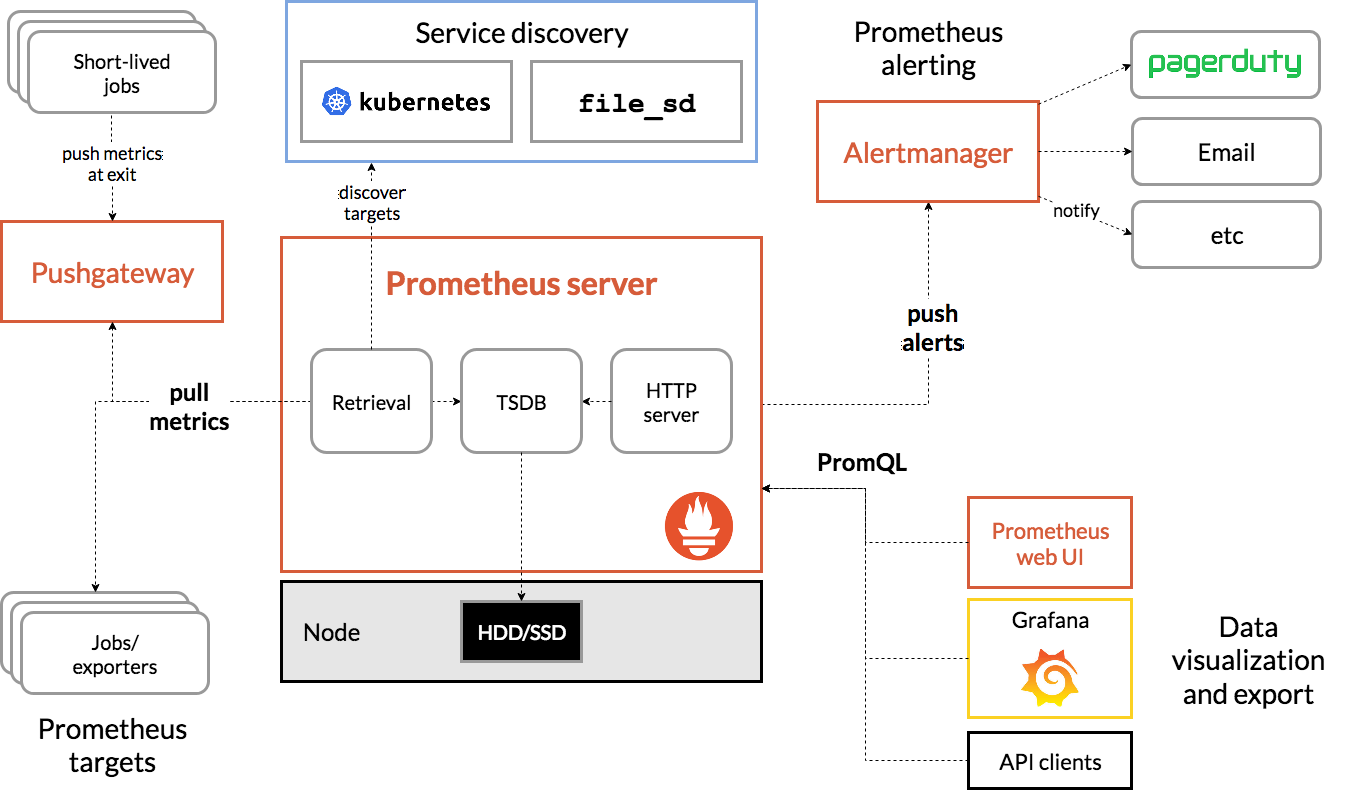
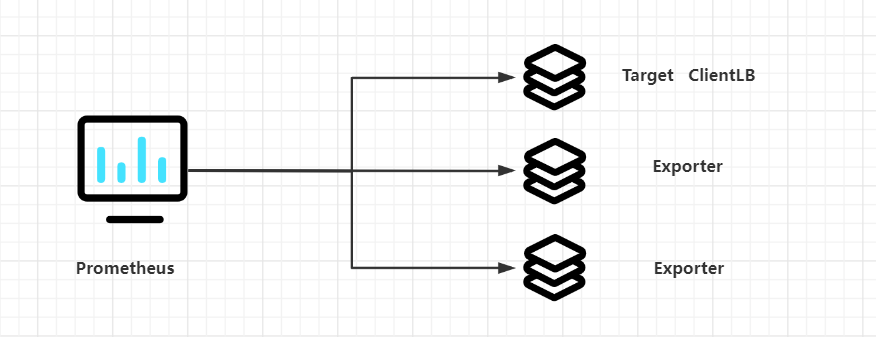
此架构图来源于官网
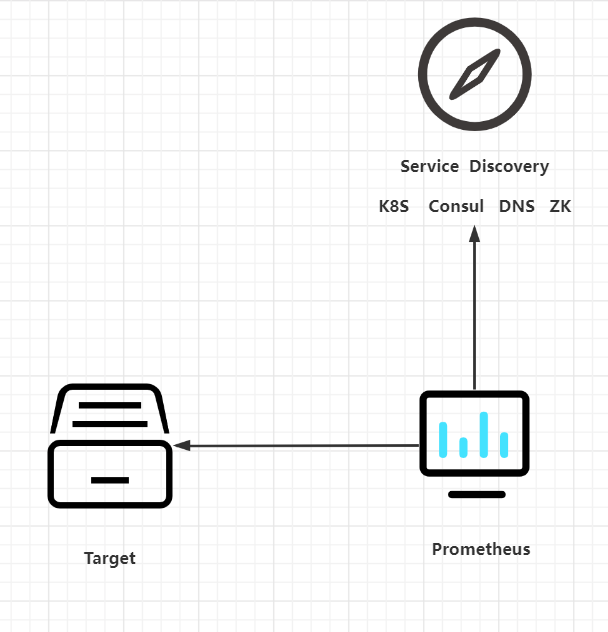
一个团队通常会运行一个或多个Prometheus服务器,这些服务器构成了Prometheus的核心,Prometheus服务器可以配置为使用服务发现机制(如:DNS,Consul,Kuberneets)来自动发现一组指标源(也就是Target),然后Prometheus通过HTTP定期从这些目标中以文本格式抓取指标,并将收集到的数据存储在本地的时序数据库内

抓取的目标可以是一个直接暴露Prometheus指标的应用程序,也可以是一个现有的系统比如(MySQL)的metrics指标转换为Prometheus指标标准格式的中间应用(mysql exporter),然后Prometheus服务器通过其内置的WebUI或仪表盘工具(Grafana)或者其他HTTP API来提供收集到的数据进行查询

# 注:每次抓取只会将目标数据的每个时间序列的当前值传递给Prometheus,所以抓取间隔决定了存储数据的最终采样频率,目标进程本身不保留任何历史指标数据。

另外我们还可以配置Prometheus根据收集的指标数据生成报警,但是Prometheus不会直接把报警数据通知发给我们,而是将原始报警发送到Prometheus AlertManager服务,Alertmanager是作为单独的服务运行的,可以从多个Prometheus服务器上接收告警,并可以对这些报警进行分组,汇总和路由,最后通过Email,Slack,企业微信,WebHook,PagerDuty或者其他服务来通知我们。
6:数据模型
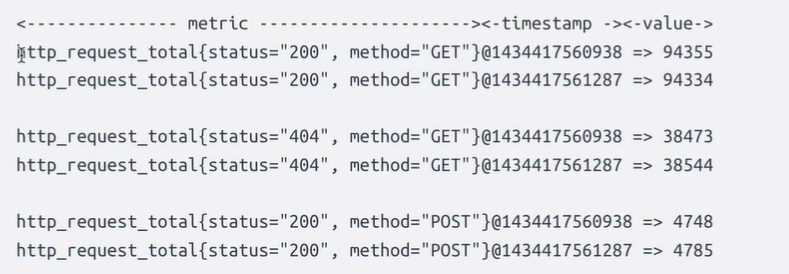
Prometheus采集的监控数据都是以指标(metric)的形式存储在内置的TSDB数据库中,这些数据都是时间序列,一个带时间戳的数据,这些数据具有标识符和一组样本值,除了存储的时间序列,Prometheus还可以根据查询请求产生临时的,衍生的时间序列作为返回结果。
6.1:时间序列
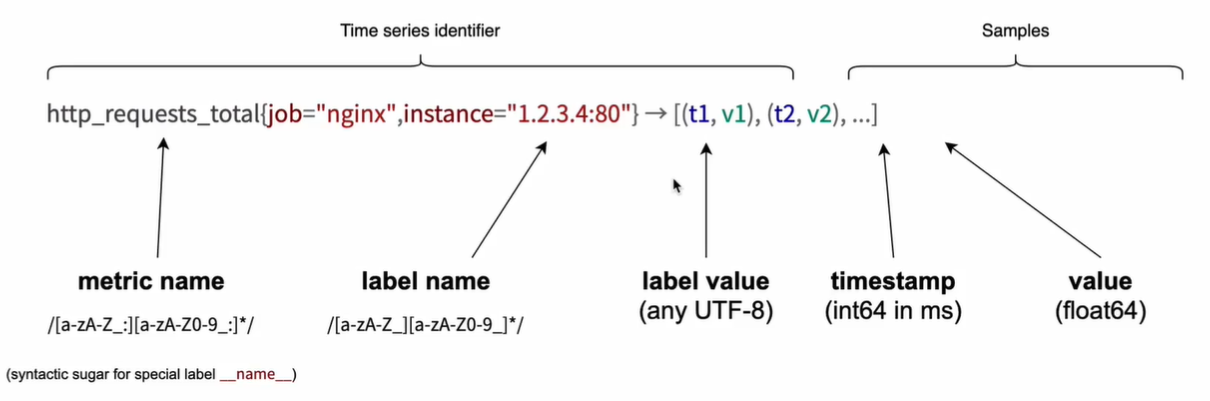
Prometheus会将所有采集到的样本数据以时间序列的形式保存在内存数据库中,并定时刷新到硬盘上,时间序列是按照时间戳和值的序列方式存放的,我们可以称之为向量(vector),每一条时间序列都由一个指标名称和一组标签(键值对)来唯一标识
1:指标名称反映了被监控样本的意含义(如:http_request_total)表示的是对应服务器处理的HTTP请求总和
2:标签可以用来区分不同的维度,(比如:method="GET"与method="POST"就可区分两种不同的HTTP请求指标数据)

# 样本如下
http_request_total(method="GET",status="200")
http_request_total(method="POST",status="500")

需要注意的是指标名只能由ASCII字符,数字,下划线以及冒号组成,同时必须匹配正则表达式,[a-zA-Z_:][a-zA-Z0-9_:]*(冒号不能用于定义指标名,是用来表示用户自定义的记录规则)。标签的名称只能由ASCII字符,数字以及下划线组成,并且满足正则表达式[a-zA-Z_:][a-zA-Z0-9_:]*,其中以_作为前缀的标签,是系统保留的关键字,只能在系统内部使用,标签的值则可以包含任何Unicode编码的字符。
6.2:样本
时间序列中的每一个点都称之为样本(sample),样本由以下三部分组成

1:指标:指标名和描述当前样本特征的标签集
2:时间戳:精确到毫秒的时间戳数
3:样本值:一个float64的数字
6.3:指标
想要暴露Prometheus的指标服务只需要暴露一个HTTP端点,并提供Prometheus基于文本格式的指标数据即可,这种指标格式是非常的友好的,基本上的格式看起来类似于下面的代码:

# HELP http_requests_total The total nunber of processed HTTP requests.
# TYPE http_requests_total counter
http_requests_total{status="200"} 14
http_requests_total{status="404"} 2
http_requests_total{status="500"] 0

其中"#"开头的是注释信息,用于描述下面指标的含义,其他未注释行代表一个样本,(带指标名,标签和样本值),使其非常容易的从系统和服务中暴露指标出来。

事实上所有的指标也都是通过如下所示的格式来标识的:
<metric name>{<label name>=<lable value>,...}

例如:指标名称就是:http_requests_total,标签集就是:method="POST",endpoint="/api",那么我们可以用下面的方式来标识这个指标
http_requests_total{method="POST",endpoint="/api"}

而事实上Prometheus的底层实现中指标名称实际是以__name__=<metric name>的形式保存在数据库中的,所以上面的指标也等同于下面这个:
{__name__="http_requests_total", method="POST", endpoint="/api"}

所以也可以认为一个指标就是一个标签集,只不过这个标签集一定包含一个 __name__的标签来定义这个指标的名称。
6.4:存储格式
Prometheus按照两个小时为一个时间窗口,将两个小时内产生的数据存储在一个块(block)中,每个块都是一个单独的目录,里面包含该时间窗口内的所有样本数据(chunks),元数据文件(meta.json),以及索引文件(index)。

其他索引文件会将标签名称和标签索引到样本数据的时间序列中,如果这期间通过API删除时间序列,数据记录会保存在单独的逻辑文件tombstone当中

当前样本数据所在的块会被直接保存在内存数据库中,不会持久化到磁盘中,为了确保Prometheus发生崩溃或者重启时能够恢复数据,Prometheus启动时会通过预写日志(write-ahead-log(WAL))来重新播放记录,从而恢复数据,预写日志文件保存在wal目录中,wal我呢见包括还没有被压缩的原始数据,所以它会比原始的块文件大得多。
7:安装和配置
| CentOS 7.9 | 2C2G | 10.0.0.10 | Prometheus |
|---|---|---|---|
| CentOS 7.9 | 2C2G | 10.0.0.11 | Node_exporter |
7.1:部署配置Prometheus
前面我们提到了Prometheus是用Go写的,直接使用独立的二进制文件即可部署,接下来我们就下载一下Prometheus的包
1:配置主机名
[root@10.0.0.10 ~]# hostnamectl set-hostname prometheus
[root@10.0.0.11 ~]# hostnamectl set-hostname exporter
2:下载Prometheus
# 官网:https://prometheus.io/download/
# 下载适用于Linux的版本,我这里用的时2.36.2版,我们下载一下(这里可能需要用到一点魔法)
[root@prometheus ~]# wget https://github.com/prometheus/prometheus/releases/download/v2.36.2/prometheus-2.36.2.linux-amd64.tar.gz
[root@prometheus ~]# ls
anaconda-ks.cfg prometheus-2.36.2.linux-amd64.tar.gz
[root@prometheus ~]# tar xf prometheus-2.36.2.linux-amd64.tar.gz
[root@prometheus ~]# ls
anaconda-ks.cfg prometheus-2.36.2.linux-amd64 prometheus-2.36.2.linux-amd64.tar.gz
[root@prometheus ~]# mv prometheus-2.36.2.linux-amd64 /usr/local/prometheus
[root@prometheus ~]# cd /usr/local/prometheus/
[root@prometheus prometheus]# ls
console_libraries consoles LICENSE NOTICE prometheus prometheus.yml promtool
# 解释:
1:prometheus:这是一个二进制文件,主要用于启动Prometheus的程序,它是我们的核心程序
2:prometheus.yml:这个是Prometheus的配置文件,主要用于存储一些Prometheus的相关配置
3:promtool:用于检查Prometheus的配置等操作
我们前面也说了,Prometheus是不依赖任何的外部Runtime的,可以直接运行二进制文件
# 接下来直接启动Prometheus,它默认会直接去引用prometheus.yml这个配置文件的
[root@prometheus prometheus]# ./prometheus
ts=2022-07-12T09:08:29.408Z caller=main.go:491 level=info msg="No time or size retention was set so using the default time retention" duration=15d
ts=2022-07-12T09:08:29.408Z caller=main.go:535 level=info msg="Starting Prometheus Server" mode=server version="(version=2.36.2, branch=HEAD, revision=d7e7b8e04b5ecdc1dd153534ba376a622b72741b)"
ts=2022-07-12T09:08:29.408Z caller=main.go:540 level=info build_context="(go=go1.18.3, user=root@f051ce0d6050, date=20220620-13:21:35)"
ts=2022-07-12T09:08:29.408Z caller=main.go:541 level=info host_details="(Linux 3.10.0-1160.el7.x86_64 #1 SMP Mon Oct 19 16:18:59 UTC 2020 x86_64 prometheus (none))"
ts=2022-07-12T09:08:29.408Z caller=main.go:542 level=info fd_limits="(soft=1024, hard=4096)"
ts=2022-07-12T09:08:29.408Z caller=main.go:543 level=info vm_limits="(soft=unlimited, hard=unlimited)"
ts=2022-07-12T09:08:29.409Z caller=web.go:553 level=info component=web msg="Start listening for connections" address=0.0.0.0:9090
ts=2022-07-12T09:08:29.409Z caller=main.go:972 level=info msg="Starting TSDB ..."
ts=2022-07-12T09:08:29.414Z caller=head.go:493 level=info component=tsdb msg="Replaying on-disk memory mappable chunks if any"
ts=2022-07-12T09:08:29.414Z caller=head.go:536 level=info component=tsdb msg="On-disk memory mappable chunks replay completed" duration=5.857碌s
ts=2022-07-12T09:08:29.414Z caller=head.go:542 level=info component=tsdb msg="Replaying WAL, this may take a while"
ts=2022-07-12T09:08:29.416Z caller=tls_config.go:195 level=info component=web msg="TLS is disabled." http2=false
ts=2022-07-12T09:08:29.416Z caller=head.go:613 level=info component=tsdb msg="WAL segment loaded" segment=0 maxSegment=0
ts=2022-07-12T09:08:29.416Z caller=head.go:619 level=info component=tsdb msg="WAL replay completed" checkpoint_replay_duration=19.811碌s wal_replay_duration=1.776391ms total_replay_duration=1.859038ms
ts=2022-07-12T09:08:29.417Z caller=main.go:993 level=info fs_type=XFS_SUPER_MAGIC
ts=2022-07-12T09:08:29.417Z caller=main.go:996 level=info msg="TSDB started"
ts=2022-07-12T09:08:29.417Z caller=main.go:1177 level=info msg="Loading configuration file" filename=prometheus.yml
ts=2022-07-12T09:08:29.452Z caller=main.go:1214 level=info msg="Completed loading of configuration file" filename=prometheus.yml totalDuration=34.064697ms db_storage=1.236碌s remote_storage=3.169碌s web_handler=650ns query_engine=1.197碌s scrape=33.78762ms scrape_sd=27.84碌s notify=22.785碌s notify_sd=6.892碌s rules=3.846碌s tracing=14.134碌s
ts=2022-07-12T09:08:29.452Z caller=main.go:957 level=info msg="Server is ready to receive web requests."
ts=2022-07-12T09:08:29.452Z caller=manager.go:937 level=info component="rule manager" msg="Starting rule manager..."
# 仔细看
ts=2022-07-12T09:08:29.417Z caller=main.go:1177 level=info msg="Loading configuration file" filename=prometheus.yml
它告诉我们说它加载了一个配置文件叫:prometheus.yml
# 查看Prometheus支持什么命令,太多我就不贴了。
[root@prometheus prometheus]# ./prometheus -h
1:--config.file=<config name> # 配置文件不是prometheus.yaml的时候可以使用此配置指定
2:--web.listen-address="<ip:port>" # prometheus的webUI监听的IP和端口
3:--storage.tsdb.path="<path>" # TSDB的存储路径
4:--storage.tsdb.retention.time # TSDB默认的存储时间、
5:--storage.tsdb.retention.size # TSDB默认存储大小
# Prometheus默认监听的是9090端口
[root@prometheus ~]# netstat -nplt | grep prometheus
tcp6 0 0 :::9090 :::* LISTEN 1312/./prometheus
# Prometheus.yaml解释
# global为全局配置
global:
scrape_interval: 15s # 抓取频率默认为15秒
evaluation_interval: 15s # 抓取后的评估频率默认也为15秒
# scrape_timeout is set to the global default (10s).
# 抓取目标的超时时间是没有配置的但是默认是10秒,如果要配置的话 scrape_timeout: 30s
# Alertmanager configuration
# 报警相关配置
alerting:
alertmanagers:
- static_configs:
- targets:
# - alertmanager:9093
# Load rules once and periodically evaluate them according to the global 'evaluation_interval'.
# 报警规则相关的配置
rule_files:
# - "first_rules.yml"
# - "second_rules.yml"
# A scrape configuration containing exactly one endpoint to scrape:
# Here it's Prometheus itself.
# 主要配置如下。主要配置Prometheus去抓取的目标
scrape_configs:
# The job name is added as a label `job=<job_name>` to any timeseries scraped from this config.
- job_name: "prometheus"
# 定义任务名称
# metrics_path defaults to '/metrics'
# 提供指标的路径地址:如果不是默认的则需要配置:metrics_path: '<path>'
# scheme defaults to 'http'.
# 默认为http需要配置https则需要重新指定配置:scheme:https
static_configs:
# 静态配配置文件
- targets: ["localhost:9090"]
# 这里指定配置目标的端点
# 我们今天主要看正常的监控,不涉及告警,那么我们就优化一下配置文件,只用今天的
[root@prometheus prometheus]# cat prometheus.yml
global:
scrape_interval: 15s # 也可以配置在scrape_configs内
evaluation_interval: 15s
scrape_configs:
- job_name: "prometheus"
static_configs:
- targets: ["localhost:9090"]
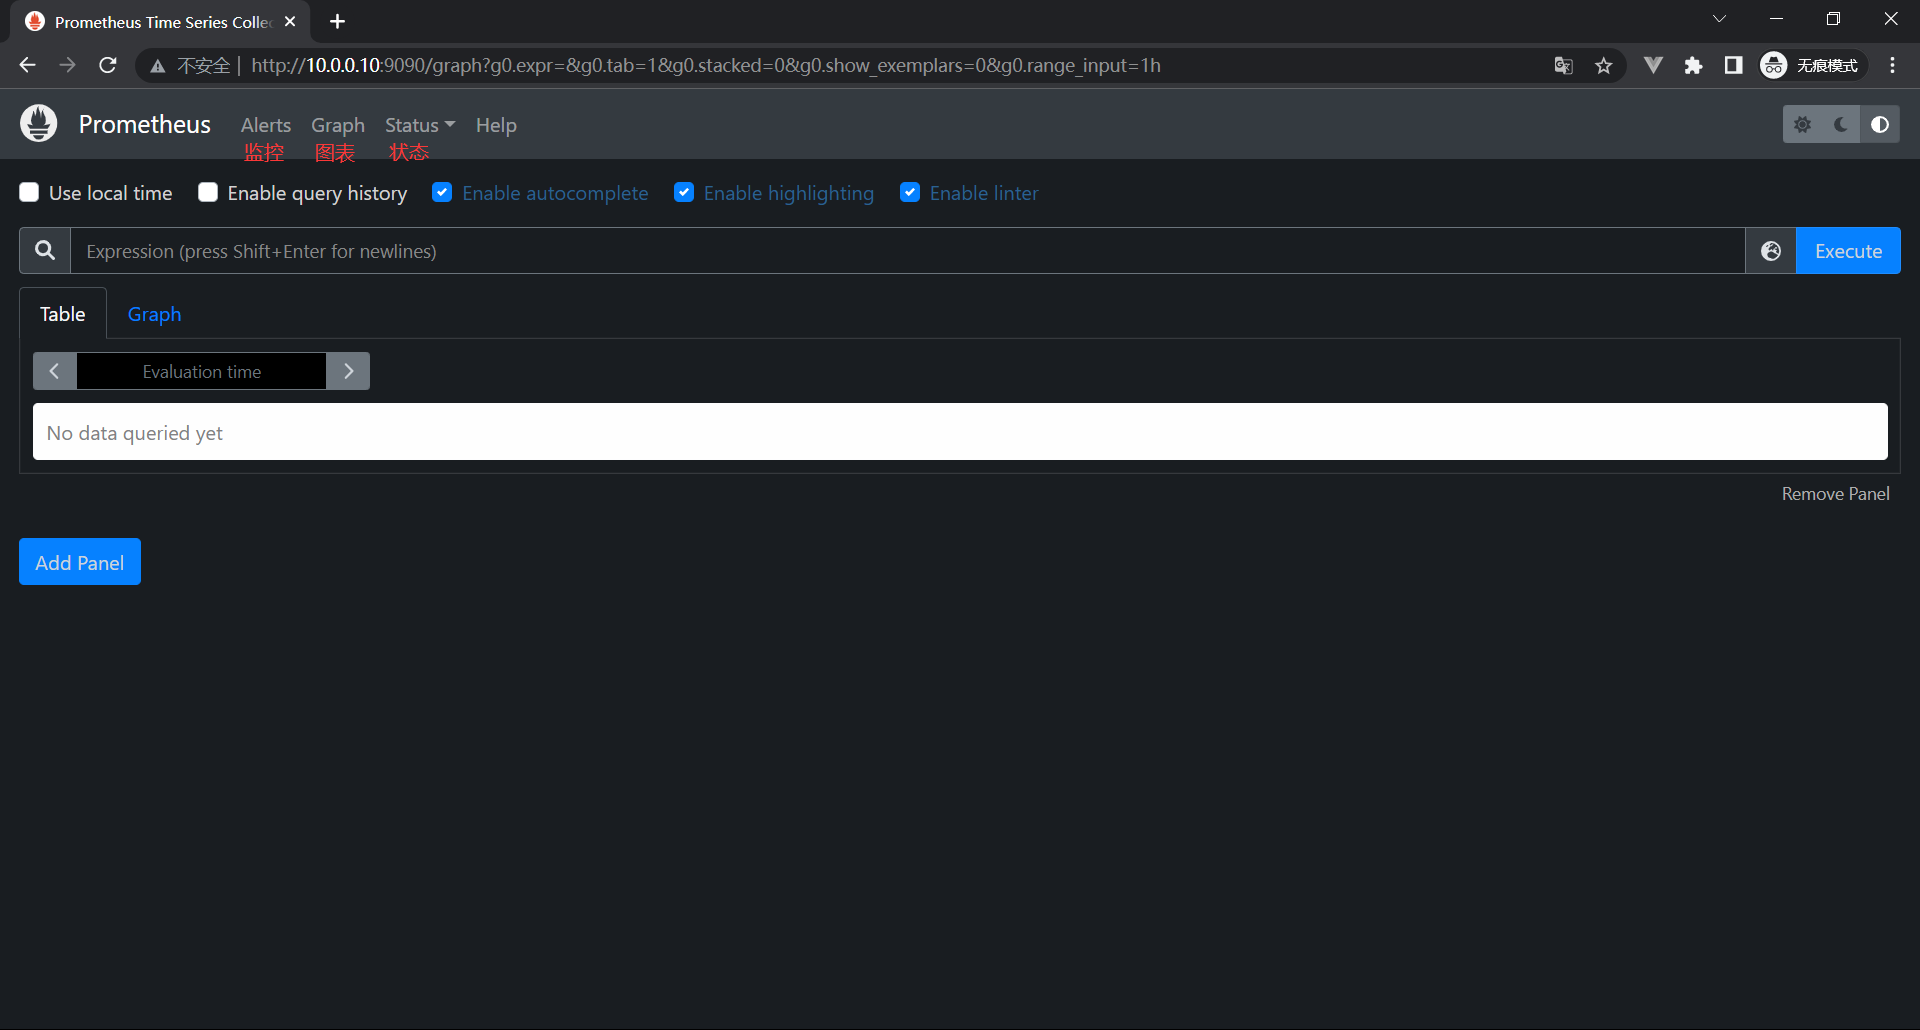
# 启动prometheus并访问
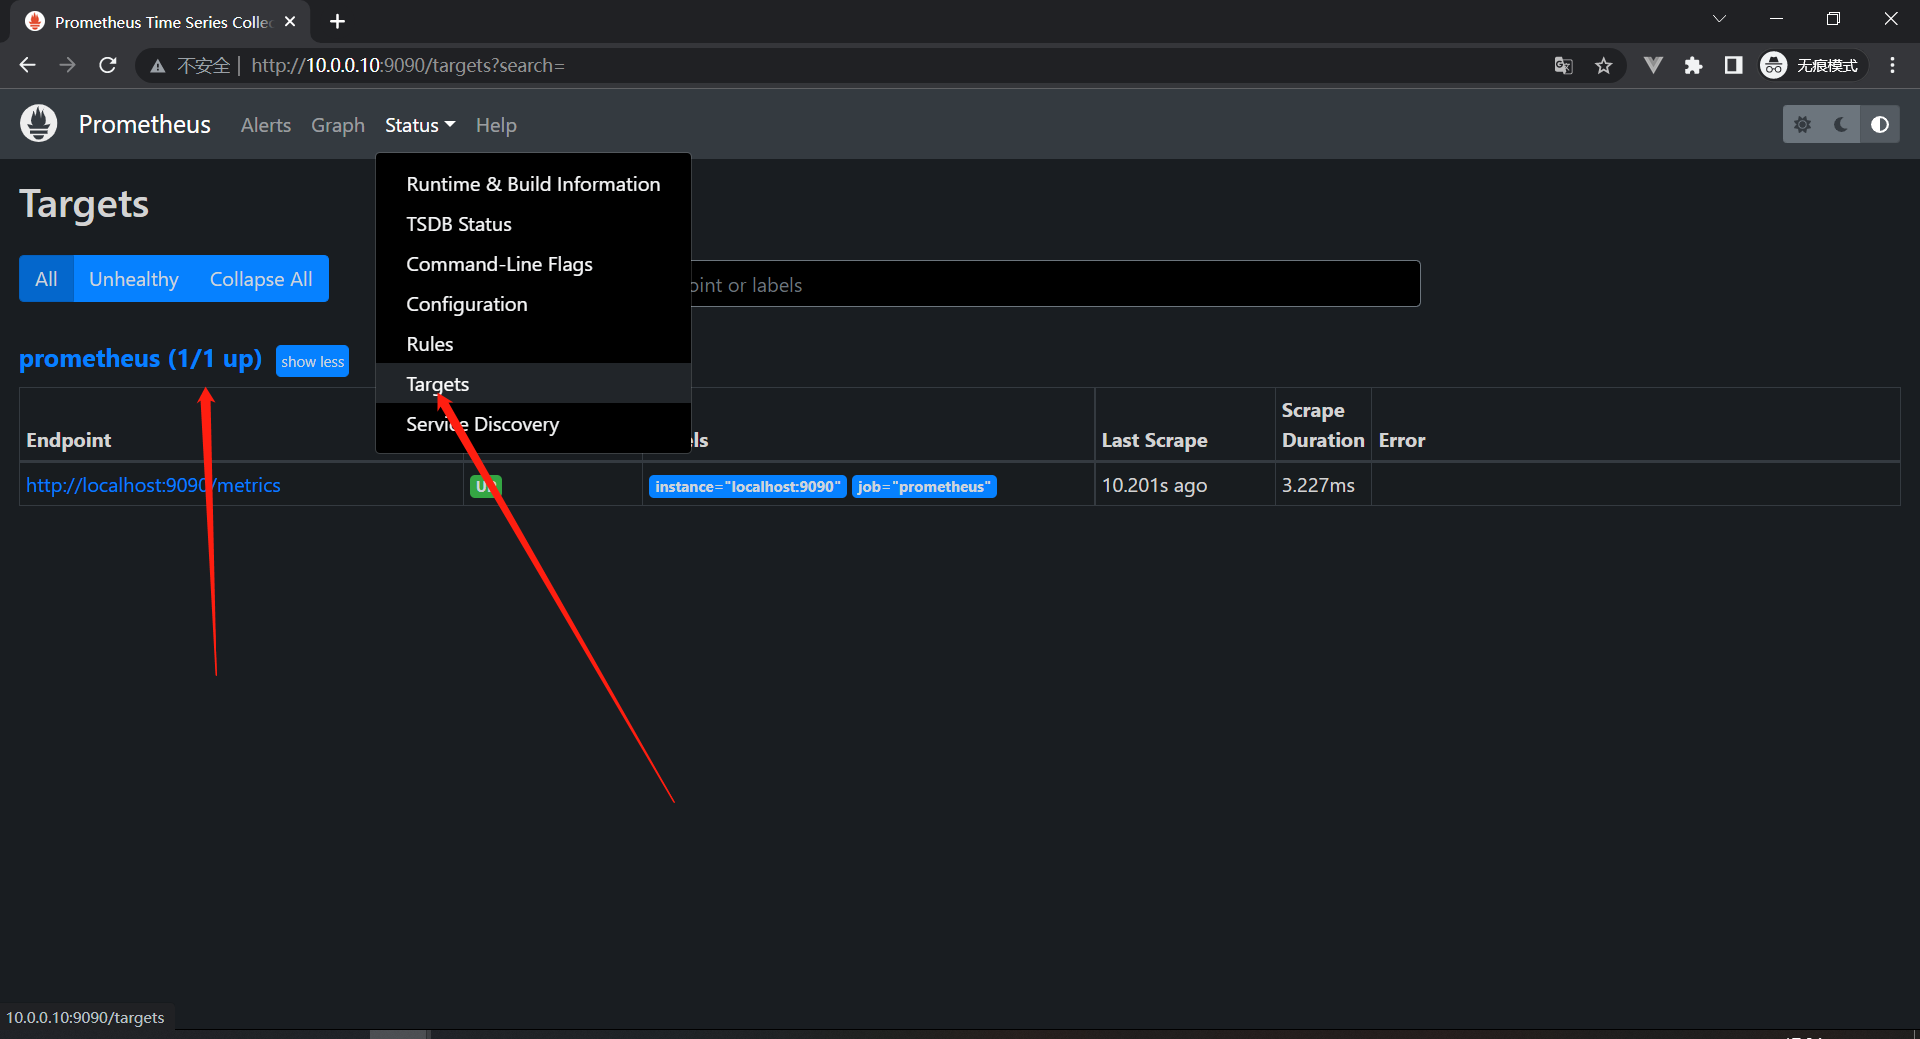
# 解释:
1:这里面可以看到一个target是我们在默认的配置内添加的
  - job_name: "prometheus"
    static_configs:
      - targets: ["localhost:9090"]
2:状态为UP则证明是正常抓取到了,如果非正常抓取的话会显示DOWN 并且 ERROR会显示报错信息的,我们配置错一下试试
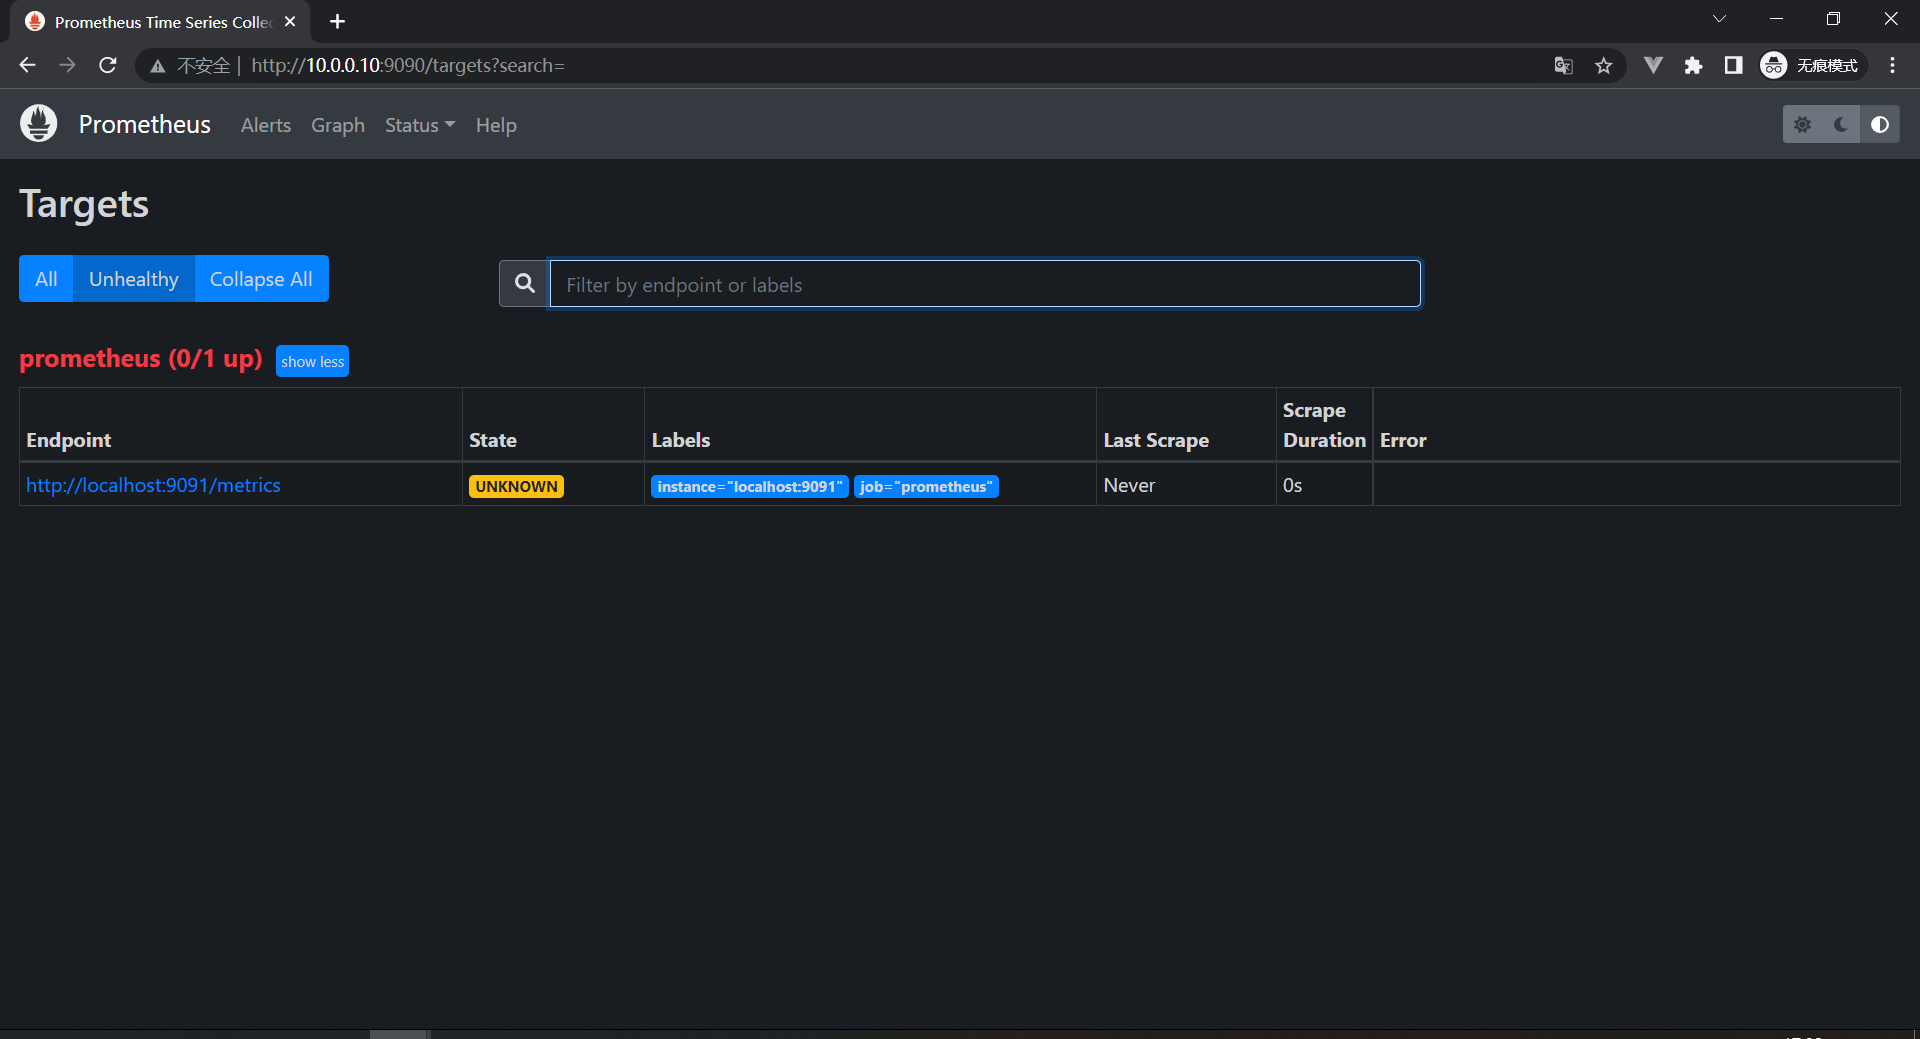
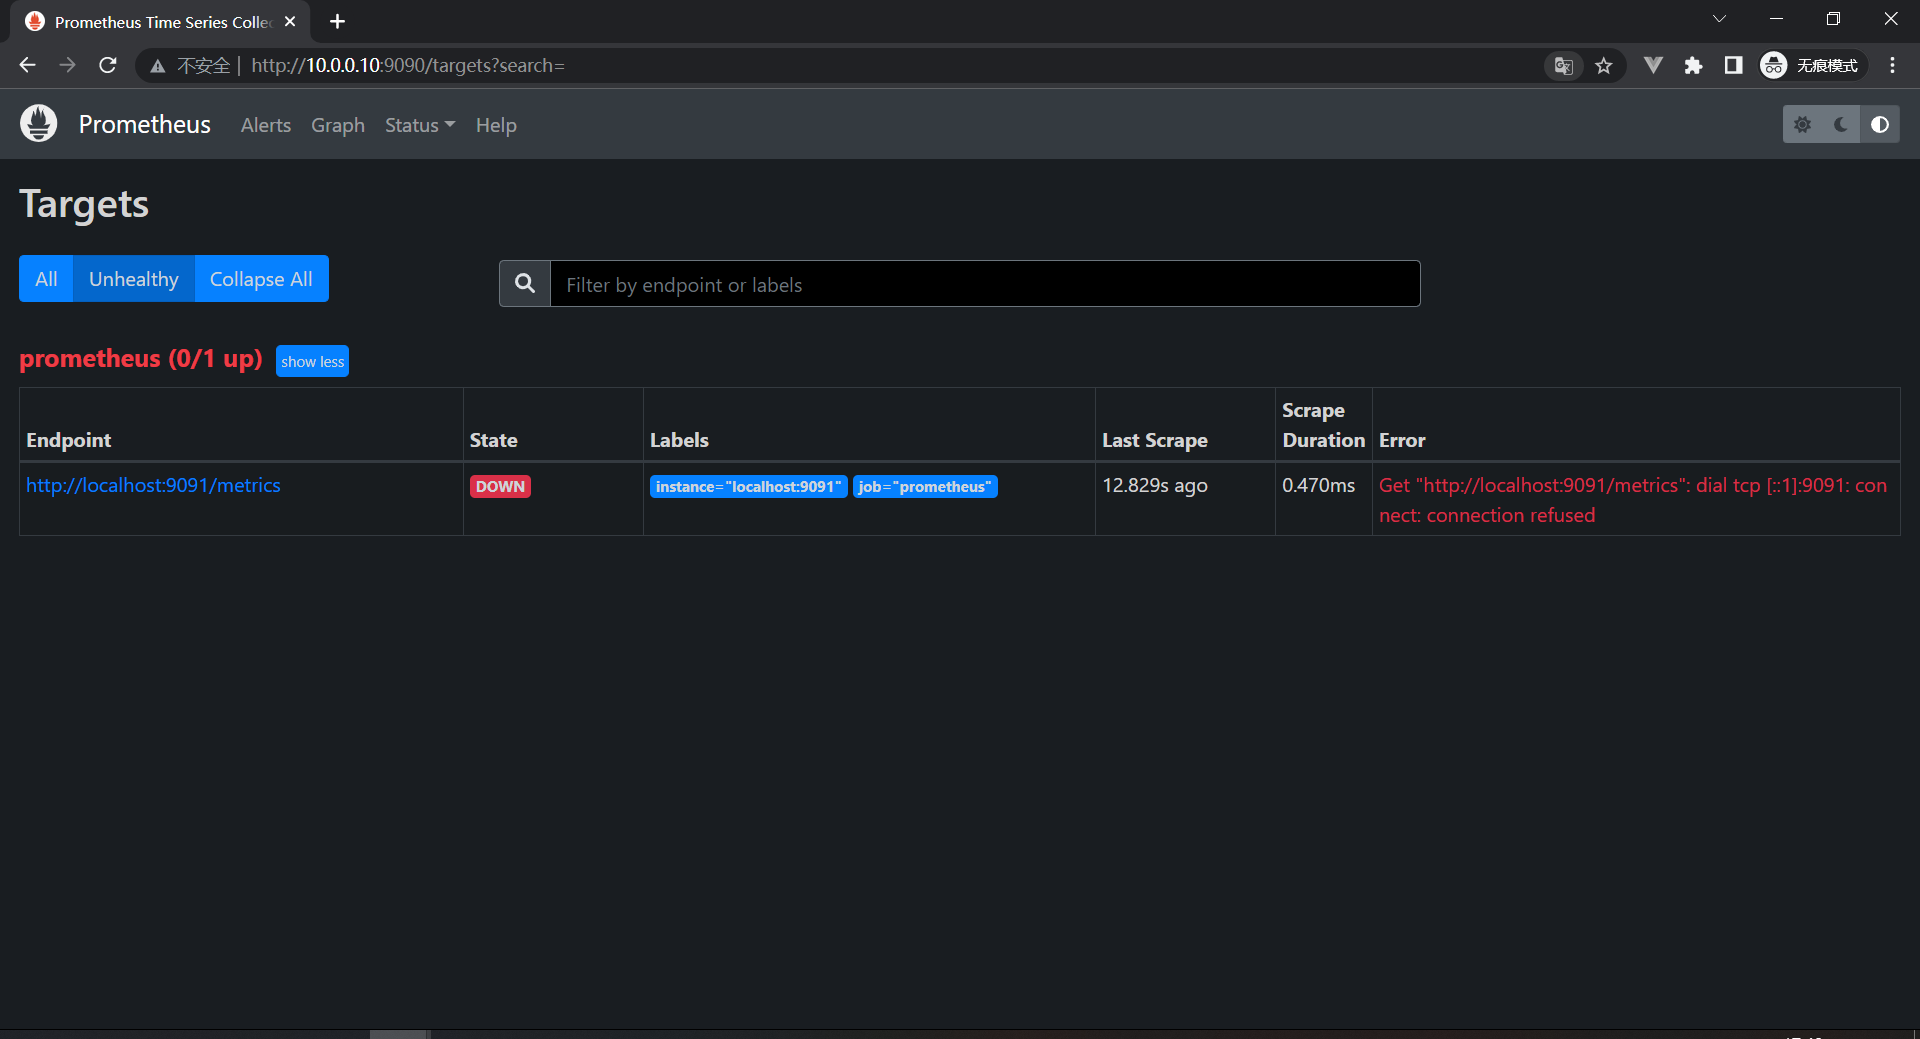
我们可以看到上面两张图的状态是不一样的:
1:UNKNOW:正在抓取,还不知道抓不抓得到
2:DOWN:抓取超时了,没有抓到数据,报错
   Get "http://localhost:9091/metrics": dial tcp [::1]:9091: connect: connection refused
   # 连接这个地址的时候被拒绝了,所以没有拿到数据
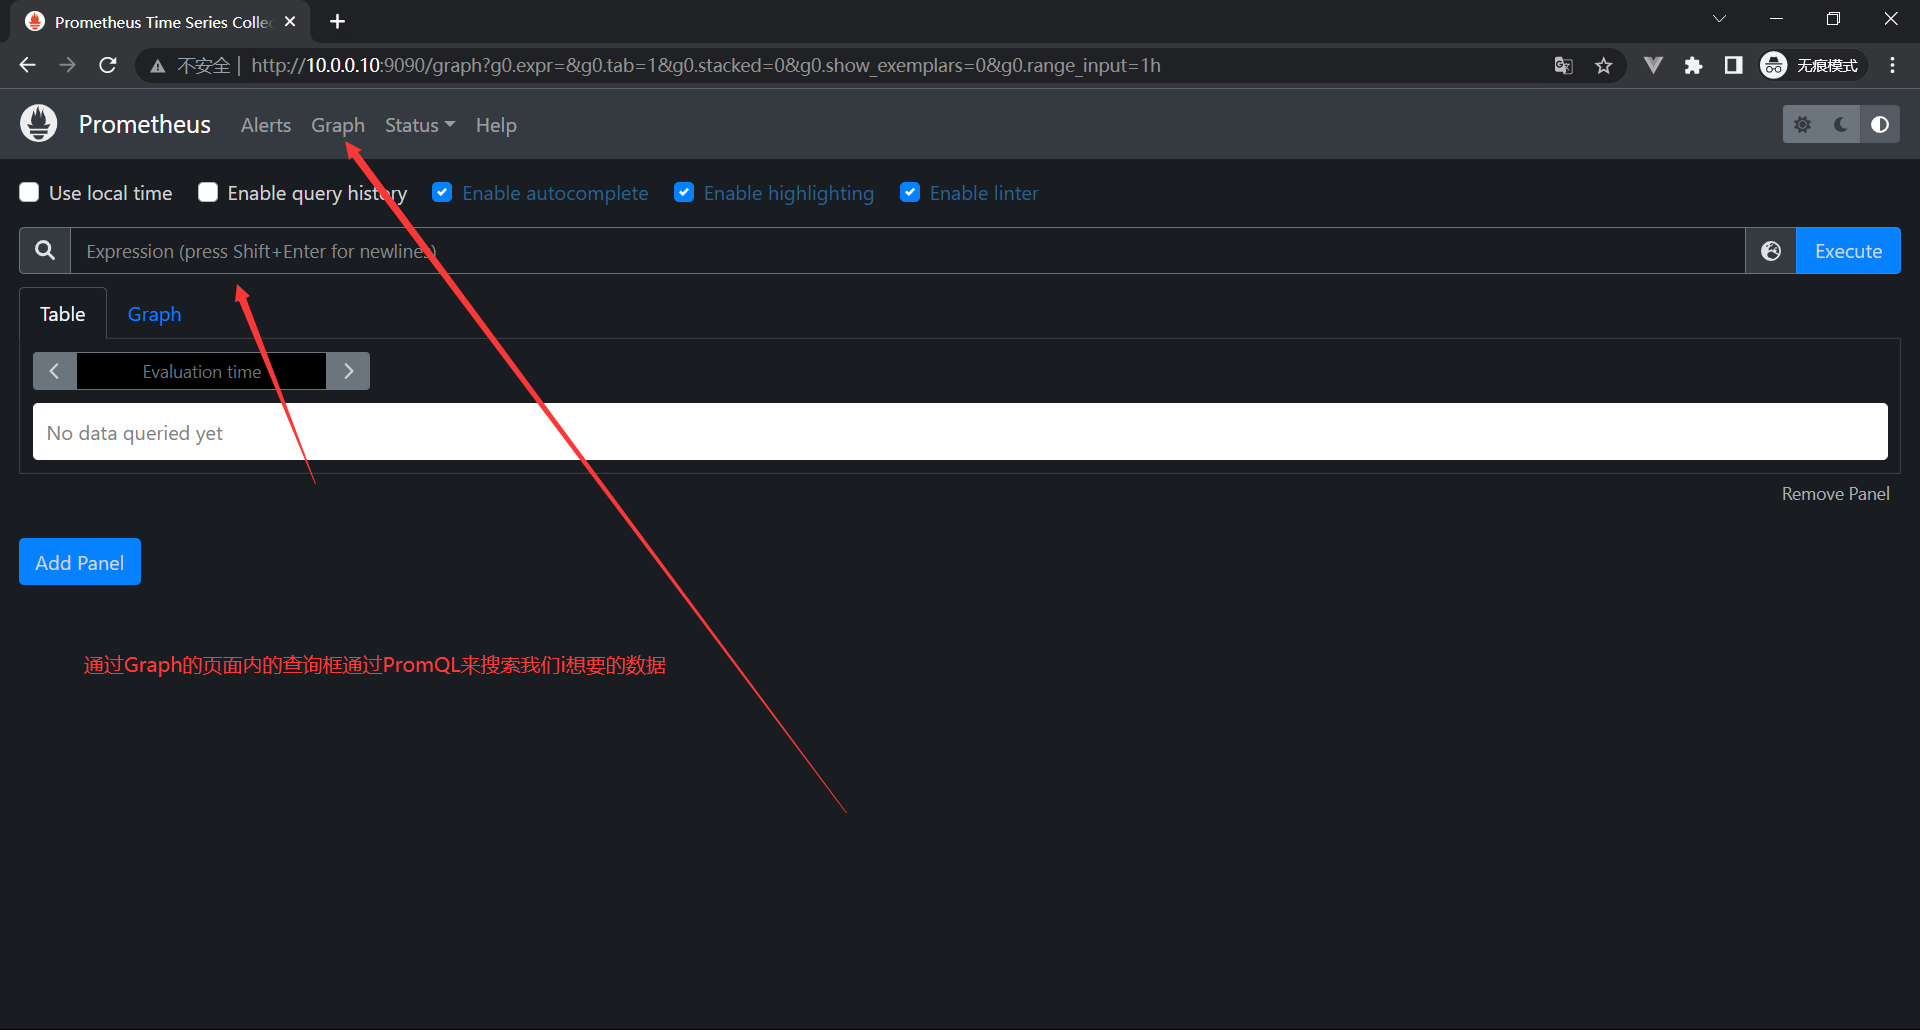
# PromQL是整个Prometheus内最麻烦的了
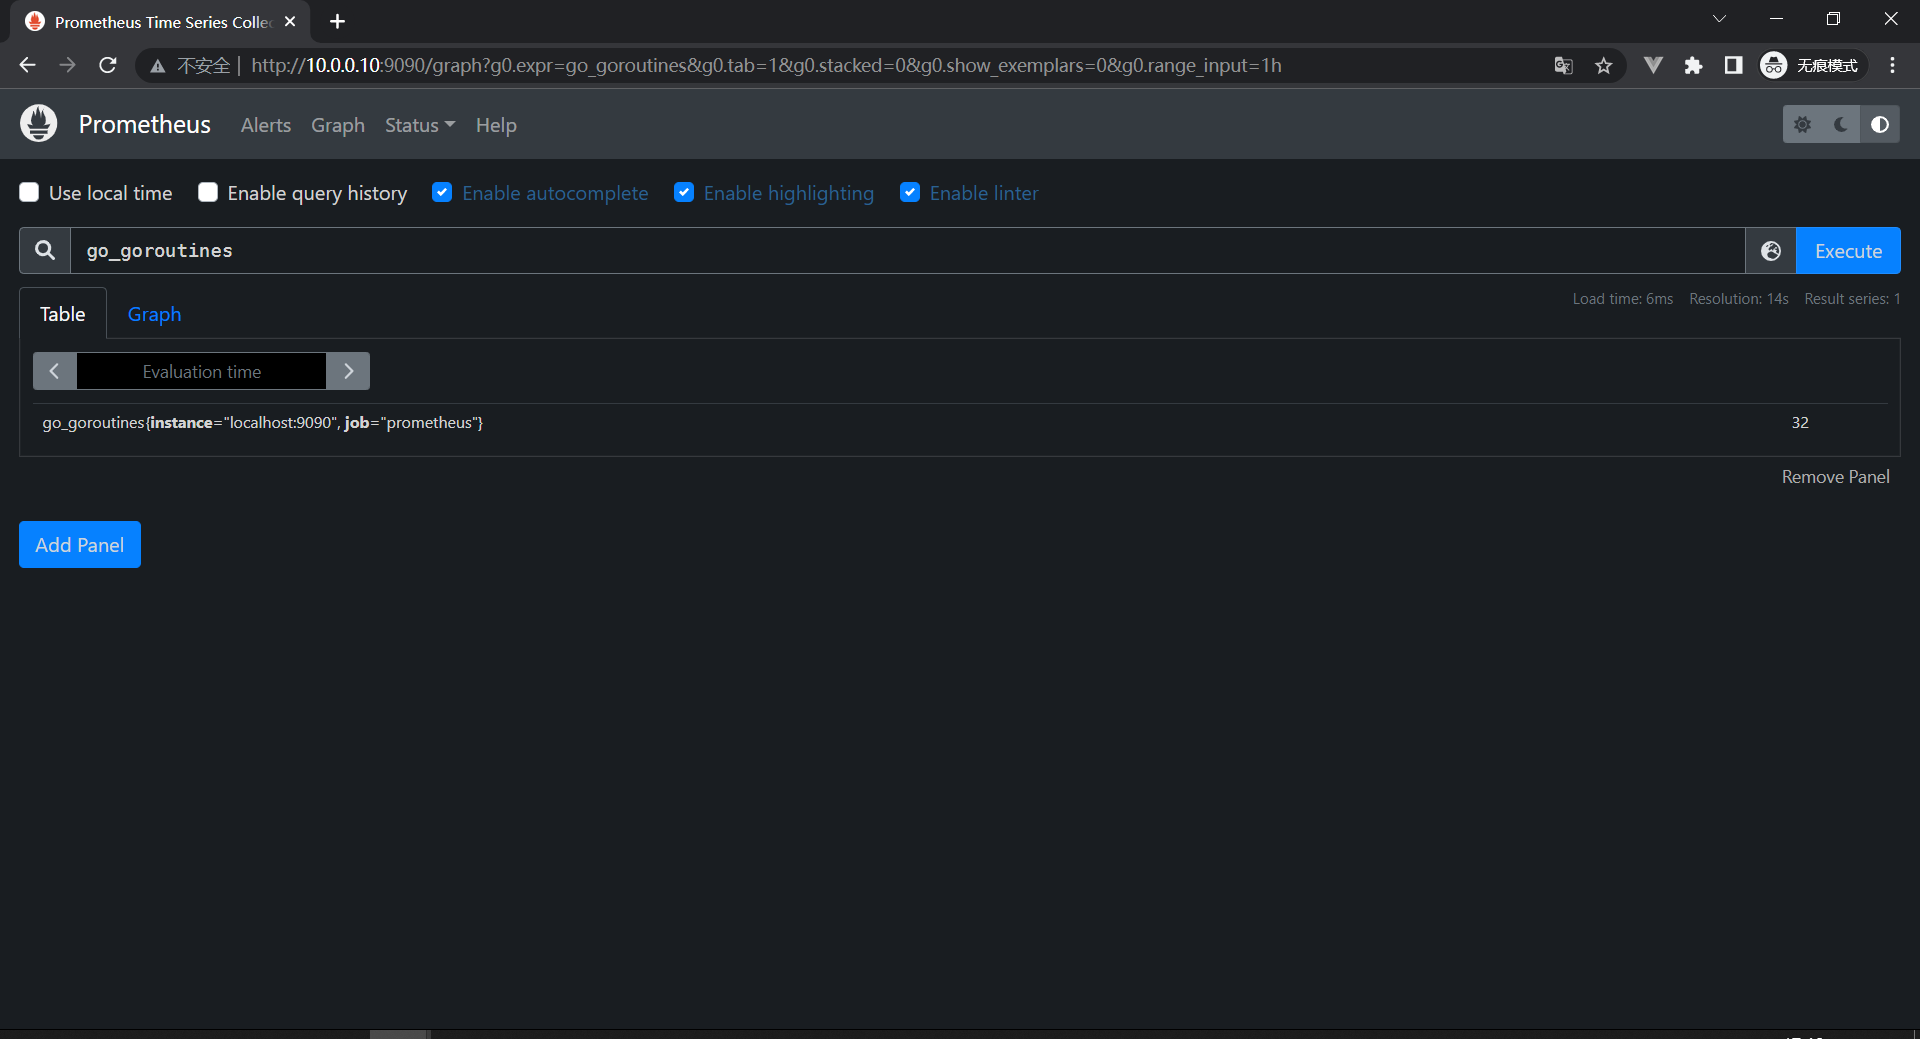
查询语言:go_goroutines
查询结果:go_goroutines{instance="localhost:9090", job="prometheus"} 32
展示方式:Table/Graph # 表格/图型
查询语言:prometheus_tsdb_head_samples_appended_total
查询结构:prometheus_tsdb_head_samples_appended_total{instance="localhost:9090", job="prometheus"} 17584
计算:rate(prometheus_tsdb_head_samples_appended_total[1m]) # 使用rate计算每分钟内每秒摄取的样本数量
8:PromQL使用
8.1:PromQL介绍
PromQL是Prometheus监控系统内置的一种查询语言,PromQL允许你以灵活的方式选择,聚合等其他方式转换和计算时间序列数据,该语言仅用于读取数据,可以说PromQL是我们学习Prometheus最困难也是最重要的部分,接下来我们将进入PromQL的基础知识,理论基础,然后深入了解更加高级的PromQL查询模式
8.2:目标
本次我们能够有效的构建,分享和理解PromQL查询,可以帮助我们从容的应对报警规则,仪表盘可视化等可视化需求,还能够避免一些使用PromQL表达式的时候遇到的一些陷阱
8.3:执行
上面我们看过Prometheus的基础架构了
# API请求方式:
http://10.0.0.10:9090/api/v1/query?query=rate(prometheus_tsdb_head_samples_appended_total[1m])&time=1657625144.349

当Prometheus从系统和服务收集指标数据时,它会把数据存储在内置的时序数据库中,要对收集到的数据进行任何处理,我们都可以使用PromQL从TSDB中读取数据,同时可以对所选的数据进行过滤,聚合以及其他转换操作。

PromQL执行可通过两种方式触发:
1:在Prometheus服务器中,记录规则和报警规则会定时执行,并执行查询操作来计算规则结果(例如:触发报警)。该执行在Prometheus的内部进行,并在配置规则时自动发生。
2:外部用户和UI界面可以使用Prometheus服务器提供的HTTP API来执行PromQL查询,这就是仪表盘软件(例如:Grafana,PromLens以及Prometheus内置的WebUI)访问PromQL的方式
8.4:场景
PromQL可以应用于许多监控场景:
1:临时查询
我们可以用PromQL来对收集到的数据进行实时查询,这有助于我们去调试和诊断遇到的一些问题,我们一般也是直接使用内置的表达式查询界面来执行这类查询。
8.5:仪表盘
同样我们也基于PromQL查询来创建可视化的图形,表格等面板,当然我们一般会用Grafana,当然了Grafana也是原生支持Prometheus作为数据源的,并且内置了PromQL表达式查询
8.5:报警
Prometheus可以直接使用基于PromQL对收集的数据进行的查询结果来生成报警,一个完整的报警规则如下:

groups:
  - name: demo-service-alerts
    rules:
      - alert: Many5xxErrors
        expr: |
          (
            sum by(path, instance, job) (
              rate(demo_api_request_duration_seconds_count{status=~"5..",job="demo"}[1m])
            )
          /
            sum by(path, instance, job) (
              rate(demo_api_request_duration_seconds_count{job="demo"}[1m])
            ) * 100 > 0.5
          )
        for: 30s
        labels:
          severity: critical
        annotations:
          title: "{{$labels.instance}} high 5xx rate on {{$labels.path}}"
          description: "The 5xx error rate for path {{$labels.path}} on {{$labels.instance}} is {{$value}}%."

除了构成报警规则核心的PromQL表达式(上面的yaml中的"expr"属性),报警规则还包含一切其他的元数据字段,后面再深入讲解报警,

这样配置完成之后,Prometheus会通过一个名为"AlertManager"的组件来发送报警通知,可以配置一些接收器来接收这些报警,比如钉钉。企业微信,WebHook等
8.6:自动化
此外我们还可以构建自动化流程,针对PromQL执行查询的结果进行决策,比如Kubernetes中基于自定义指标的HPA
9:数据模型
9.1:认识数据模型
在开始学习PromQL的知识之前,我们需要先重新熟悉一下Prometheus的数据模型
Prometheus会将所有采集到的样本数据以时间序列的方式保存在内存数据库中,并定时的刷新到硬盘上,时间序列是按照时间戳和值的序列顺序存放的,我们称之为向量(vector),每条时间序列通过指标名(metrics name)和一组标签集(labelset)命名,我们可以将时间序列理解为一个以时间为X轴的数字矩阵:
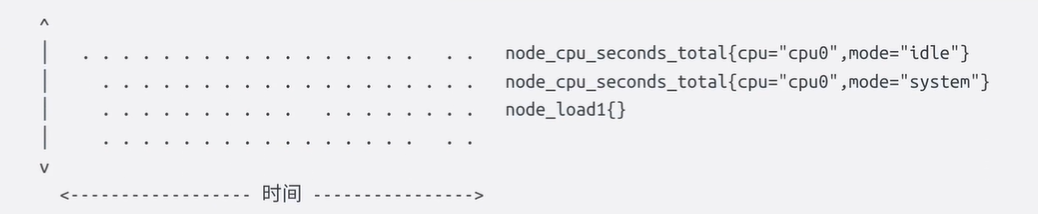
在时间序列中的每一个点称之为一个样本(sample),样本由以下三部分组成:

1:指标(metric):指标名和描述当前样本特征的标签集
2:时间戳(timestamp):精确到毫秒的时间戳数
3:样本值(value):一个float64的数据表示当前样本的值

如下图:
在形式上,所有的指标都通过如下格式表示:
<metric name>{<label name>=<lable value>,...}

1:指标名称可以反映被监控样本的含义:(比如:http*request_total表示当前系统接收到的HTTP请求总量)。指标名只能由ASCII字符,数字,下划线以及冒号组成并必须符合正则表达式[a-zA-Z_:][a-zA-Z0-9_:]\*。
2:标签(label)反映了当前样本的特征维度,通过这些维度Prometheus可以对样本数据进行过滤,聚合等,标签的名称只能由ASCII字符,数字,下划线以及冒号组成并必须符合正则表达式[a-zA-Z_:][a-zA-Z0-9_]*。

# 注:在TSDB内部,指标名称也只是一个特殊的标签为 __name__,由于这个标签在PromQL中随时都会使用,所以在使用PromQL查询的时候被单独写在了标签列表的前面了,另外像method="" 这样的空标签在Prometheus中相当于一个不存在的标签,在Prometheus代码里面是明确的剥离了空标签,并不会存储它们。

每个不同的 metrics name和label组合都称为时间序列,在Prometheus的表达式语言中,表达式或者子表达式包括以下四种类型之一:

1:瞬时向量(Instant vector):一组时间序列,每个时间序列包含单个样本,它们共享相同的时间戳,也就是说,表达式的返回值中只会包含该时间序列中的最新的一个样本值,而相应的这样的表达式称之为"瞬时向量表达式"
2:区间向量(Range vector):一组时间序列,每个时间序列包含一段时间内的样本数据,这些通过将时间选择器附加到方括号中的瞬时向量(例如[1m]1分钟)而生成的。
3:标量(Scalar):一个简单的数字浮点值
4;字符串(String):一个简单的字符串值

所有这些指标都是Prometheus定期从metrics接口那里采集过来的,采集的时间隔由prometheus.yaml内的scrape_interval定义。最多抓取时间间隔为30s,这就意味着至少没30秒就会有一个带有时间戳记录的新数据点,这个值可能会更改,也可能不会更改,但是每隔scrape_interval都会产生一个新数据
9.2:指标类型
从存储上来讲所有的监控指标都是相同的,但是在不同的场景下这些指标又有一些微小的差异,例如:在Node Exporter返回的样本中指标node_load1反映的是当前系统的负载状态,随着时间的变化这个指标返回的样本的数据是在不断变化的。而且指标node_cpu_seconds_total所获取到的样本数据却是不同的,它是一个持续增大的值,因为其反映的是CPU的累计使用时间,从理论上来讲只要系统不关机,这个值会一直变大。

为了能够帮助用户理解和区分这些不同监控直指标之间的差异,Prometheus定义了四种不同的类型:

1:Counter(计数器)
2:Gauge(仪表盘)
3:Histogram(直方图)
4:Summary(摘要)

在Node-exporter返回的样本数据中,其注解也包含了该样本的类型,例如:
# HELP node_cpu_seconds_total Seconds the cpus spent in each node.
# TYPE node_cpu_seconds_total counter
node_cpu_seconds_total{cpu="cpu0" ,mode="idle"] 362812.7890625
9.2.1:Counter
Counter(只增不减的计数器)类型的指标其工作方式和计数器一样,只增不减,所以它对于存储诸如服务的HTTP请求量或使用的CPU时间之类的信息非常的有用,常见的监控指标如:http_request_total  node_cpu_seconds_total 都是Counter类型的监控指标:
比如:

20:00:00
http_request_total 100000        # 现在的值
node_cpu_seconds_total  3000     # 现在的值

19:59:00
http_request_total 97000        # 一分钟前的值
node_cpu_seconds_total  2400    # 一分钟前的值

http_request_total / http_request_total   offset 1m 3000
node_cpu_seconds_total / node_cpu_seconds_total   offset 1m 600

如果你觉得一直增加的数据没有什么用处,了解服务从开始有多少请求有什么价值么,但是请记住,每个指标都是存储了时间戳的,所以你的HTTP请求可能是10万,但是Prometheus也会记录之前某个点的值,我们可以去查询过去一分钟内的请求数,当然我们最想看到的还是请求数量的增加或者减少的速度有多块,因此,通常对于Counter指标我们都是去查看变化率,而不是查看本身的数字,PromQL内置的聚合操作和函数可以让用户对这些数据进行进一步的分析,例如:通过rate()获取HTTP请求的增长率:
rate(http_requsts_total[5m])  # 获取前五分钟内的样本数据
9.2.2:Gauge
与Counter不同,Gauge(可增可减仪表盘)类型的的指标侧重于反映系统的当前状态,因此这类类型指标的样本数据可增可减,常见的指标如:node_memory_MemFree_bytes(当前主机空闲内存的大小),node_memory_MemAvailable_bytes(可用内存大小),都是Gauge类型的监控指标,由于Gauge指标仍然带有时间戳存储,所以我们可以看到随时变化的值,通常可以直接把它们绘制出来,这样就可以看到值本身而不是变化率了,通过Guage指标,用户可以直接查看系统当前状态
比如:

20:00:00
http_requests_active  2000           # 现在的值
memory_allocated_bytes  4.832e+09    # 现在的值

19:59:00
http_requests_active  1920           # 一分钟前的值
memory_allocated_bytes  4.101e+09    # 一分钟前的值

memory_allocated_bytes / (1024*1024*1024) = 实时值

这些简单的指标类型都只是为每个样本获取一个数字,但Prometheus的强大这之处在于如何让你跟踪它们,比如说我们绘制了两张图,一个是HTTP请求变化率,另一个是分配Gauge类型的实际内存,直接从图上可以看出这两个之间有一种关联性,当请求出现峰值的时候,内存的使用也会出现峰值,但我们仔细观察也会发现峰值过后,内存的使用量并没有恢复到峰值前的水平,整体它在逐渐增加,这表明程序很有可能存在内存泄漏的问题,通过这些简单的指标可以帮助我们找到这些可能存在的问题。

对于Gauge类型的监控指标,通过PromQL内置函数delta()可以获取样本在一段时间范围内的变化情况,例如:计算CPU在两个小时内的差异:
delta(cpu_temp_celsius{host="zeus"}[2h])

可以直接使用  predict_linear()对数据的变化趋势进行预测,例如,预测系统磁盘在4小时后剩余情况:
predict_linear(node_filesystem_free_bytes[1h], 4 * 3600)
9.2.3:Histogram和Summary
除了Counter和Gauge类型监控指标意外,Prometheus还定义了Histogram和Summary的指标类型。Histogram和Summary主要用于统计和分析样本的分布情况。

在大多数情况下人们都倾向于使用某些量化指标的平均值,例如:CPU的平均使用率,页面平均响应时间,这种方式也有很明显的问题,以胸痛API调用平均响应为例:如果大多数响应都维持在100ms的响应时间范围内,而个别响应只需要5s,那么就会导致导致某些web页面的响应时间落到中位数,而这种现象称为长尾问题。

为了区分是平均的慢还是长尾的慢,最简单的方法就是按照请求延迟的范围进行分组,例如:延迟在0-10ms之间的请求数有多少而延迟在10-20ms的又有多少,通过这种方式我们可以快速分析是什么导致的页面加载缓慢或者API缓慢,Histogram和Summary都是为了能够解决这样的问题而存在的,通过Histogram和Summary类型的监控指标,我们可以快速了解监控样本的分布情况。
9.2.4:Summary
摘要用于记录某些东西的平均大小,可能是计算所需的时间或处理的文件大小,摘要显示两个相关的信息:count(事件发生次数),和Sum(所有事件总大小),如下图计算摘要指标可以返回次数为3和总和15,也就意味着3次计算总共需要15s来处理,平均每次计算要花5s,下一个样本次数为10总和为113,那么平均值就是11.3.因为两组指标都记录有时间戳,所以我们可以使用摘要来构建一个图表,显示平均值的变化率,比如图上语句表示的是5分钟内的平均速率

20:00:00
calculation_seconds_count 3
calculation_seconds_sum 15

20:01:00
calculation_seconds_count 10
calculation_seconds_sum 113

rate(calculation_seconds_sum[5m]) / rate(calculation_seconds_count[5m])  # avg

例如:指标prometheus_tsdb_wal_fsync_duration_seconds的指标类型为Summary,它记录了PrometheusServer中wal_fsync的处理时间。我们可以访问/metrics	地址获取如下数据

# HELP prometheus_tsdb_wal_fsync_duration_seconds Duration of WAL fsync.
# TYPE prometheus_tsdb_wal_fsync_duration_seconds summary
prometheus_tsdb_wal_fsync_duration_seconds{quantile="0.5"} NaN
prometheus_tsdb_wal_fsync_duration_seconds{quantile="0.9"} NaN
prometheus_tsdb_wal_fsync_duration_seconds{quantile="0.99"} NaN
prometheus_tsdb_wal_fsync_duration_seconds_sum 0.013454372000000001
prometheus_tsdb_wal_fsync_duration_seconds_count 2

从样本可以看出PrometheusServer进行wal_fsync操作的总次数为2次,耗时大约0.013454372000000001s,其中中位数(quantile="0.5")的时间其实应该有的,可能是触发次数太少了,所以没记录下来,下面的也一样。
9.2.5:Histogram
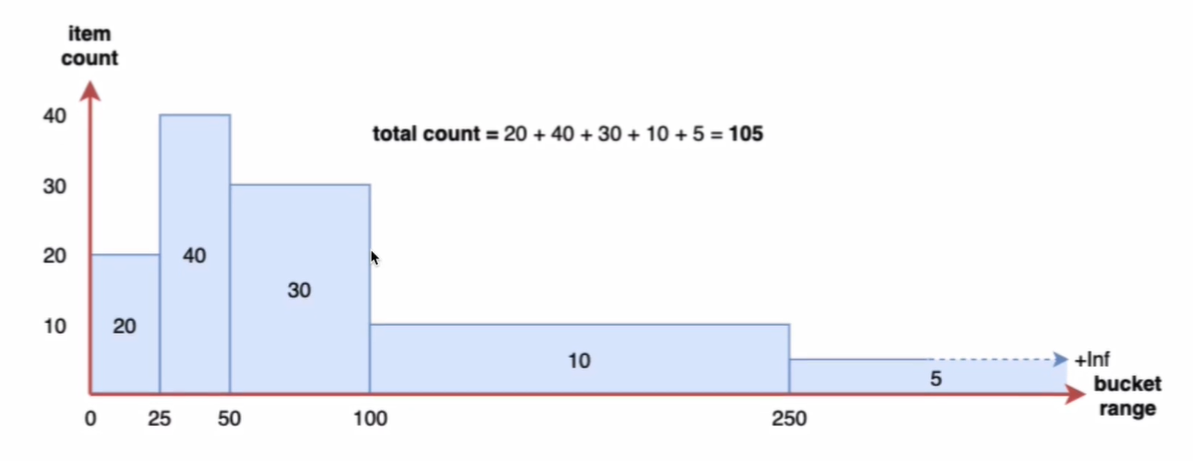
摘要非常的有用,但是平均值会隐藏一些细节,上面的数据10于113的总和包含非常广的范围,如果我们查看时间花在了什么地方,那么我们就要涉及到直方图了,直方图以bucket桶的形式记录数据,所以我们可能有一个桶用于需要1s或更少的计算,另一个桶用于5s或更少,10s或更少,20s或更少,60s或更少,该指标返回每个桶的计数,其中三个在5秒或更短的时间内完成,6个在10秒或更短时间内完成,Prometheus直方图是累计的,因为所有10次计算都属于60秒或更少的时间段,而在这10次中,有9次的处理时间为20秒或者更少,这显示了数据的分布,所以可以看到部分的计算都在10s以下,者对于计算百分位很有用。

calculation_seconds_bucket{le="1"} 0
calculation_seconds_bucket{le="5"} 3
calculation_seconds_bucket{le="10"} 6
calculation_seconds_bucket{le="20"} 9
calculation_seconds_bucket{le="60"} 10

calculation_seconds_bucket{le="20"} / calculation_seconds_bucket{le="+lnf"}

在Prometheus Server自身返回的样本数据中,我们也能找到类型为Histogram的监控指标prometheus_tsdb_compaction_chunk_range_seconds_bucket


# HELP prometheus_tsdb_compaction_chunk_range_seconds Final time range of chunks on their first compaction
# TYPE prometheus_tsdb_compaction_chunk_range_seconds histogram
prometheus_tsdb_compaction_chunk_range_seconds_bucket{le="100"} 0
prometheus_tsdb_compaction_chunk_range_seconds_bucket{le="400"} 0
prometheus_tsdb_compaction_chunk_range_seconds_bucket{le="1600"} 0
prometheus_tsdb_compaction_chunk_range_seconds_bucket{le="6400"} 0
prometheus_tsdb_compaction_chunk_range_seconds_bucket{le="25600"} 0
prometheus_tsdb_compaction_chunk_range_seconds_bucket{le="102400"} 0
prometheus_tsdb_compaction_chunk_range_seconds_bucket{le="409600"} 0
prometheus_tsdb_compaction_chunk_range_seconds_bucket{le="1.6384e+06"} 0
prometheus_tsdb_compaction_chunk_range_seconds_bucket{le="6.5536e+06"} 0
prometheus_tsdb_compaction_chunk_range_seconds_bucket{le="2.62144e+07"} 0
prometheus_tsdb_compaction_chunk_range_seconds_bucket{le="+Inf"} 0
prometheus_tsdb_compaction_chunk_range_seconds_sum 0
prometheus_tsdb_compaction_chunk_range_seconds_count 0
10:演示服务
为了能够尽可能详细的演示PromQL指标查询,这里选址使用一个开源的Prometheus演示服务来查询,这样可以让我们更灵活的对指标数据进行控制,项目仓库:https://github.com/cnych/prometheus_demo_service,这是一个Go语言开发的服务,我们可以完全自己构建应用。
1:下载Go
# 这里可能要施点魔法
[root@prometheus ~]# wget https://golang.google.cn/dl/go1.18.4.linux-amd64.tar.gz
# 解压到指定目录
[root@prometheus ~]# tar -C /usr/local/ -xvf go1.18.4.linux-amd64.tar.gz
# 配置环境变量,因为不涉及到开发,所以就不配置太多了
[root@prometheus ~]# export PATH=$PATH:/usr/local/go/bin
# 测试Go
[root@prometheus ~]# go version
go version go1.18.4 linux/amd64
# 配置加速
export GOPROXY=https://goproxy.cn
2:克隆应用
# git clone
[root@prometheus ~]# git clone https://github.com/cnych/prometheus_demo_service.git
[root@prometheus prometheus_demo_service]# ls
api.go client.go crossbuild.sh Dockerfile go.sum intermittent_metric.go memory.go
batch.go cpu.go disk.go go.mod holiday.go main.go
# 跨平台编译成二进制进程
[root@prometheus prometheus_demo_service]# GOOS=linux GOARCH=amd64 go build -o prometheus_demo_service
go: downloading github.com/prometheus/client_golang v1.8.0
go: downloading github.com/beorn7/perks v1.0.1
go: downloading github.com/cespare/xxhash/v2 v2.1.1
go: downloading github.com/golang/protobuf v1.4.3
go: downloading github.com/prometheus/client_model v0.2.0
go: downloading github.com/prometheus/common v0.14.0
go: downloading github.com/prometheus/procfs v0.2.0
go: downloading google.golang.org/protobuf v1.23.0
go: downloading github.com/matttproud/golang_protobuf_extensions v1.0.1
go: downloading golang.org/x/sys v0.0.0-20201015000850-e3ed0017c211
# 查看二进制文件
[root@prometheus prometheus_demo_service]# ls
api.go client.go crossbuild.sh Dockerfile go.sum intermittent_metric.go memory.go
batch.go cpu.go disk.go go.mod holiday.go main.go prometheus_demo_service
# 启动三个不同端口的服务
[root@prometheus prometheus_demo_service]# ss -lnt
State Recv-Q Send-Q Local Address:Port Peer Address:Port
LISTEN 0 128 *:111 *:*
LISTEN 0 128 *:22 *:*
LISTEN 0 128 [::]:9090 [::]:*
LISTEN 0 128 [::]:111 [::]:*
LISTEN 0 128 [::]:10000 [::]:*
LISTEN 0 128 [::]:10001 [::]:*
LISTEN 0 128 [::]:10002 [::]:*
# 配置Prometheus
[root@prometheus prometheus]# cat prometheus.yml
global:
scrape_interval: 15s
evaluation_interval: 15s
scrape_configs:
- job_name: "prometheus"
static_configs:
- targets: ["localhost:9090"]
- job_name: "demo"
scrape_interval: 15s # 这里的配置比全局的配置优先级要高
scrape_timeout: 10s # 同上
static_configs:
- targets: ["localhost:10000","localhost:10001","localhost:10002"]
# 启动Prometheus
[root@prometheus prometheus]# ./prometheus
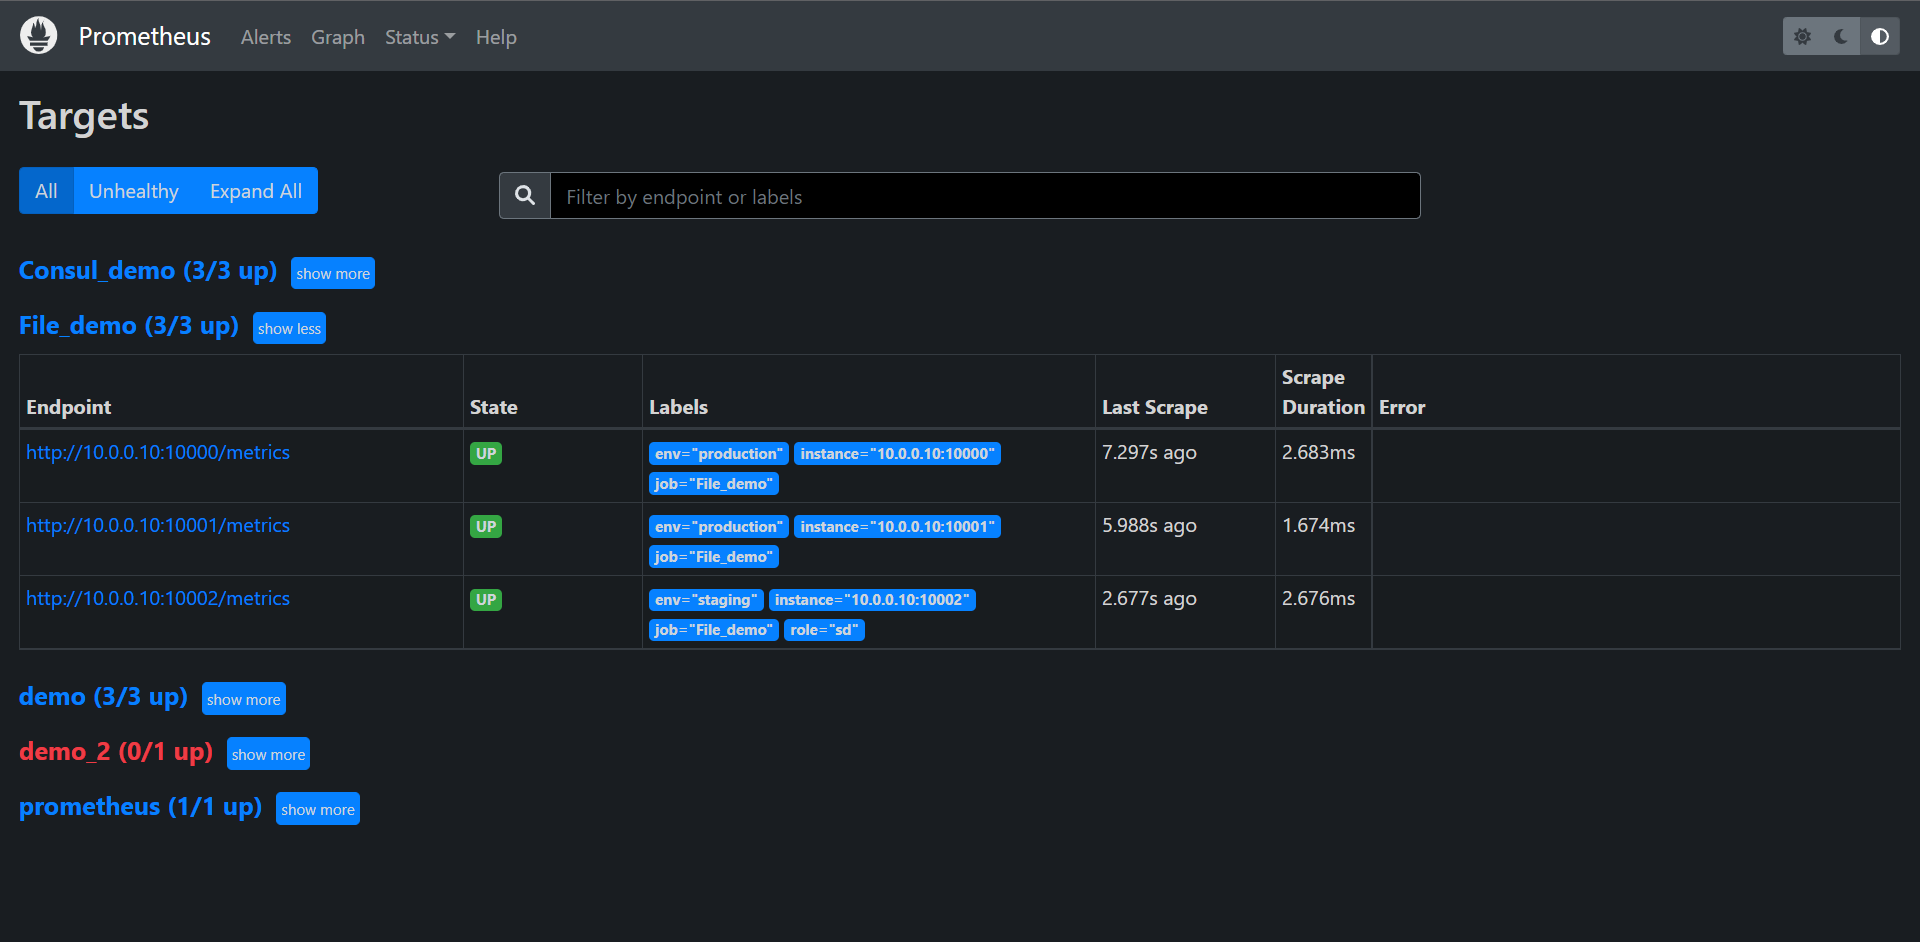
# 查看targets
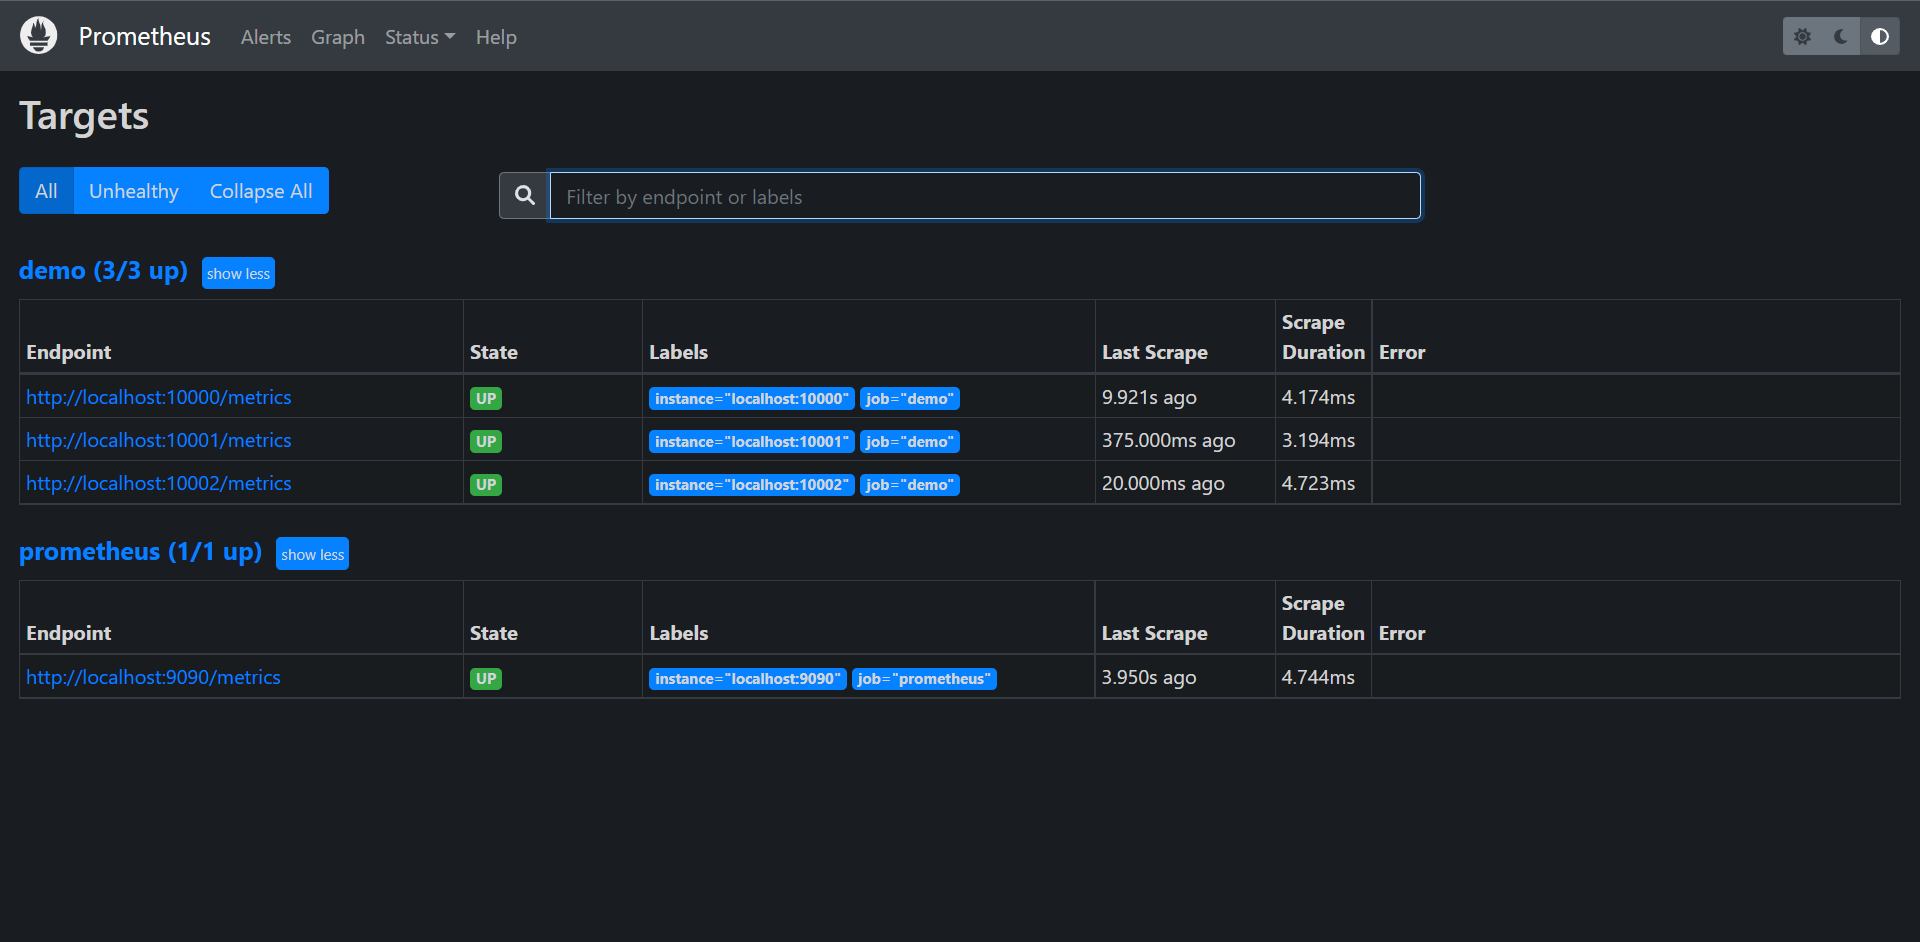
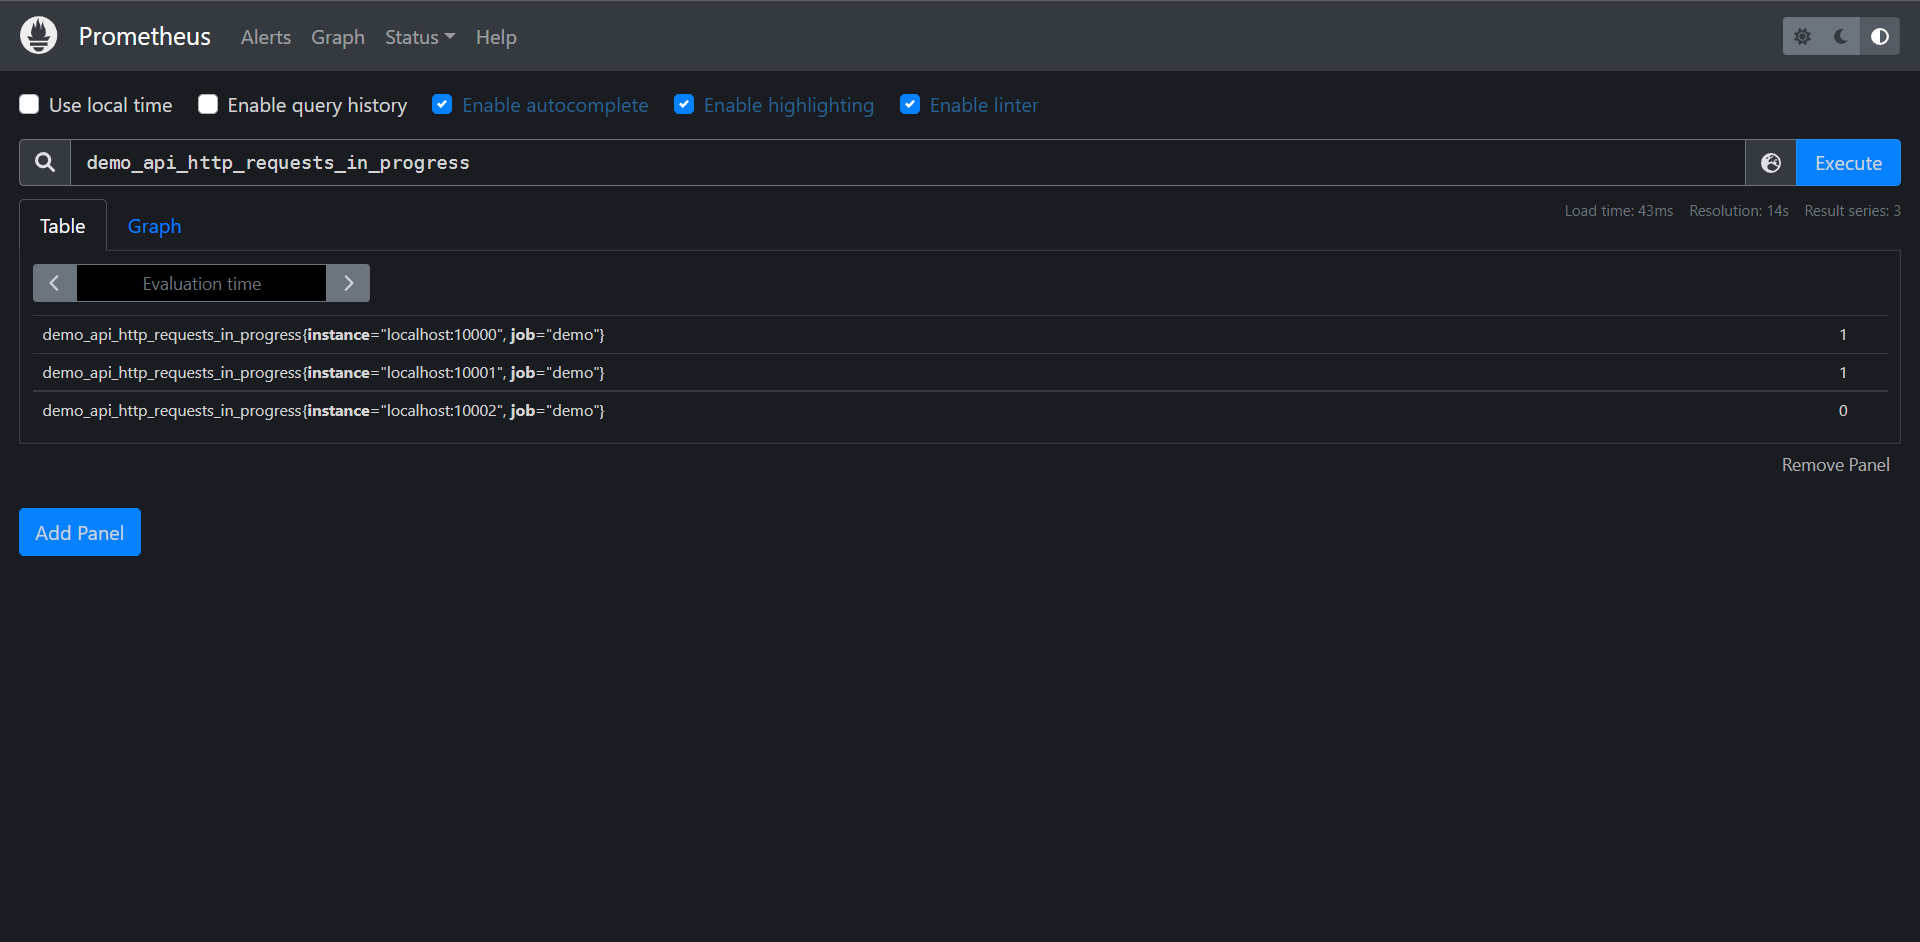
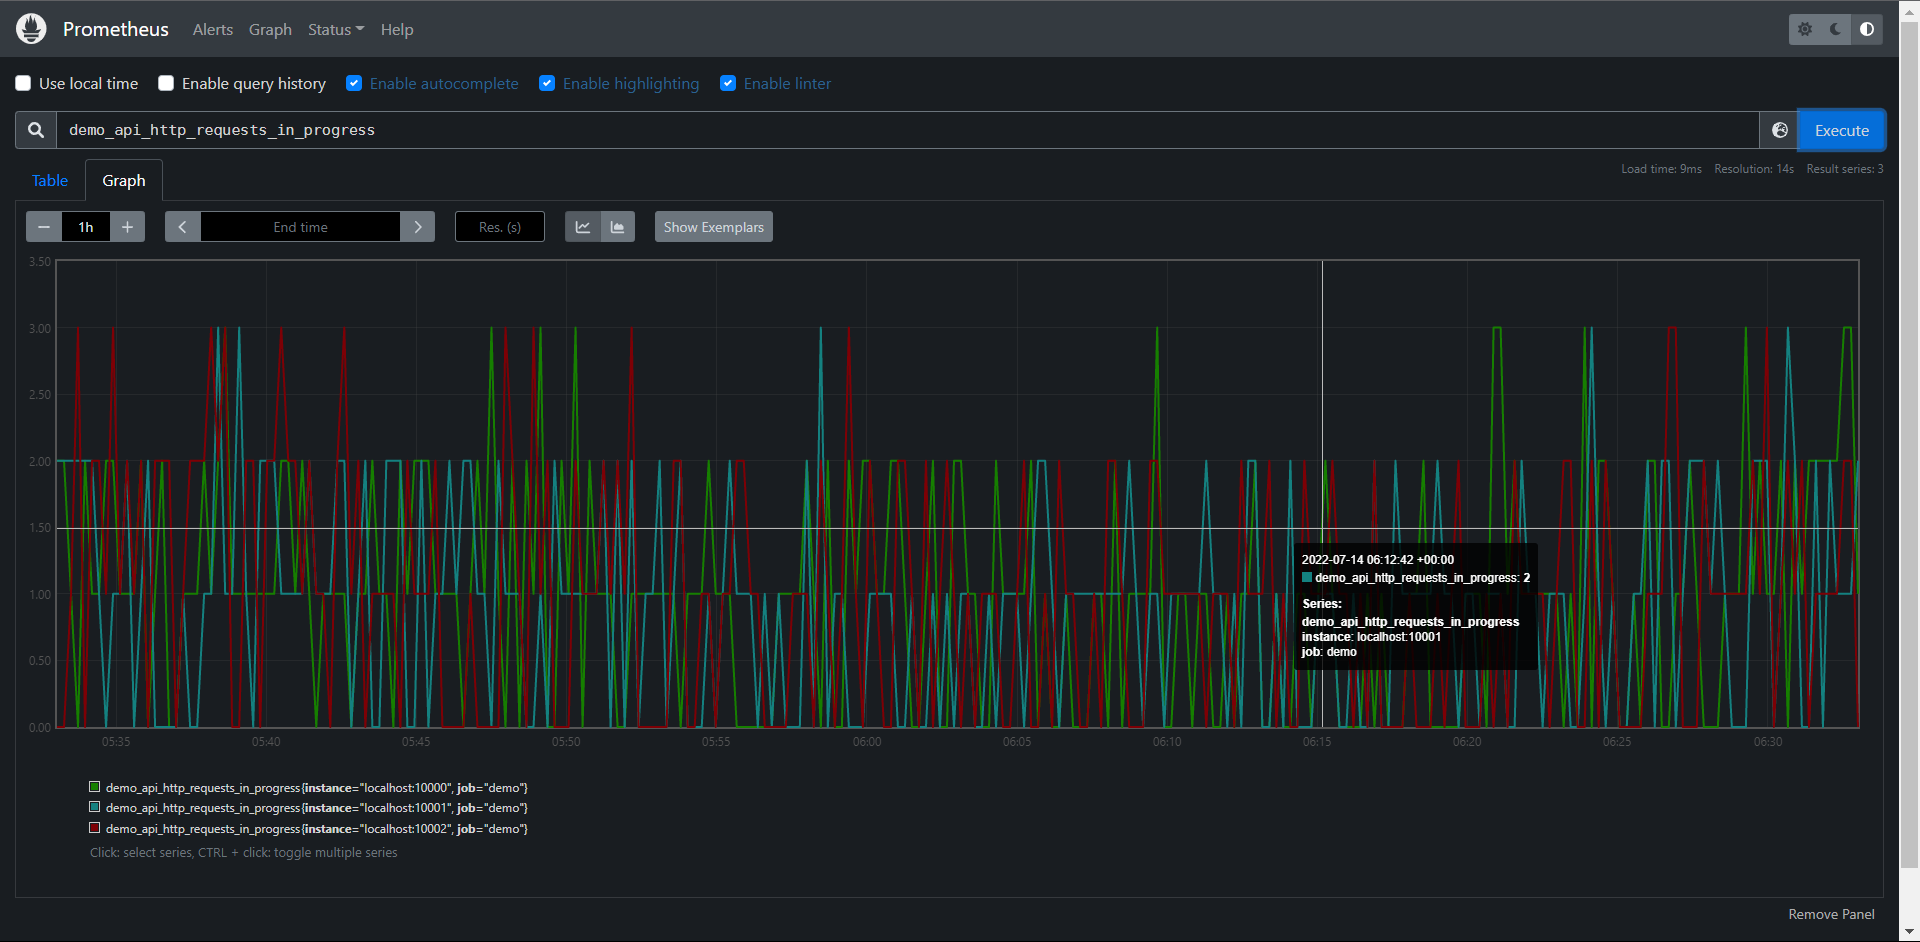
查询语句:demo_api_http_requests_in_progress
查询结果:如上图
11:PromQL基础
在深入学习PromQL细节查询之前,我们需要来看看PromQL查询的一些理论基础
11.1:嵌套结构
与SQL查询语言(SELECT * FROM ...)不同,PromQL是一种嵌套的函数式语言,就是我们需要把要查询的数据描述成一组嵌套的表达式,每个表达式都会评估为一个中间值,每个中间值都会被作用它上层表达式中的参数,而查询最外层表达式表示你可以在表格,图形中看到最终返回值,比如:

histogram_quantile(   # 查询的根,最终结果表示一个近似分位数。
  0.9                 # histogram_quantile() 的第一个参数,分位数的目标值
  # histogram_quantile()的第二个参数,聚合的直方图
  sum by(le,method,path) (
    # sum()的参数,直方图过去5分钟的每秒增量
    rate (
      # rate()的函数,过去5分钟的原始直方图序列
      demo_api_request_duration_seconds_bucket{job="demo"}[5m]
    )
  )
)

PromQL表达式不仅仅试整个查询,而是查询的任何嵌套部分(比如上面的rate()...的部分),你可以把它作为一个查询本身来运行,在上面的示例中,每行注释代表一个表达式。
11.2:结果类型
在查询Prometheus时,有两个类型的概念经常出现,区分它们是非常重要的。

1:抓取目标报告的指标类型:Counter,Guage,Histogram,Summary
2:PromQL表达式的结果数据类型:字符串,标量,瞬时向量或区间向量

PromQL实际上没有直接的指标类型的概念,只关注表达式的结果类型,每个PromQL表达式都有一个类型,每个函数,运算符或其他类型的操作都要求其参数是某种表达式类型,例如:rate()函数要求它的参数是一个区间向量,但是rate()本身评估为一个瞬时向量输出,所以rate()的结果只能用在期望是瞬时向量的地方。

PromQL中可能的表达式类型包括:

1:string(字符串):字符串只会作为某些函数(如:label_join()和label_replaca())的参数出现
2:scalar(标量):一个单一的数学值,如1.234,这些数字可以作为某些函数的参数,(如:histogram_quantile(0.9,...)或topk(3,...)),也会出现在算术运算。
3:instant vector(瞬时向量):一组标记的时间序列,每个序列有一个样本,都在同一个时间戳,瞬时向量可以由TSDB时间序列选择器直接产生,如node_cpu_seconds_total,也可以由任何函数或其他转换来获取。

node_cpu_seconds_total{cpu="0", mode="idle"}   19165708.75 @ timestamp_1
node_cpu_seconds_total{cpu="0", mode="system"}    381598.72 @ timestamp_1
node_cpu_seconds_total{cpu="0", mode="user"}   23211638.97 @ timestamp_1

4:range vector(区间向量):一组标记的时间序列,每个序列都有一个随时变化的样本范围,在PromQL中只有两种方法可以生成区间向量,在查询中使用字面区间向量选择器(如:node_cpu_seconds_total[5m]),或使用子查询表达式(如:<expression>[5m:10s]),想要在指定的窗口内聚合一个序列的行为时,区间向量非常有用。像rate(node_cpu_seconds_total[5m]),计算每秒增加率一样,在node_cpu_seconds_total指标的最后5分钟内求平均值

node_cpu_seconds_total{cpu="0", mode="idle"}  19165708.75 @ timestamp_119165136.3 @timestamp_2,19165167.72 @ tinestamp_3
node_cpu_seconds_total{cpu="0", mode="system"}  381598.72 @ timestamp_1381599.98 @ timestamp_2, 381600.58 @ timestamp_3
node_cpu_seconds_total{cpu="0", mode="user"}  23211638.97 @ timestamp_1 23211711.34 @timestamp_2,23211748.64 @ tinestamp_3

# 注意:但是指标类型呢?如果你已经用过PromQL,你可能知道某些函数仅适用于特定类型的指标,例如:historam_quantitl()函数仅用于直方图指标,rate()函数仅用于计数器指标,deriv()函数仅用于Guage,但是PromQL实际上并没有检查你是否传入了正确类型的指标,这些函数通常会运行并为错误类型的输入指标返回一些无意义的数据,这取决于用户是否传入了遵循某些假设的时间序列(比如在直方图的情况下有一个有意义的标签le,或者在计时器的情况下有一个单调递增)
11.3:查询类型和评估时间
PromQL查询中对时间的引用只有相对引用,比如[5m],表示过去5分钟,那么如何定义一个绝对的时间范围,或者在一个表格显示查询结果的时间戳?在PromQL中,这样的时间参数是与表达式分开发送到Prometheus查询API的,确切的时间参数取决于你发送的查询类型,Prometheus有种类型的PromQL查询:瞬时查询和区间查询。
11.3.1:瞬时查询
瞬时查询用于表格的视图,你想在一个时间点上显示PromQL查询的结果,一个瞬时查询有以下参数:
1:PromQL表达式
2:一个评估的时间戳
在查询的时候可以选择过滤过去的数据,比如(foo[1h])表示查询foo序列近一小时的数据,访问过去的数据。

瞬时查询可以返回任何有效的PromQL表达式类型(字符串,标量,即时和范围向量)。

下面来看一个瞬时查询的示例,看看它是如何工作的,比如http_requests_total在指定的时间戳来评估表达式,http_requests_total是一个瞬时向量选择器,它可以选择该时间序列的最新样本,最新意味着查询最近5分钟的样本数据。

如果我们在一个有最近样本的时间戳上运行此查询,结果将包含两个序列,每个序列都有一个样本

prometheus_http_requests_total{code="200",job="prometheus",handler="/metrics"}
prometheus_http_requests_total{code="200",job="prometheus",handler="/targets"}

prometheus_http_requests_total{code="200",job="prometheus",handler="/targets"} or prometheus_http_requests_total{code="200",job="prometheus",handler="/metrics"}
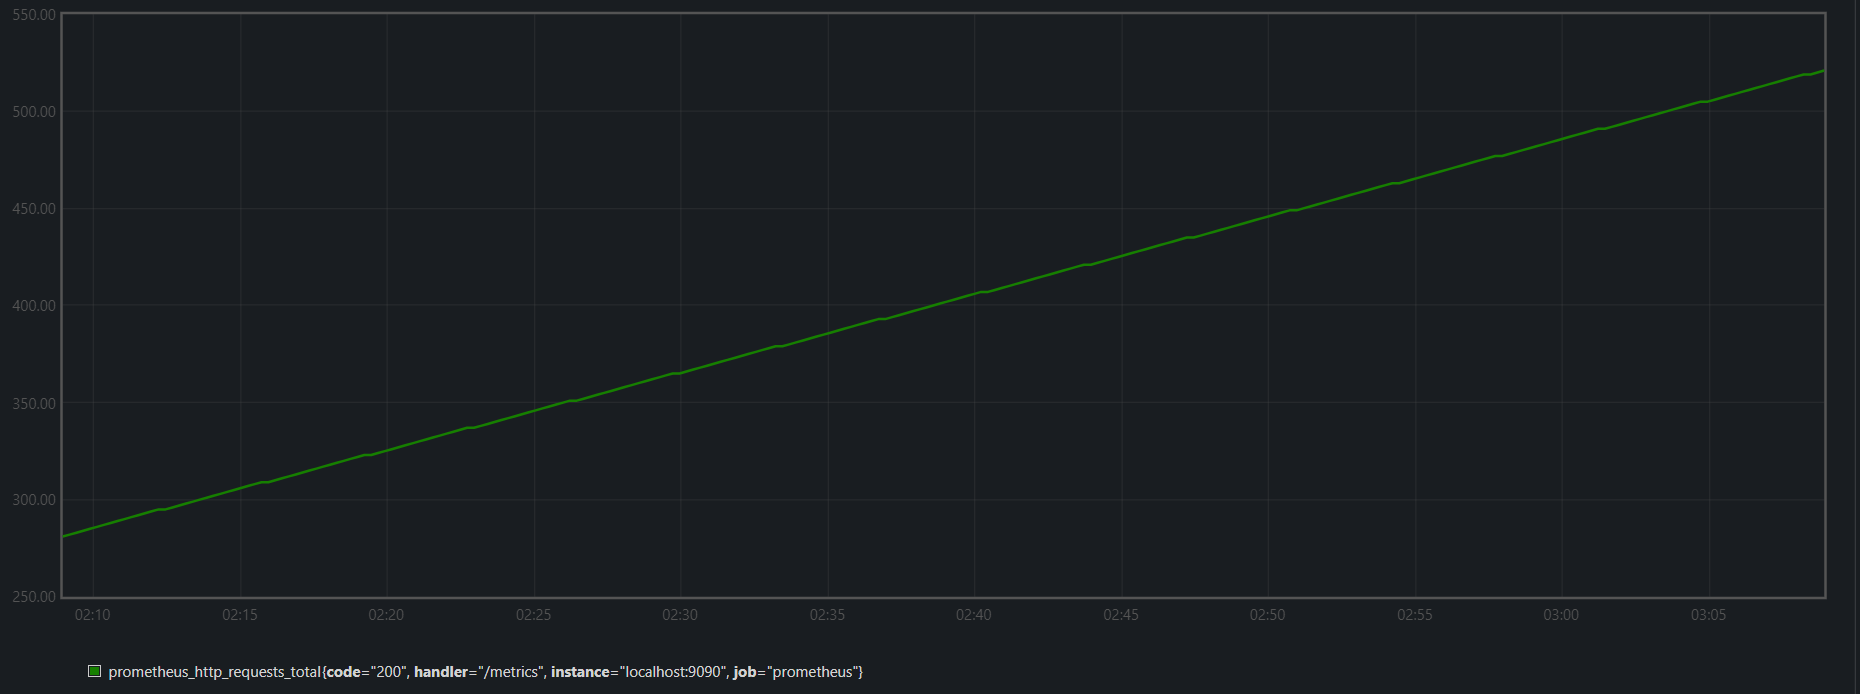
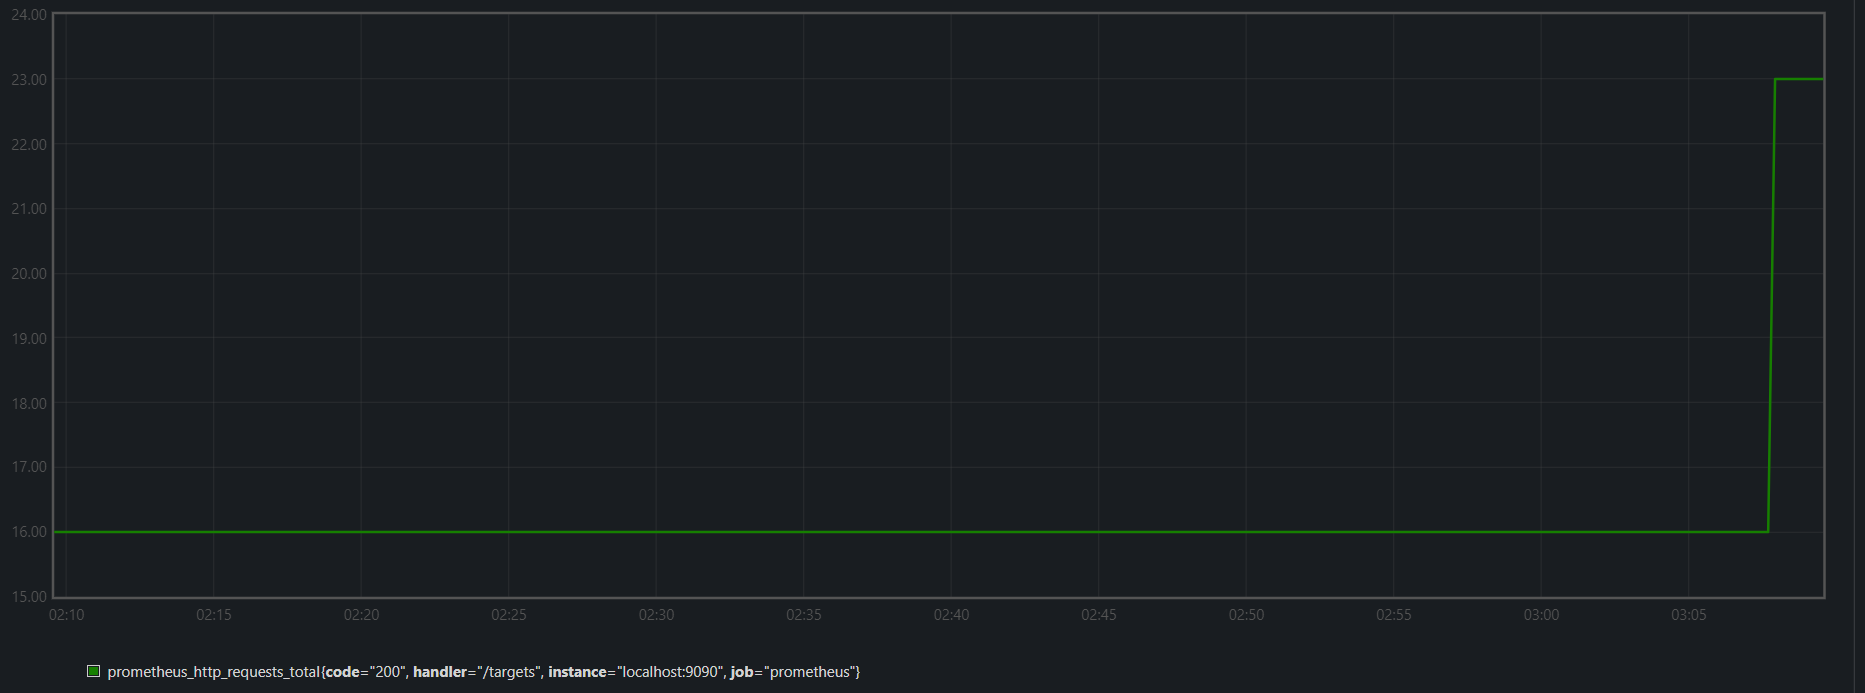
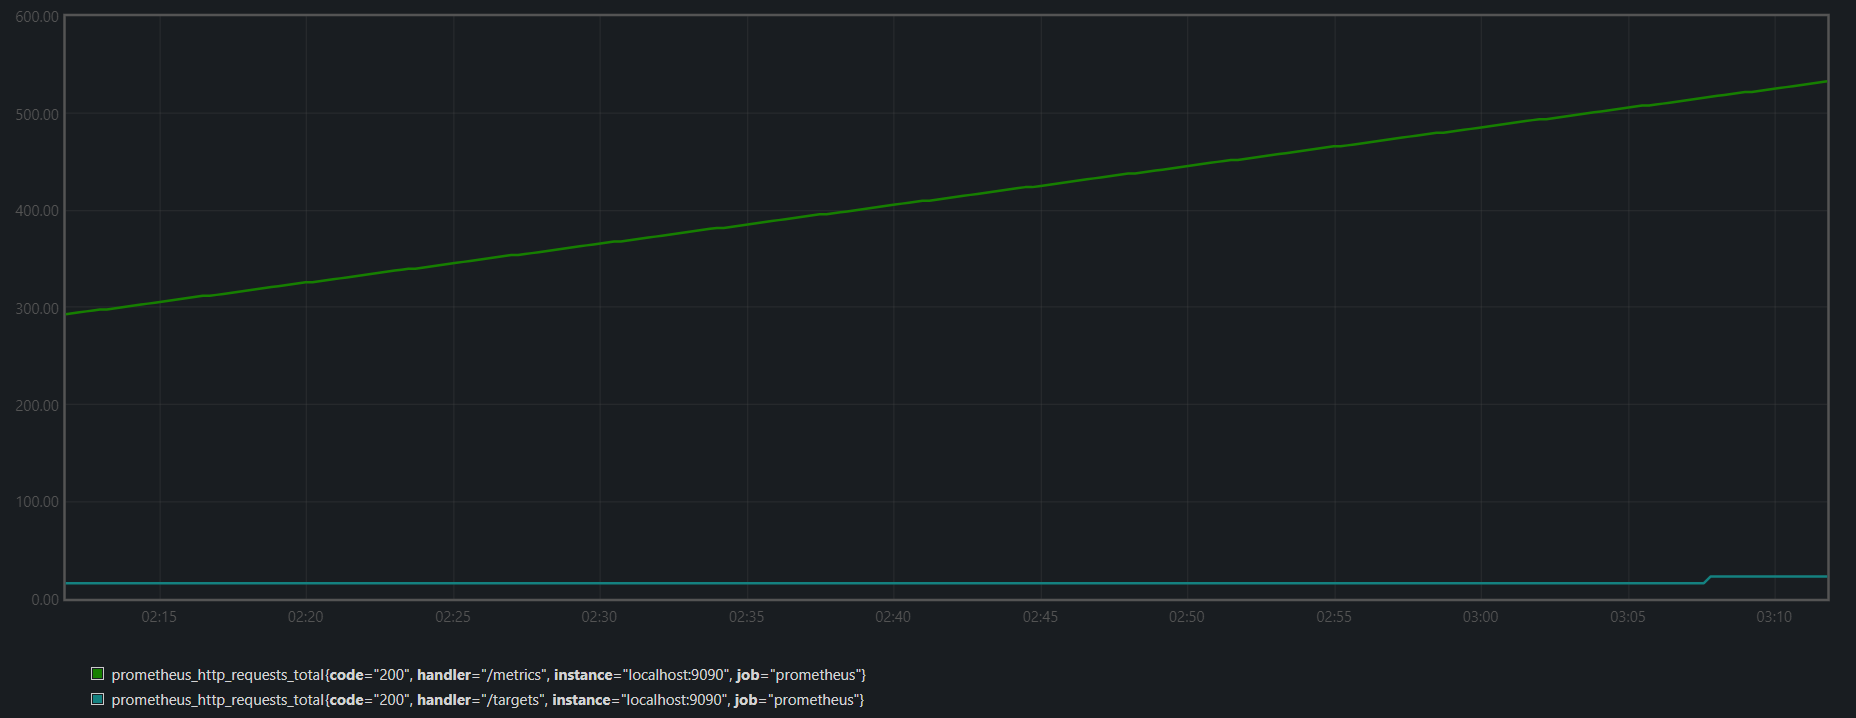
我们可以看到每隔5分钟都会有一个新的数据,但是这个数据也可能是不变的
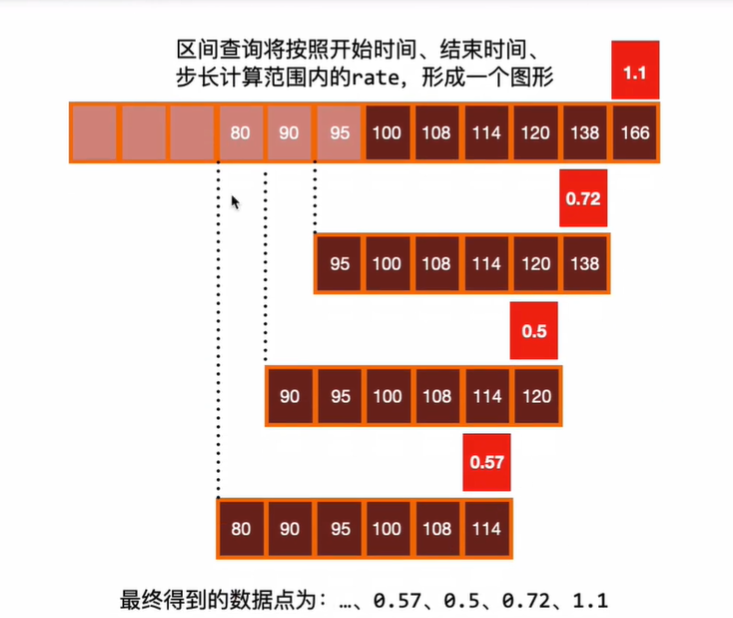
11.3.2:区域查询
区域查询主要用于图形,想在一个指定的时间范围内显示一个PromQL表达式,范围查询的工作方式与即时查询完全相同,这些查询在指定时间范围的评估步中进行评估,当然,这些后台是高度优化的,在这种情况下Prometheus实际上并没有运行许多的独立即时查询,

区间查询包括以下参数:
1:PromQL表达式
2:开始时间
3:结束时间
4:评估步长

在开始时间和结束时间之间每个评估步长上评估表达式后,单独评估的时间被拼接到一个单一的区间向量中。区间查询允许传入瞬时向量类型或者标量类型的表达式,但始终返回一个范围向量(标量和瞬时向量在一个时间范围内被评估的结果)。

注意每个评估步骤的行为与独立的瞬时查询完全一样,而且每个独立的瞬时查询都没有查询的总体范围的概念
11.4:选择时间序列
我们本次主要学习如何用不同的的方式来选择数据,如何在单个时间戳或一段时间范围内基于标签过滤数据,以及如何使用移动时间的方式来选择数据。
11.4.1:过滤指标名称
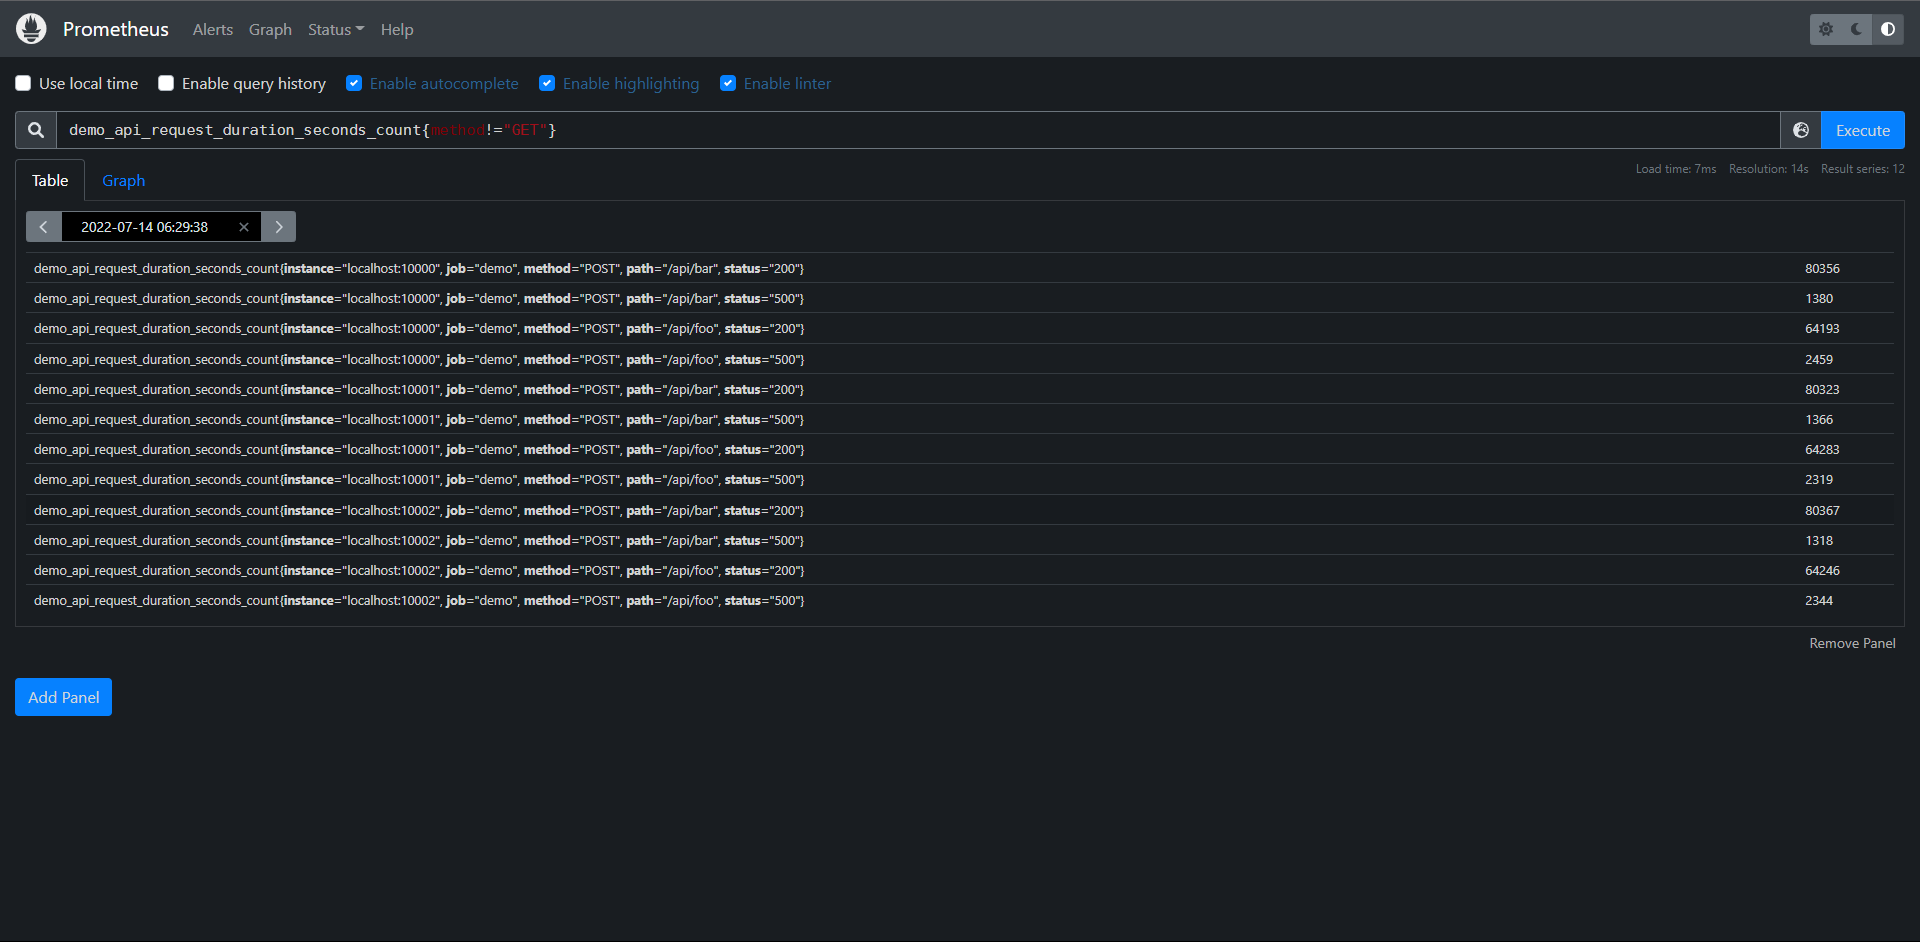
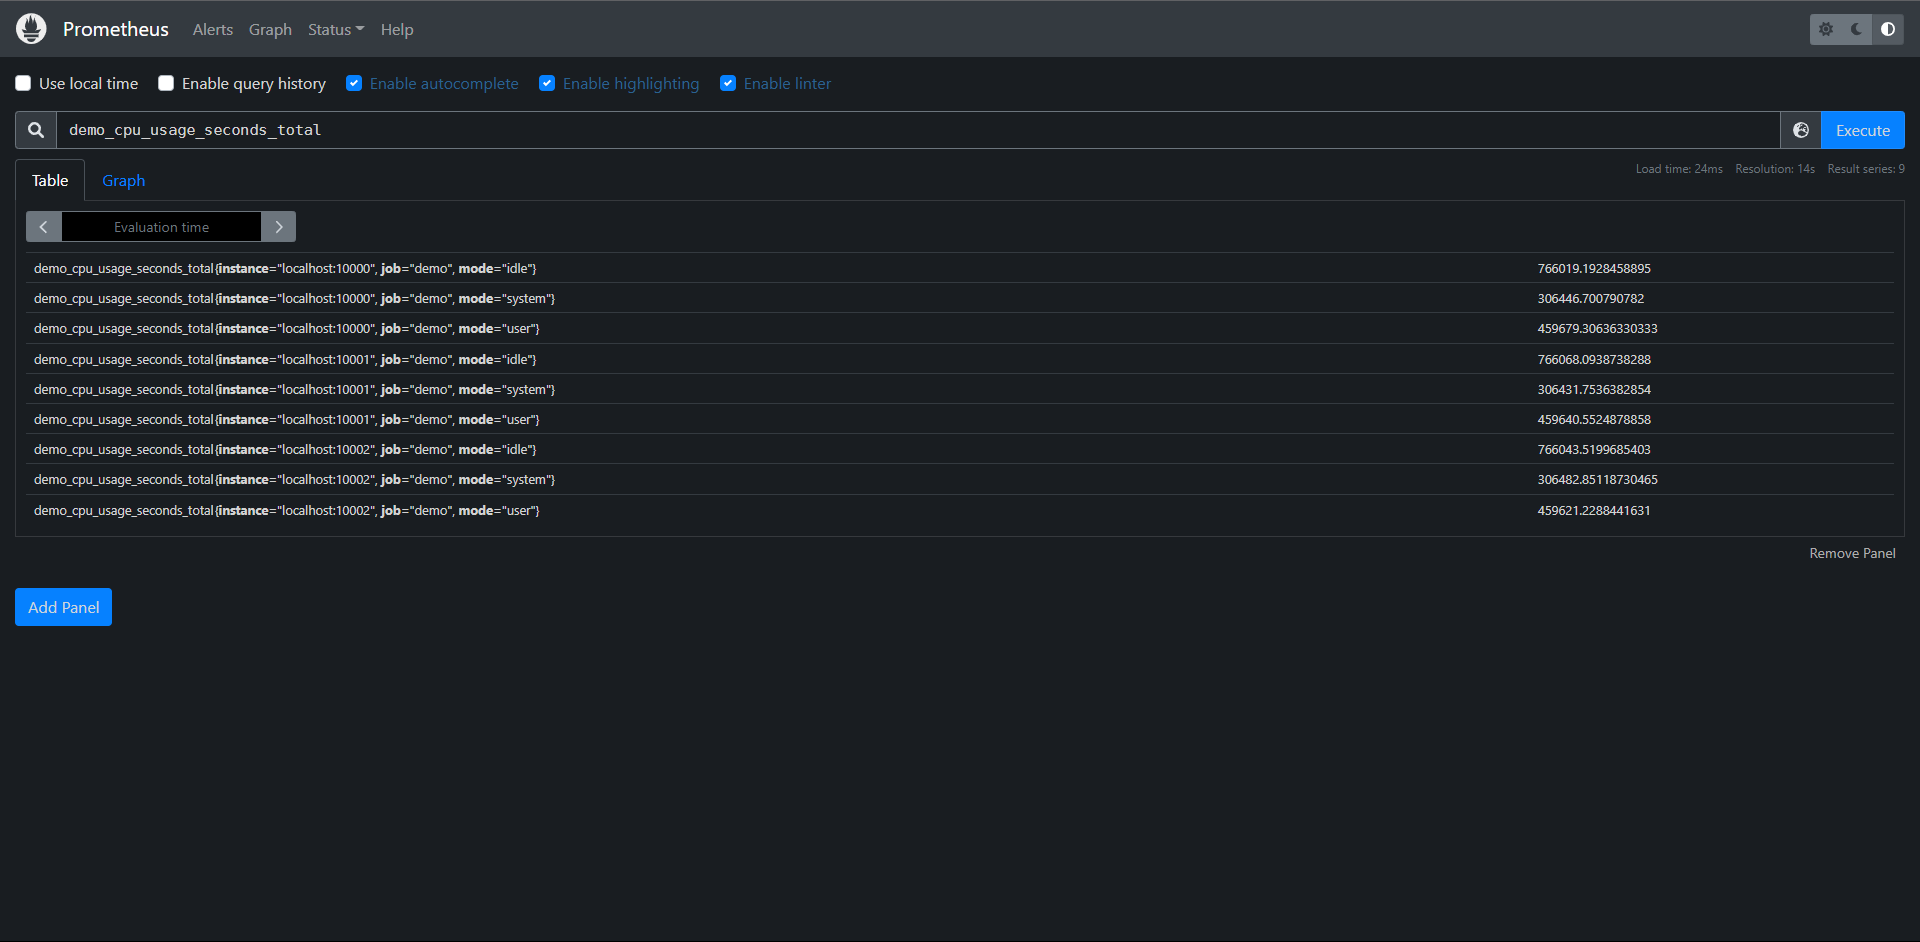
最简单的PromQL查询就是直接选择具有指定标签名称的序列,例如:以下查询将返回所有具有指标名称demo_api_request_duration_seconds_count的序列
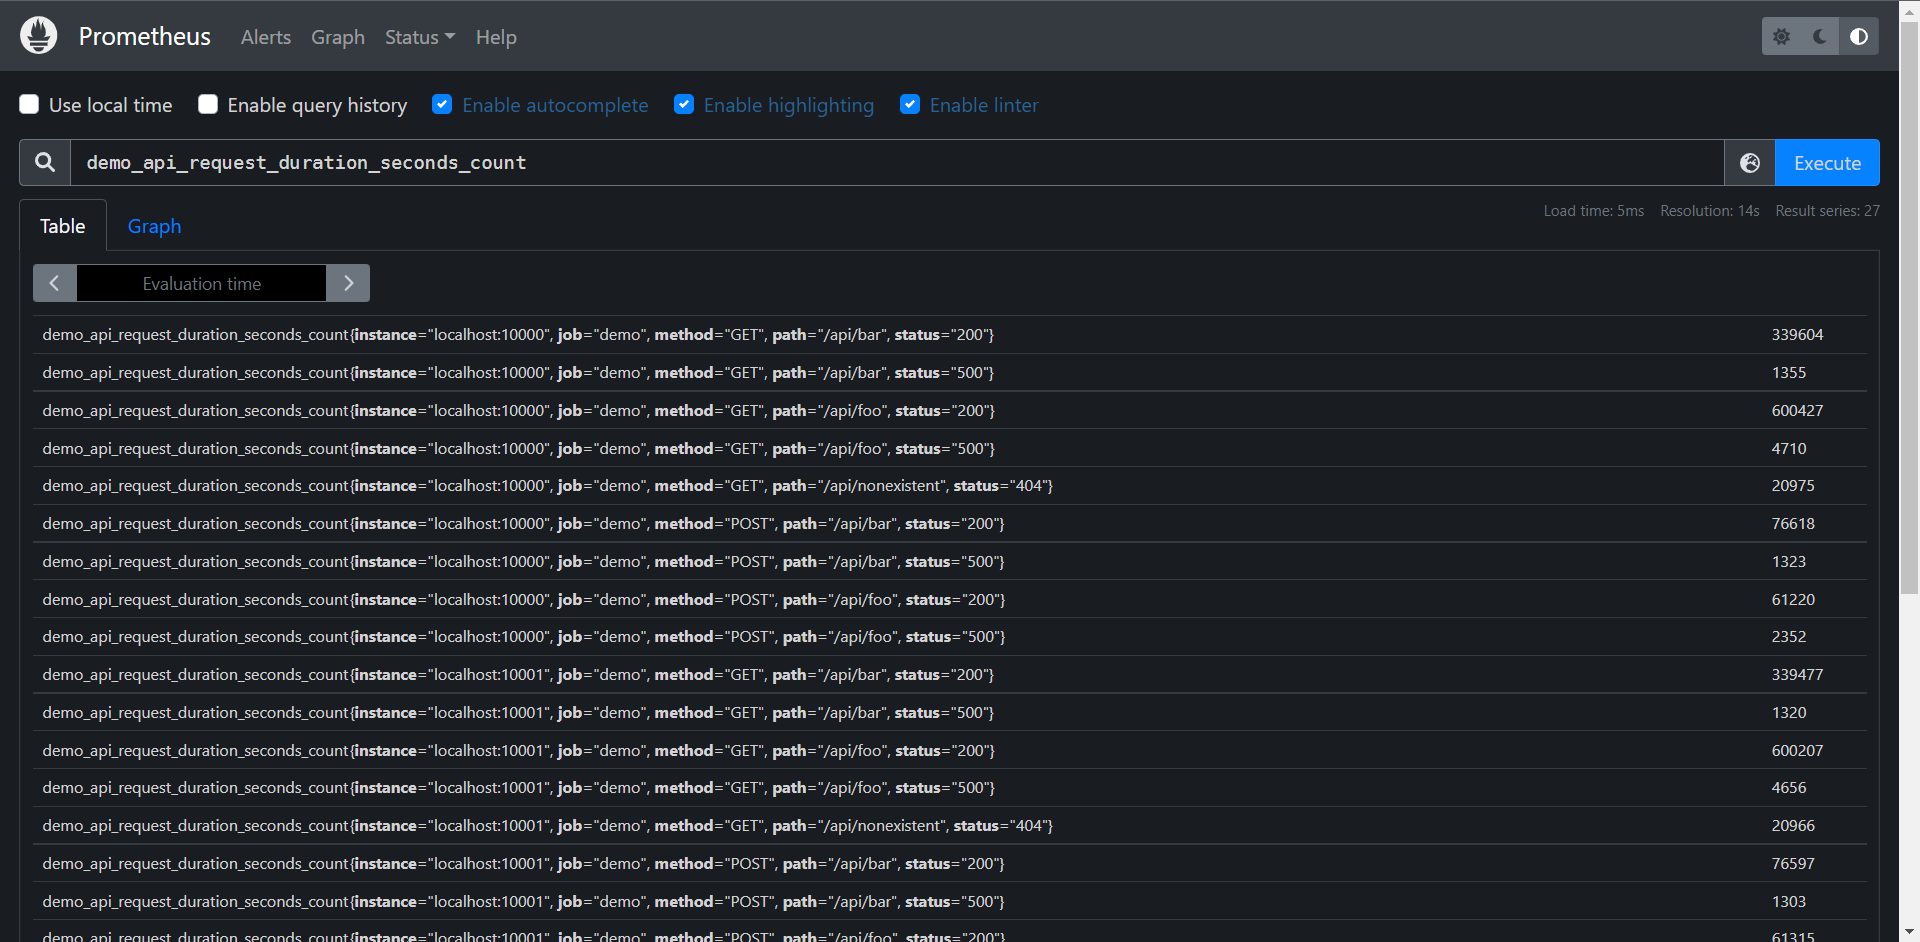
由于数据是demo产生的,所以数据很多,该查询语句会返回许多相同指标名称的序列,但有不同的标签组合instance,job,method,path和status等,输出结果如上所示。
API:http://10.0.0.10:9090/api/v1/query?query=demo_api_request_duration_seconds_count&time=1657779394.469
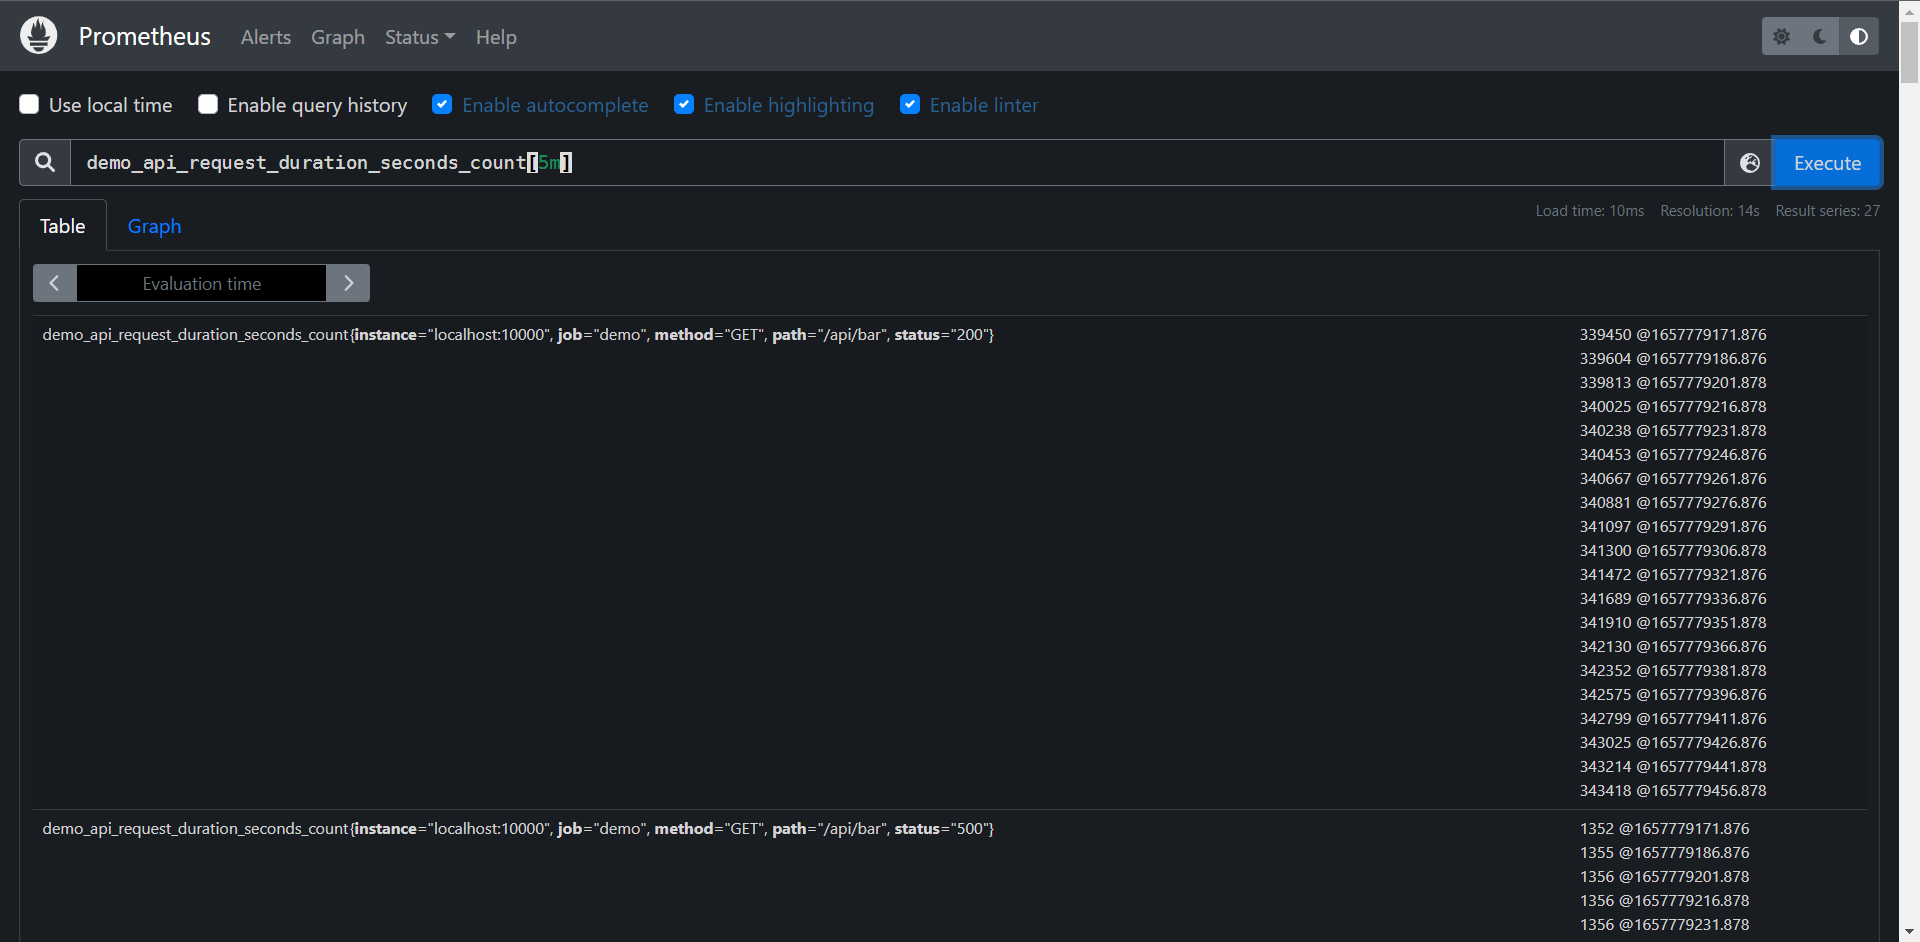
此结果为区间向量
API:http://10.0.0.10:9090/api/v1/query_range?query=demo_api_request_duration_seconds_count&start=1657775949.043&end=1657779549.043&step=14

当我们访问Graph的时候API会发生变化,因为是一个区间,所以要有始有终的
这里就是区间查询了
# 过滤全部 method为 GET的数据
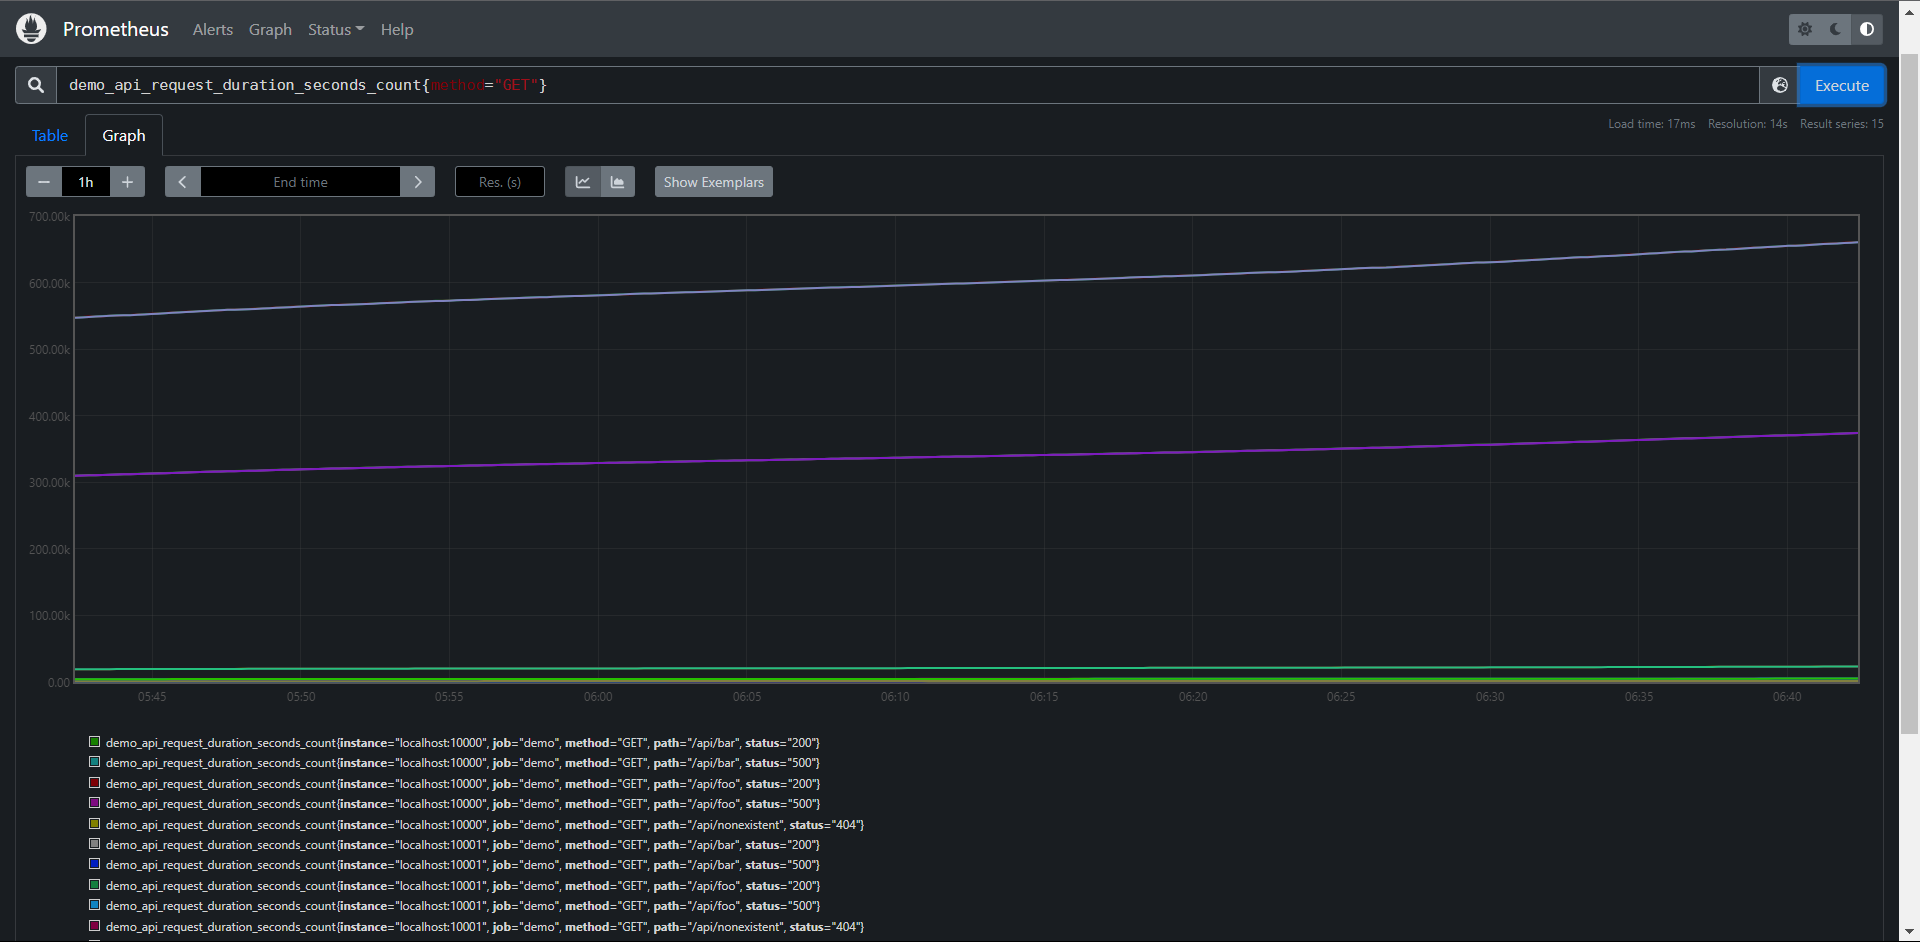
PromQL:demo_api_request_duration_seconds_count{method="GET"}
PromQL:{__name__="demo_api_request_duration_seconds_count",method="GET"}
结果:如上图
# 过滤多个标签,使用","来分割多个条件
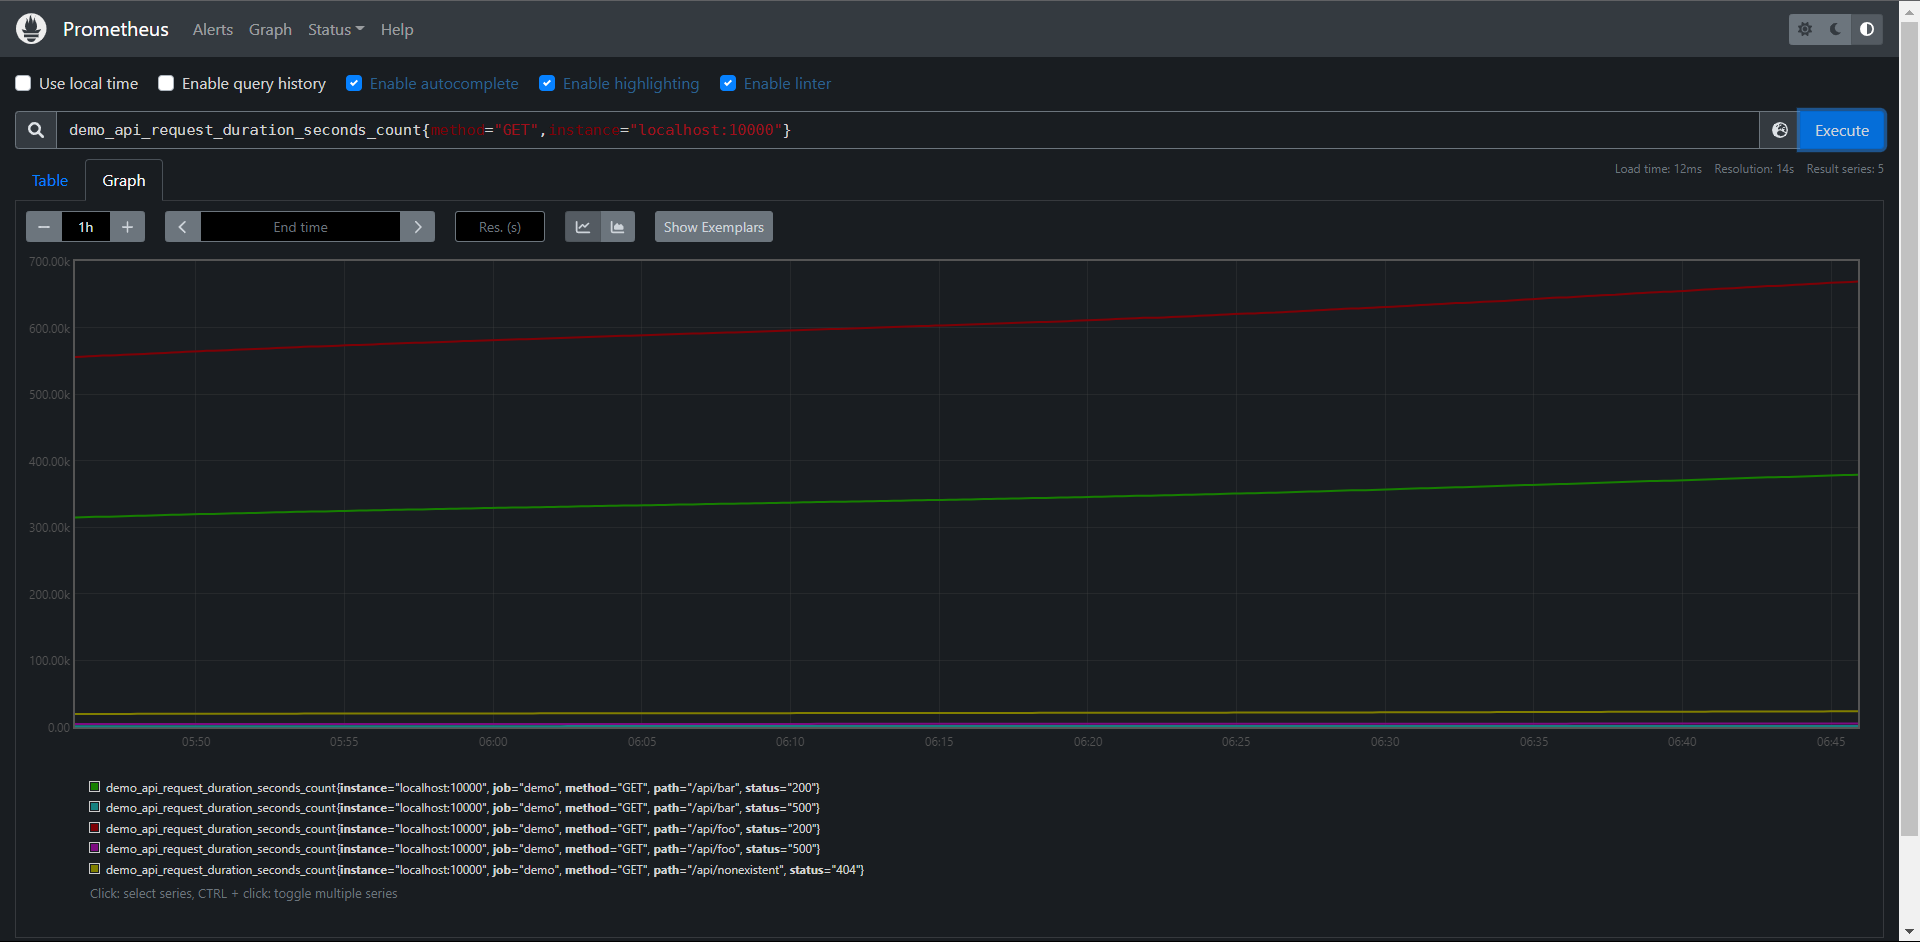
PromQL:demo_api_request_duration_seconds_count{method="GET",instance="localhost:10000"}
PromQL:{__name__="demo_api_request_duration_seconds_count",method="GET",instance="localhost:10000"}
结果:如上图
# 注意:组合使用多条件匹配的时候需要所有的条件都必须满足的时间序列。

除了相等之外的,Prometheus还支持其他的几种匹配器类型
0:= :等于
1:!=:不等于
2:=~:正则表达式匹配
3:!~:正则表达式不匹配
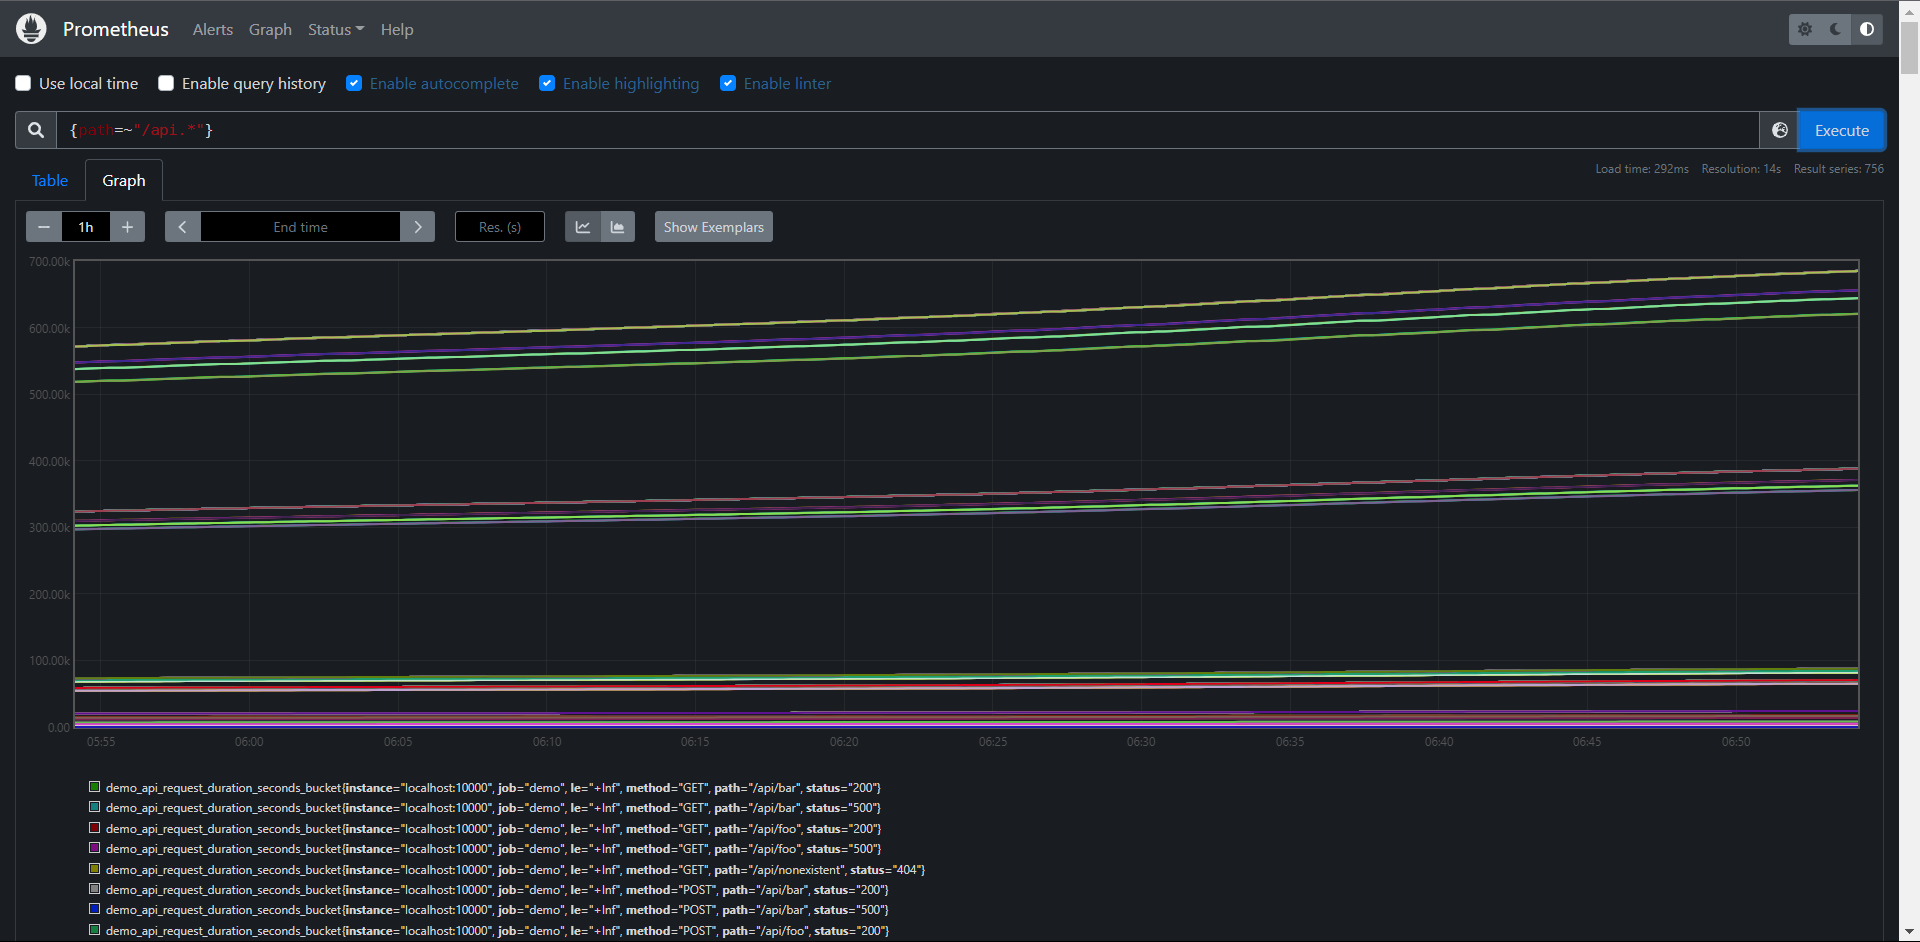
甚至我们可以完全省略指标名称,比如查询所有path标签的以/api开头的所有序列,但是该查询会查询到具有不同指标名的序列
PromQL:{path=~"/api.*"}
结果:如上图
使用不等于来过滤想要的数据
PromQL:demo_api_request_duration_seconds_count{method!="GET"}
PromQL:{__name__="demo_api_request_duration_seconds_count",method != "GET"}
结果:如上图
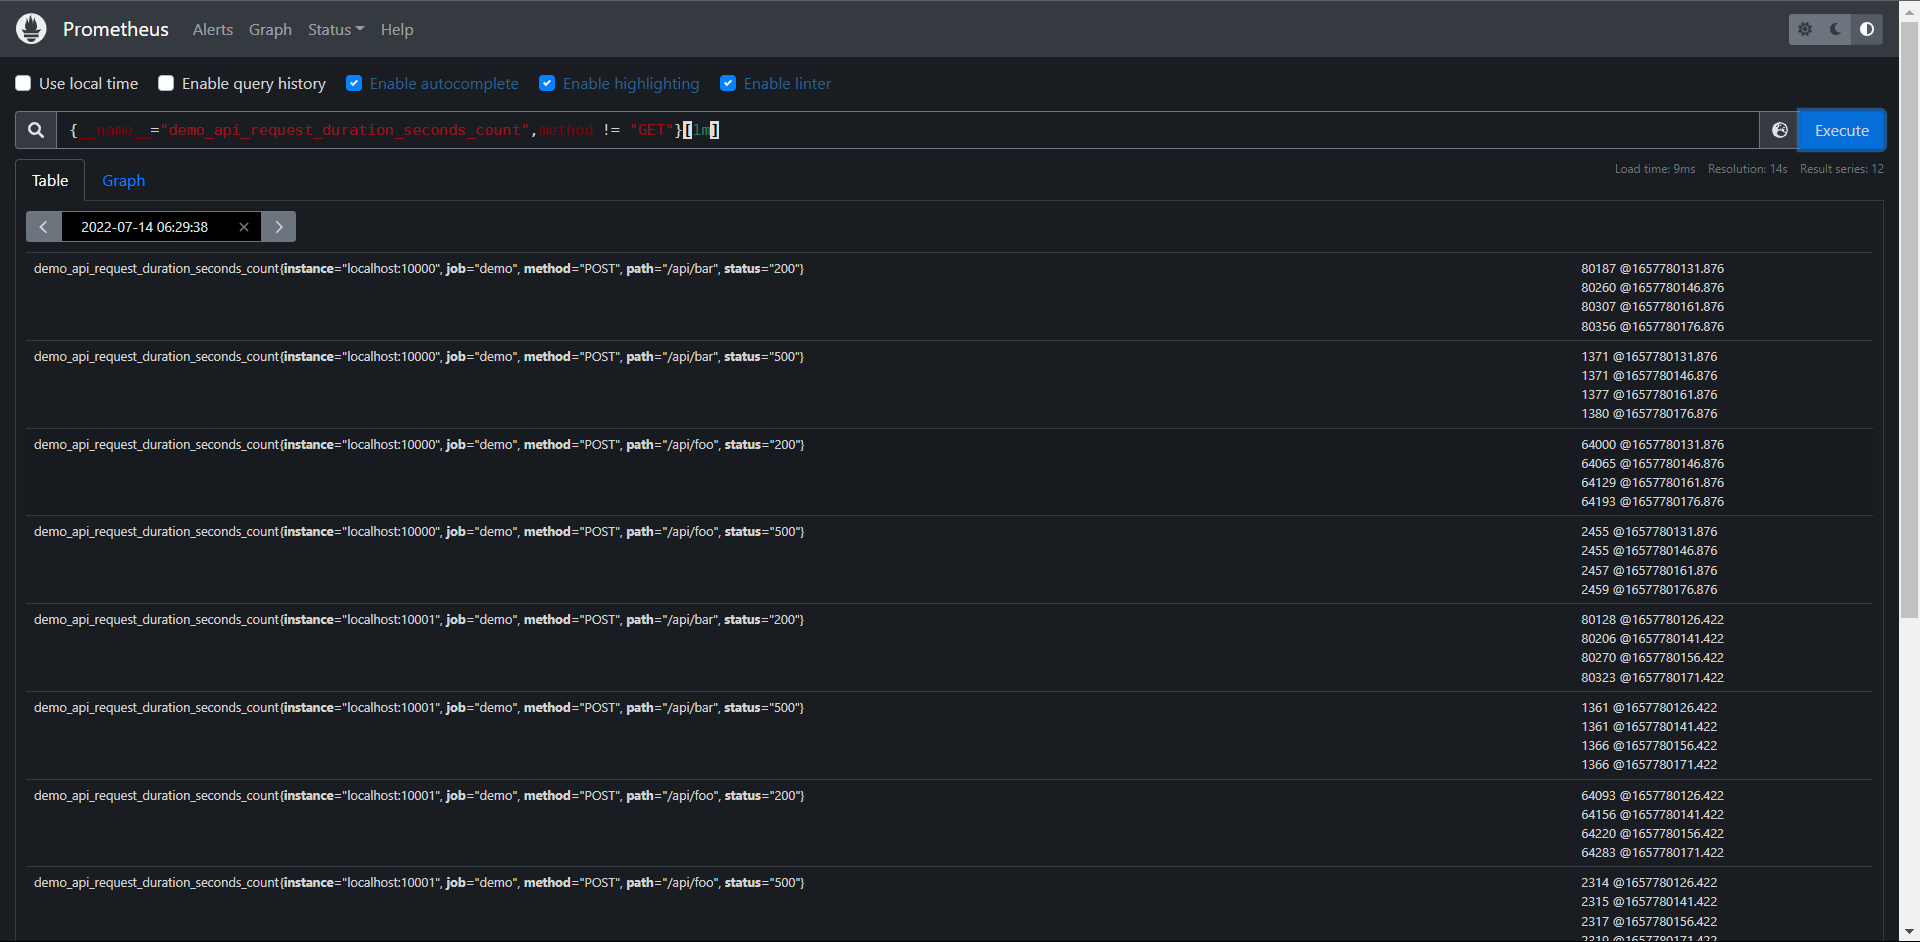
因为部分函数可能要求的是你需要传递一个区间向量,所以你需要添加一个时间,# 无法取Graph
PromQL:demo_api_request_duration_seconds_count{method != "GET"}[1m]
PromQL:{__name__="demo_api_request_duration_seconds_count",method != "GET"}[1m]
结果:如上图
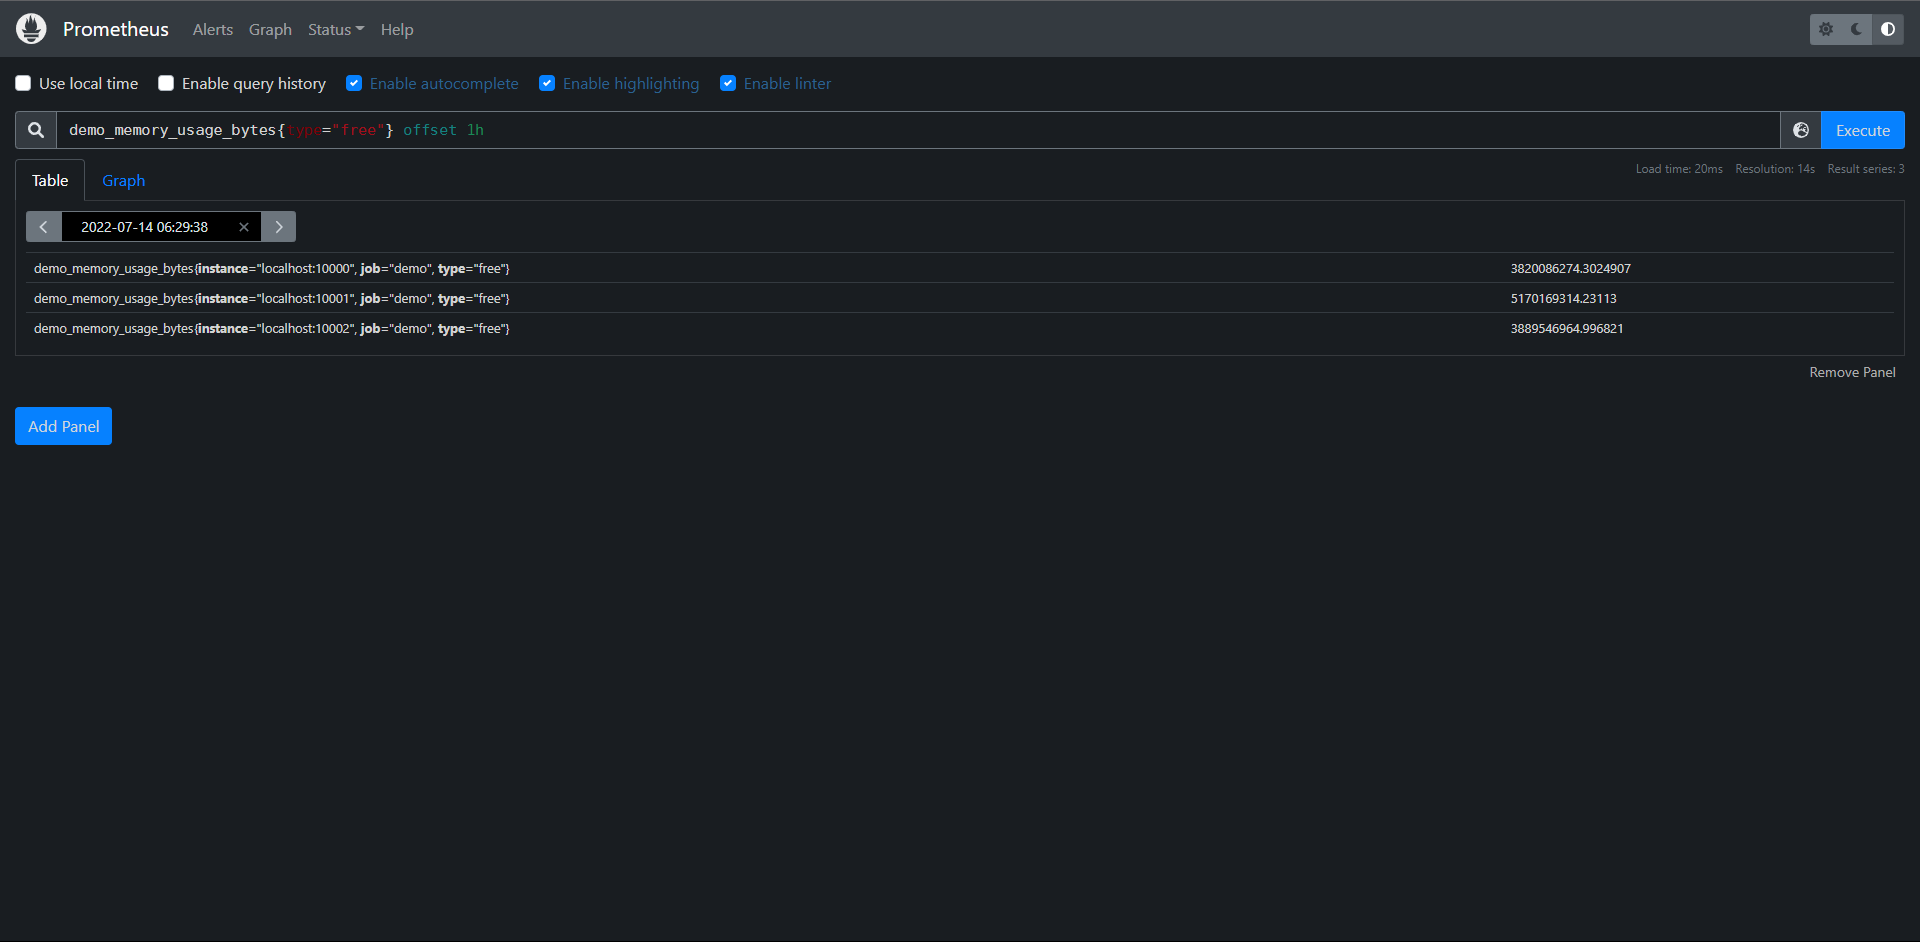
使用offset <time>来查询过去一小时之前的数据,# 可获取Graph
PromQL:demo_memory_usage_bytes{type="free"} offset 1h
PromQL:{__name__="demo_memory_usage_bytes",type="free"} offset 1h‘
结果:如上图
# 练习:
1:构建一个查询,选择所有的时间序列
PromQL:{__name__=~".+"}
PromQL:{job != ""}
2:构建一个查询,查询所有指标名为demo_api_request_duration_seconds_count并且method标签不为POST的序列
PromQL:demo_api_request_duration_seconds_count{method!="POST"}
PromQL:{__name__="demo_api_request_duration_seconds_count",method!="POST"}
3:使用demo_memory_usage_bytes指标查询一小时前的一分钟时间范围的可用空闲内存
PromQL:demo_memory_usage_bytes{type="free"}[1m] offset 1h
PromQL:{__name__="demo_memory_usage_bytes",type="free"}[1m] offset 1h
11.5:变化率
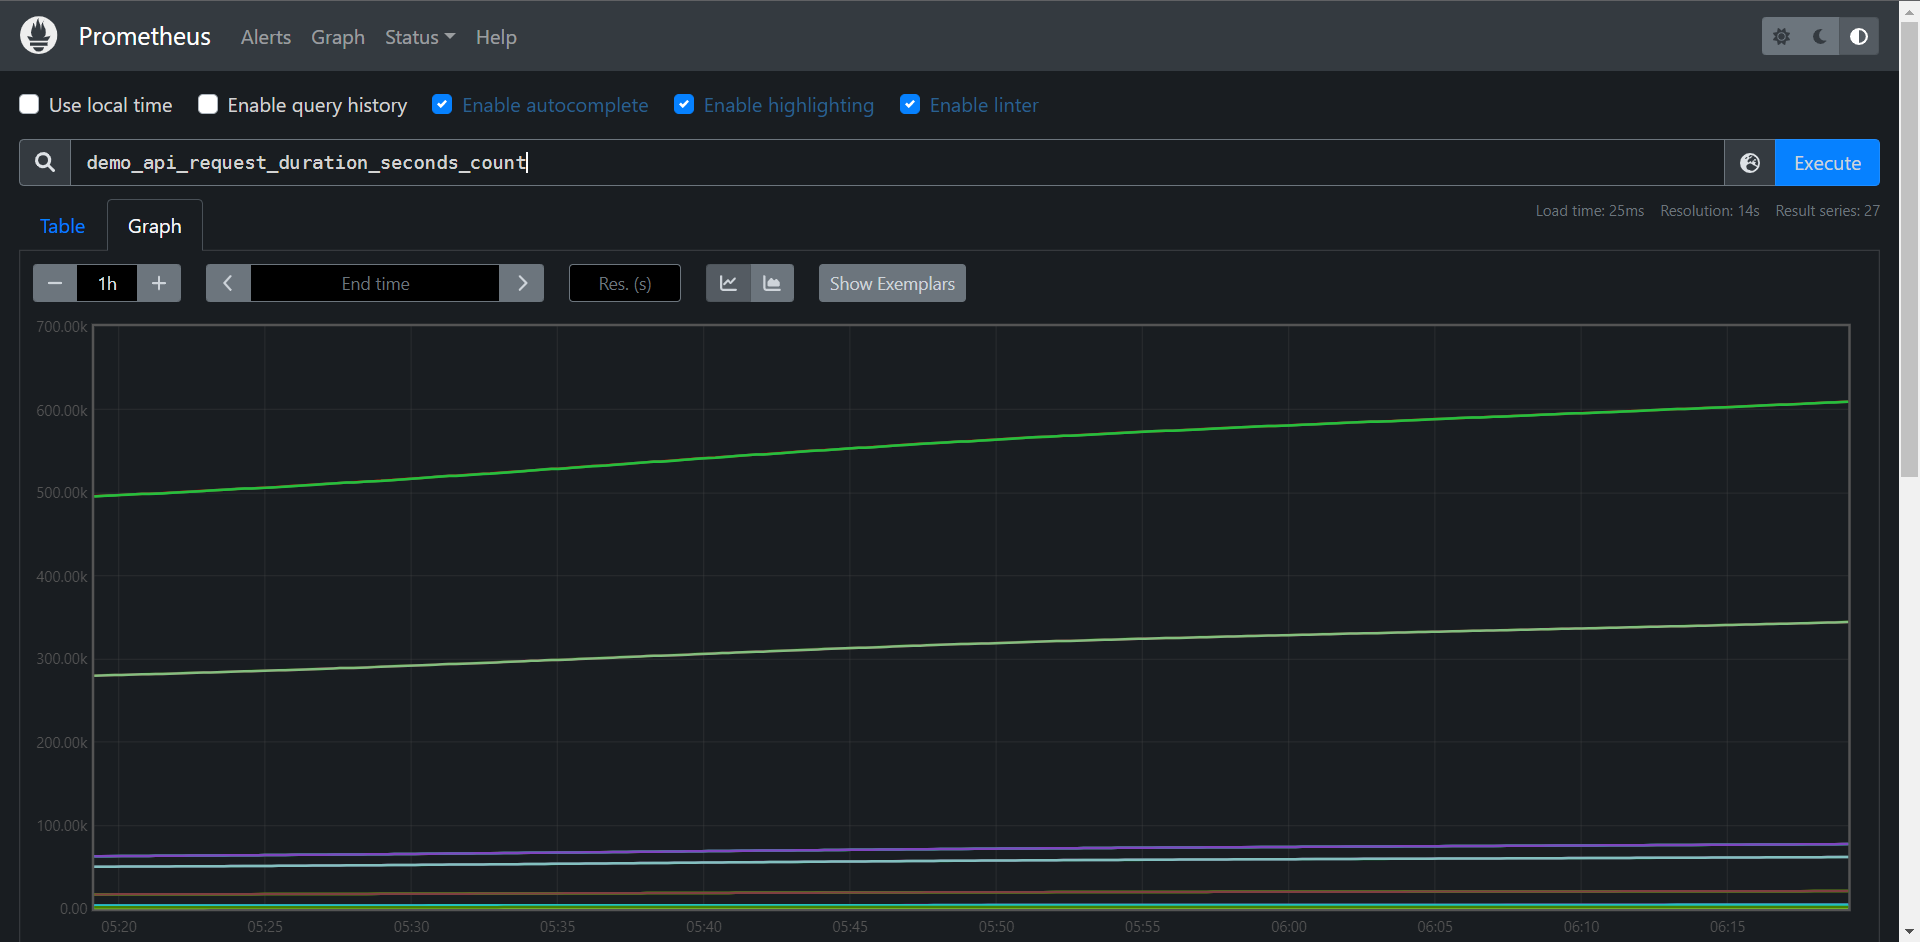
通常来说直接绘制一个Counter类型的指标数据用处不大,因为它们会一直增加,一般来说是不会去直接关心这个数值的,因为Counter一旦重置,总计数就没有意义了,比如我们直接执行下面的查询语句。

demo_api_request_duration_seconds_count{job="demo"}

可以获得以下所示图形
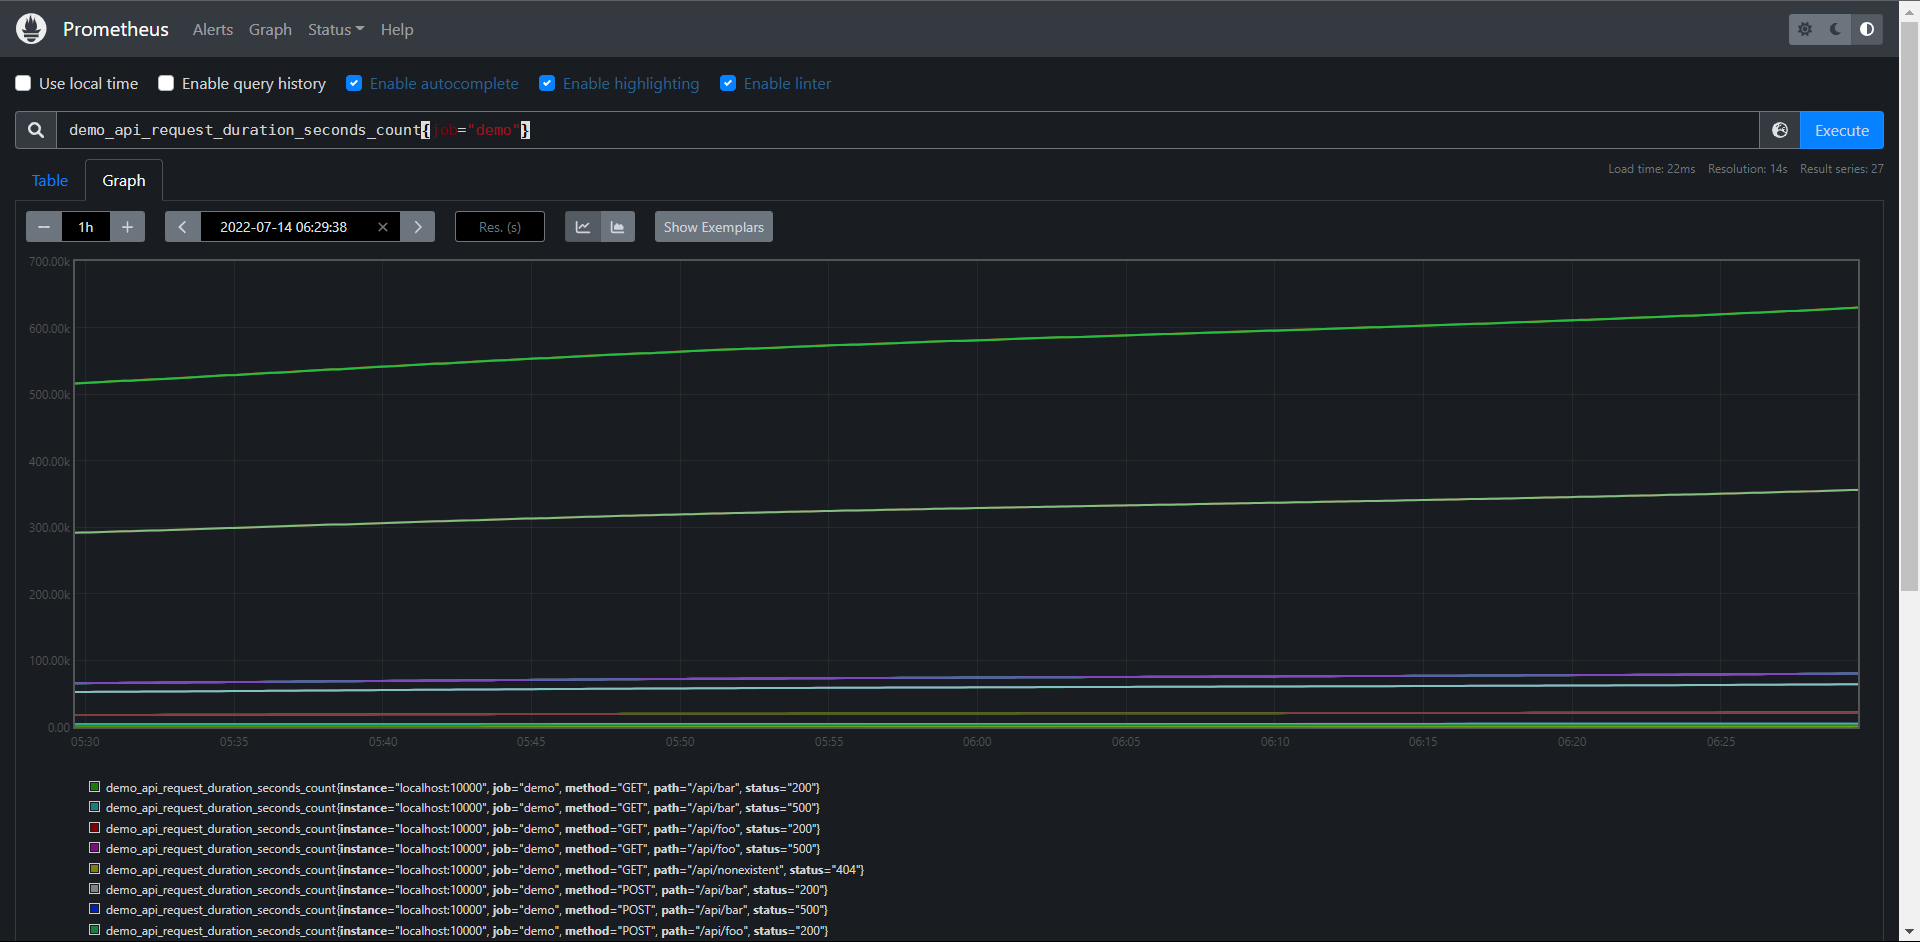
可以看到所有的都是不断增长的,一般来说我们更想知道Counter的指标变化率,PromQL提供了不同的函数来计算变化率。
11.5.1:rate()
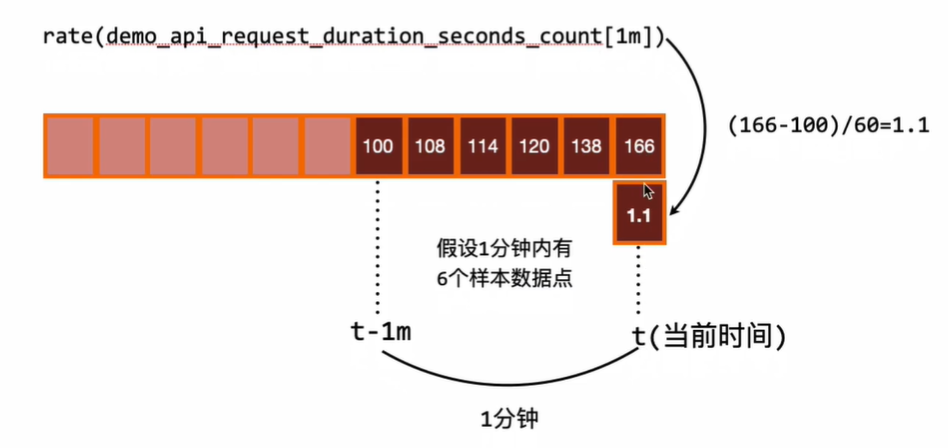
用于计算变化率最常见的函数rate(),rate()函数用于计算在指定的时间范围内计时器每秒增加量的平均值,因为是计算一个时间范围的平均值,所以我们需要在序列选择器之后添加一个范围选择器。
例如:我们要计算demo_api_request_duration_seconds_count在最近5分钟内的每秒平均变化率,则可以使用下面的查询

PromQL:rate(demo_api_request_duration_seconds_count[5m])
PromQL:rate({__name__="demo_api_request_duration_seconds_count"}[5m])
获得以下图形:
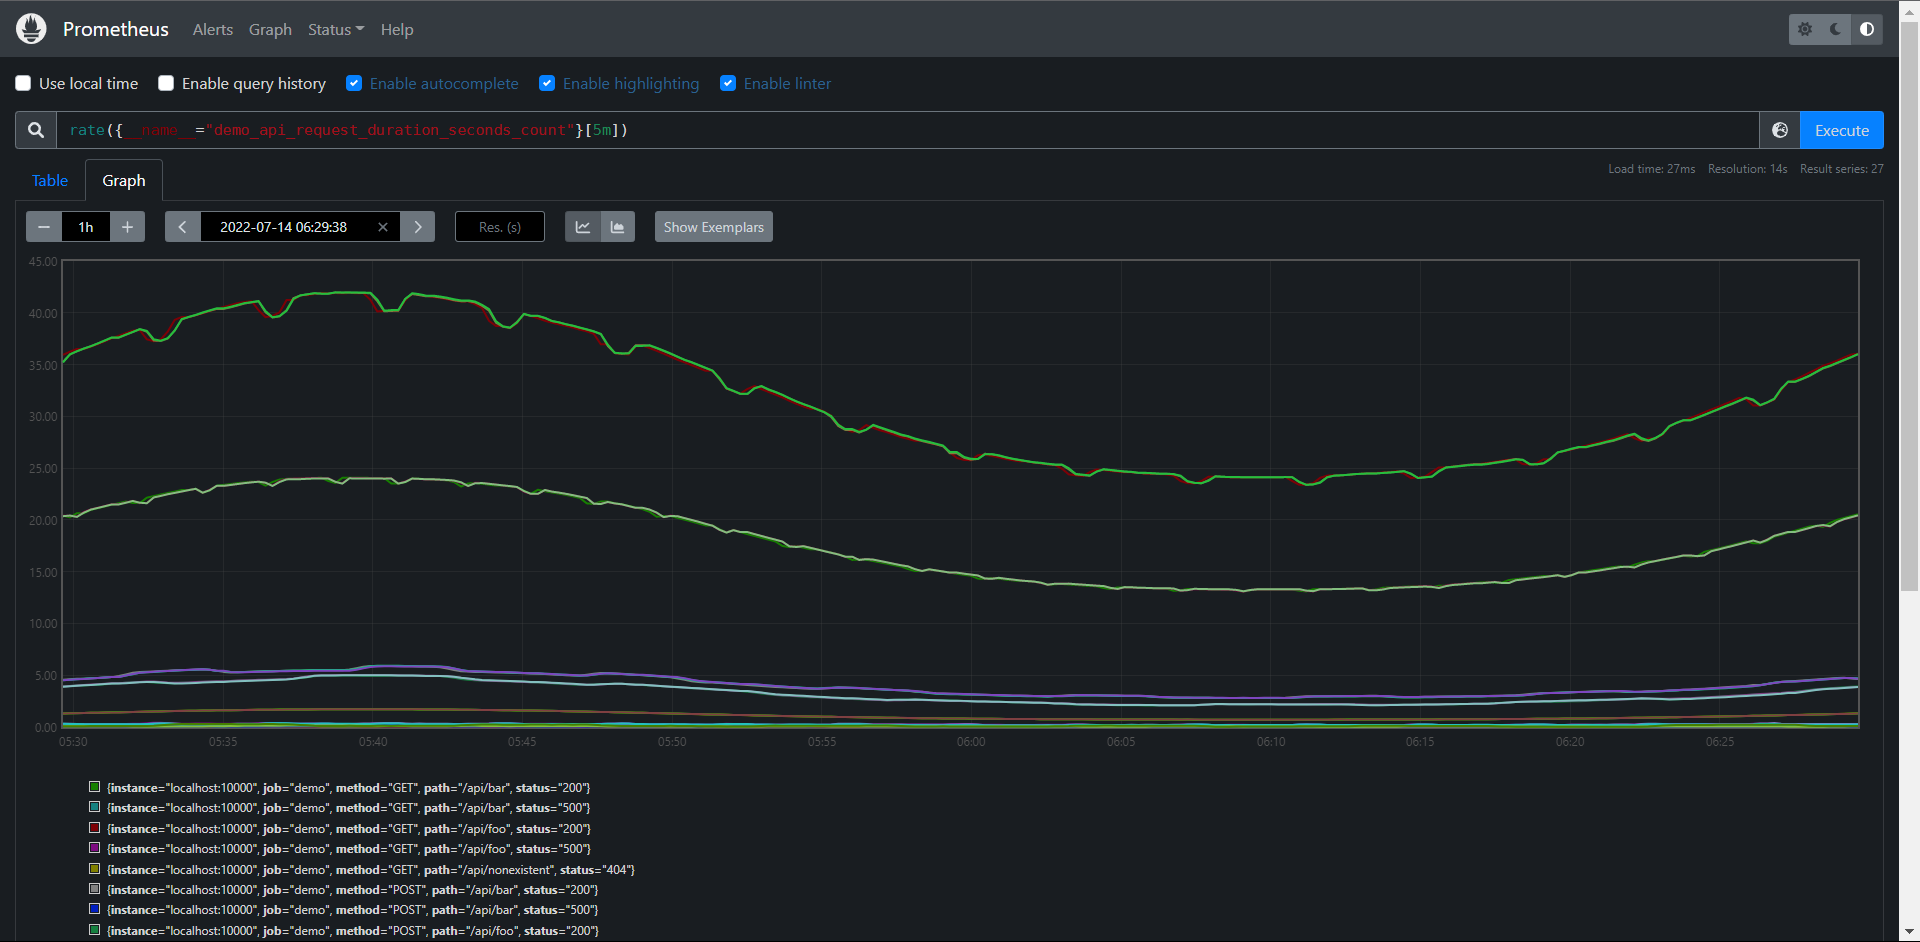
现在绘制出来的图就很有意义了,进行rate计算的时候是选择指定时间范围下第一个和最后一个样本进行计算
往往我们需要绘制一个图形,那么就需要进行区间查询,指定一个时间范围内进行多次计算,将结果串联起来形成一个图形。
关于rate()函数和相关函数几个需要说明:
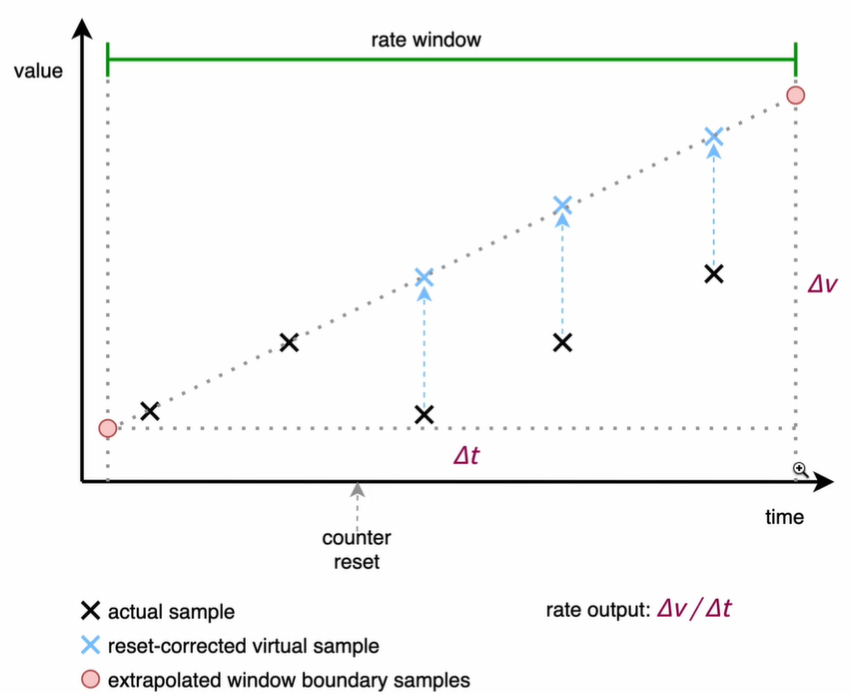
1:当前被抓取指标的进程重启时,Counter指标可能会被重置为0,但是rate()函数会自动处理这个问题,它会假设Counter指标的值只是减少了就认为是被重置了,然后它可以调整后续的样本,例如:如果时间序列为[5,10,4,6],则将其视为[5,10,14,16]。
2:变化率是从指定的时间范围下的包含的样本进行计算的,需要注意的是这个时间窗口的边界并不一定就是一个样本数据,可能会不完全对齐,所以,即使对于每次都是增加整数的Counter,也可能计算结果为非整数。
另外我们需要注意当把rate()与一个聚合运算符(例如:sum()或者一个随时间聚合的函数(任何以_over_time结尾的函数)结合起来使用时,总是先取用reate()函数,然后再进行聚合,否则,当你的目标重新启动时,rate()函数无法检测到Counter的重置)

# 注意:rate()函数需要在指定窗口下至少有两个样本才能计算出,一般来说,比较好的做安防就是选择范围窗口大小至少时抓取间隔的4倍,也就是需要4个样本端点,这样即使在遇到窗口对齐或抓取故障时也有可以使用的样本进行运算,例如:对于1分钟的抓取间隔,你可以使用4分钟的rate计算,但是通常将其四舍五入为5分钟,所以如果使用query_range区间查询,例如在绘图中,那么范围应该至少是步长的大小,否则会丢失一些数据。
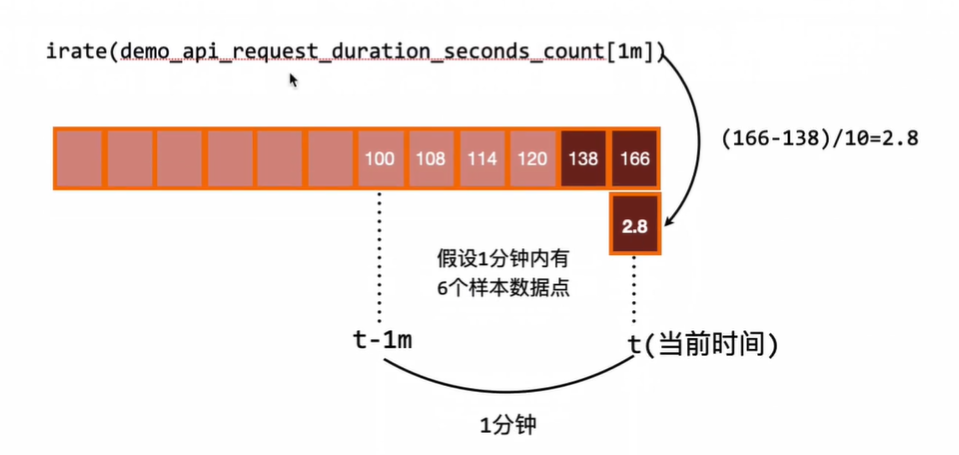
11,5,2:irate()
由于rate或者increase函数去计算样本的平均增长率,容易陷入长尾问题中,其无法反应在时间敞口内样本数据的突发变化,

例如,对于主机而言在2分钟的时间窗口内,可能在某一个由于访问量或者其他问题导致CPU占用100%的情况,但是通过计算在时间窗口内的平均增长率却无法反应出该问题。

为了解决该问题,PromQL提供了另外一个灵敏度更高的函数irate(v range-vector).irate同样用于计算区间向量的计算率,但其反应的是瞬时增长率。

irate函数是通过区间向量中最后两个样本数据来计算区间向量的增长率,这种方式可以避免在时间窗口范围内的长尾问题,并且体现出更好的灵敏度,通过irate函数绘制的图表能够更好的反应样本数据的瞬时变化状态,那既然是使用最后两个点计算,那为什么还要指定类似于[1m]的时间范围呢?这个[1m]不是用来计算的,irate在计算的时候会最多向在[1m]范围内找点,如果超过[1m]没有找到数据点,这个点的计算就放弃了。
由于rate()提供了更平滑的结果,因此在长期趋势分布或者告警中更推荐rate函数,因为当速率只出现一个短暂的峰值时,不应该触发告警。
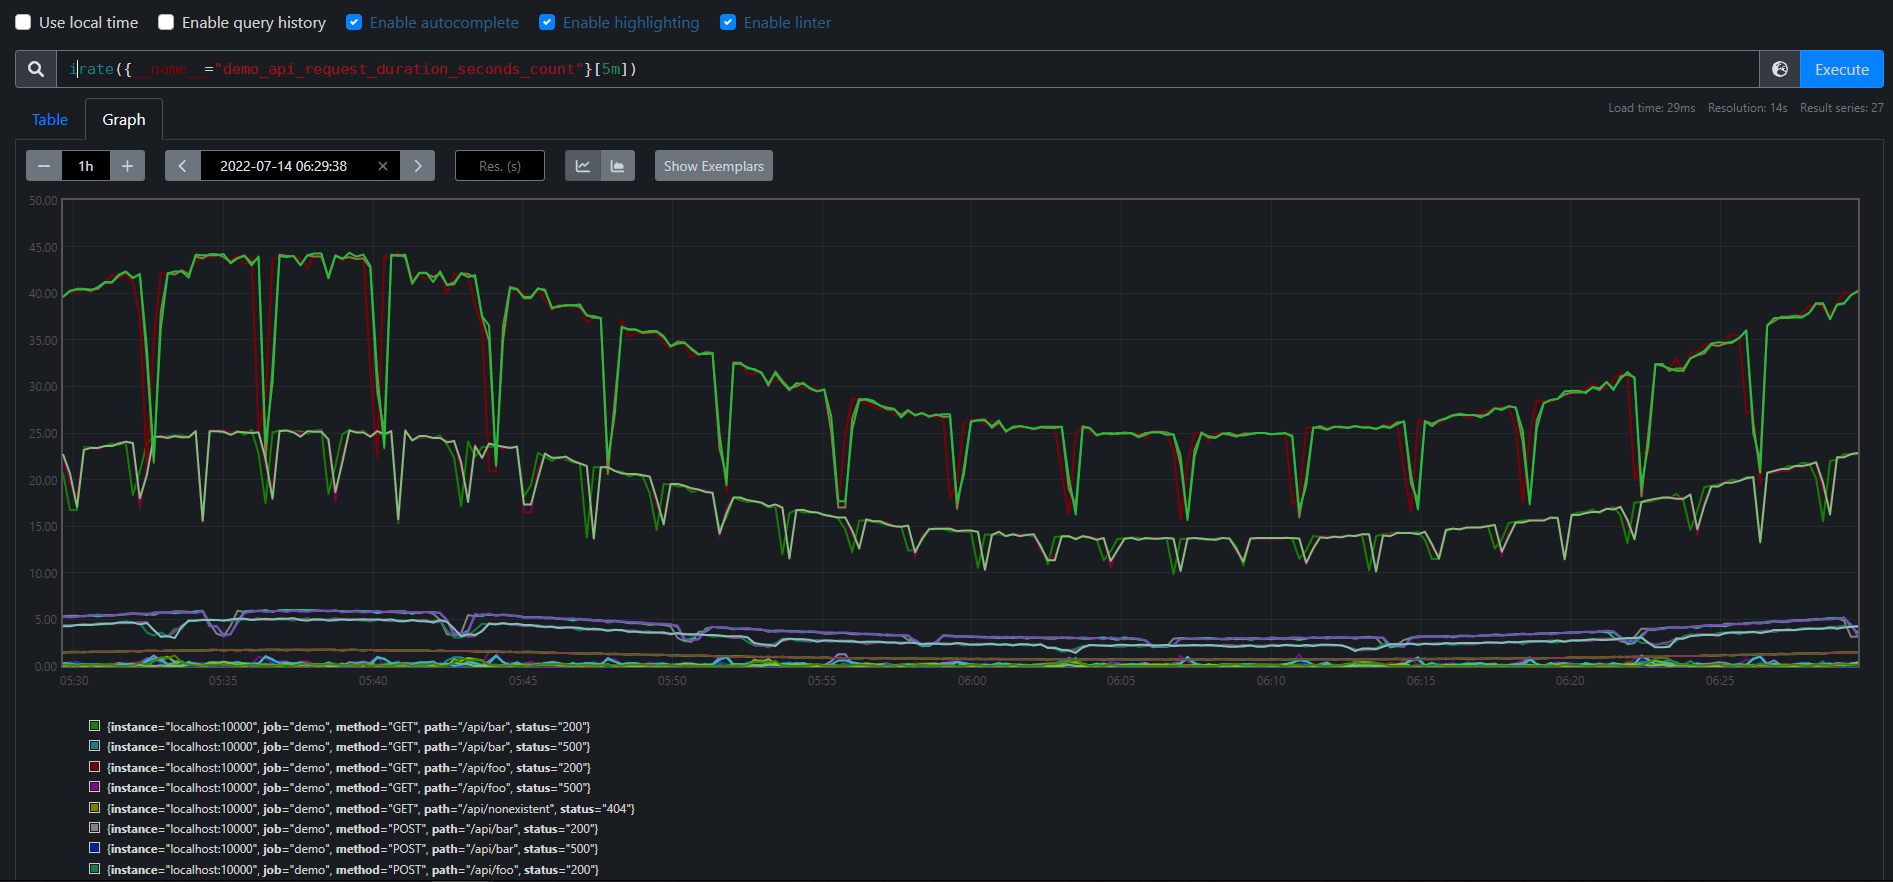
使用irate()函数上面的表达式会出现一些短暂的下降的图形:
PromQL:irate(demo_api_request_duration_seconds_count{job="demo"}[5m])
11.5.2:increase()
除了计算每秒速率,你还可以使用increase()函数查询指定时间范围内的总增量,它基本上相当于速率乘以时间范围选择器中的秒数。

PromQL:increase({__name__="demo_api_request_duration_seconds_count",job="demo"}[1h])
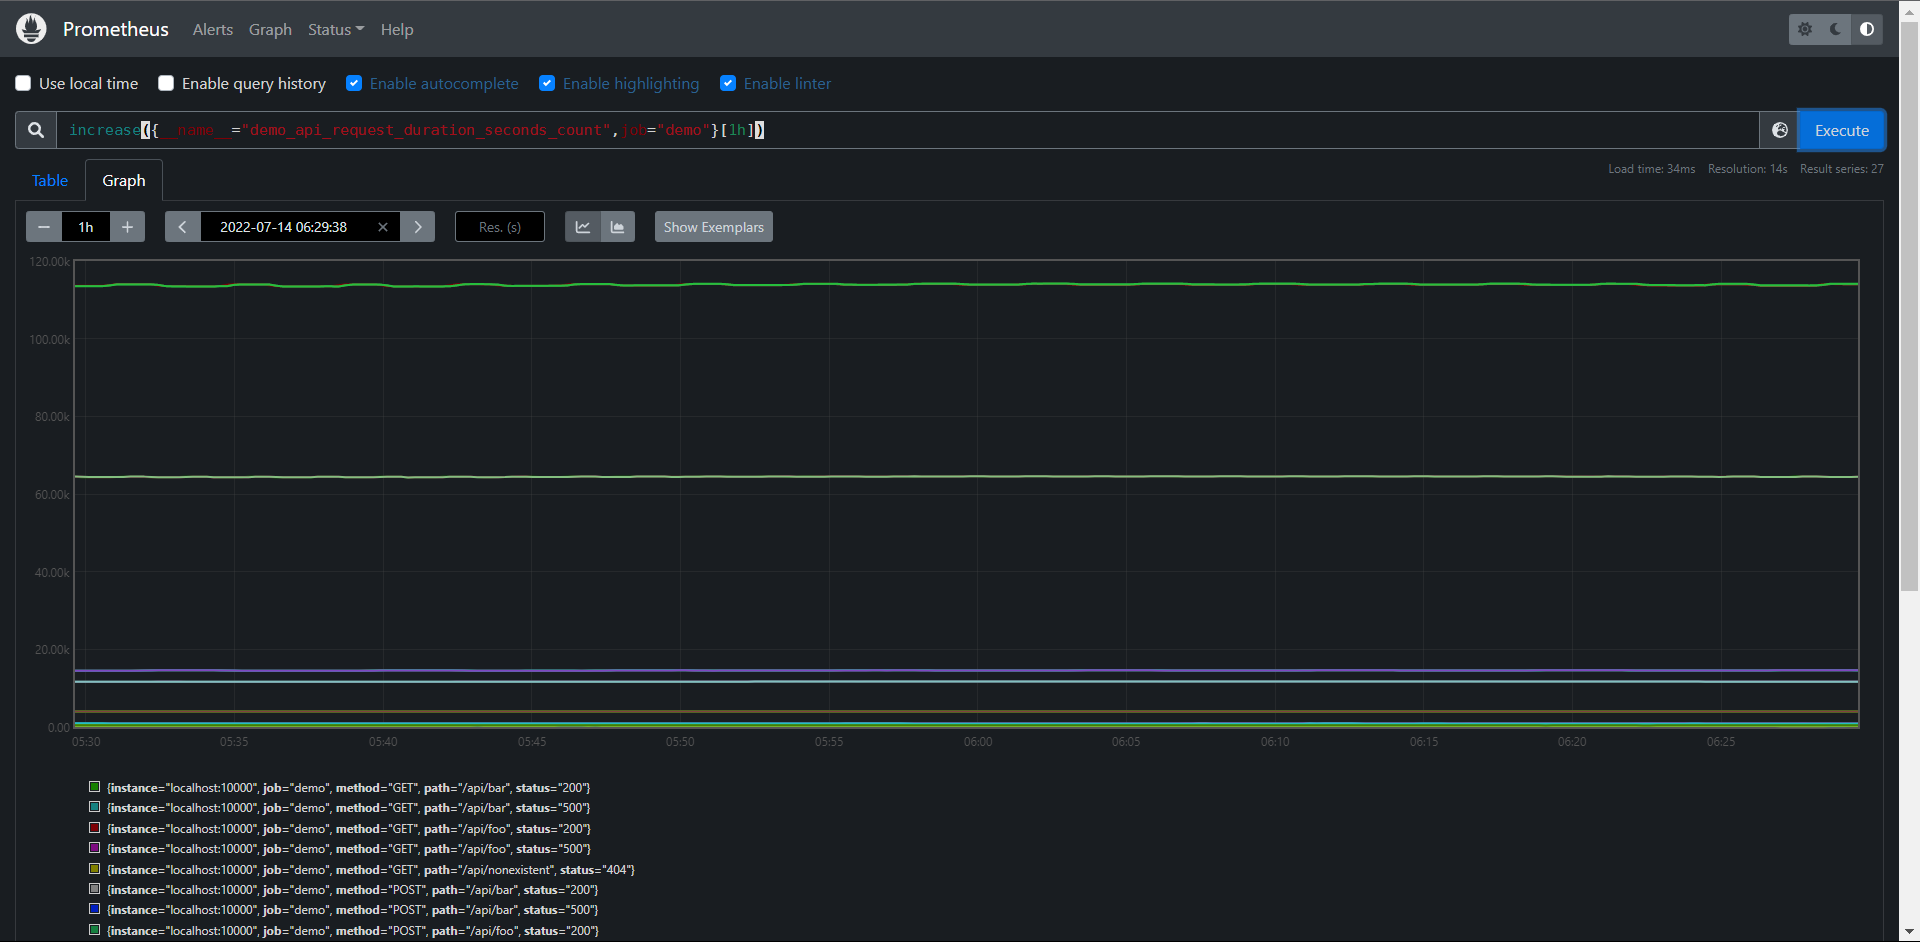
比如说上面结果表达式用的rate()函数计算的结果整体图形趋势都是一样的,只是Y轴的数据不一样而已,一个表示数量,一个表示百分比。
rate(),irate(),和increase()函数只能输出非负值的结果,对于跟踪一个可以上升或下降的指标,(如:温度,内存,或磁盘空间),可以使用delate()和deriv()函数代提。
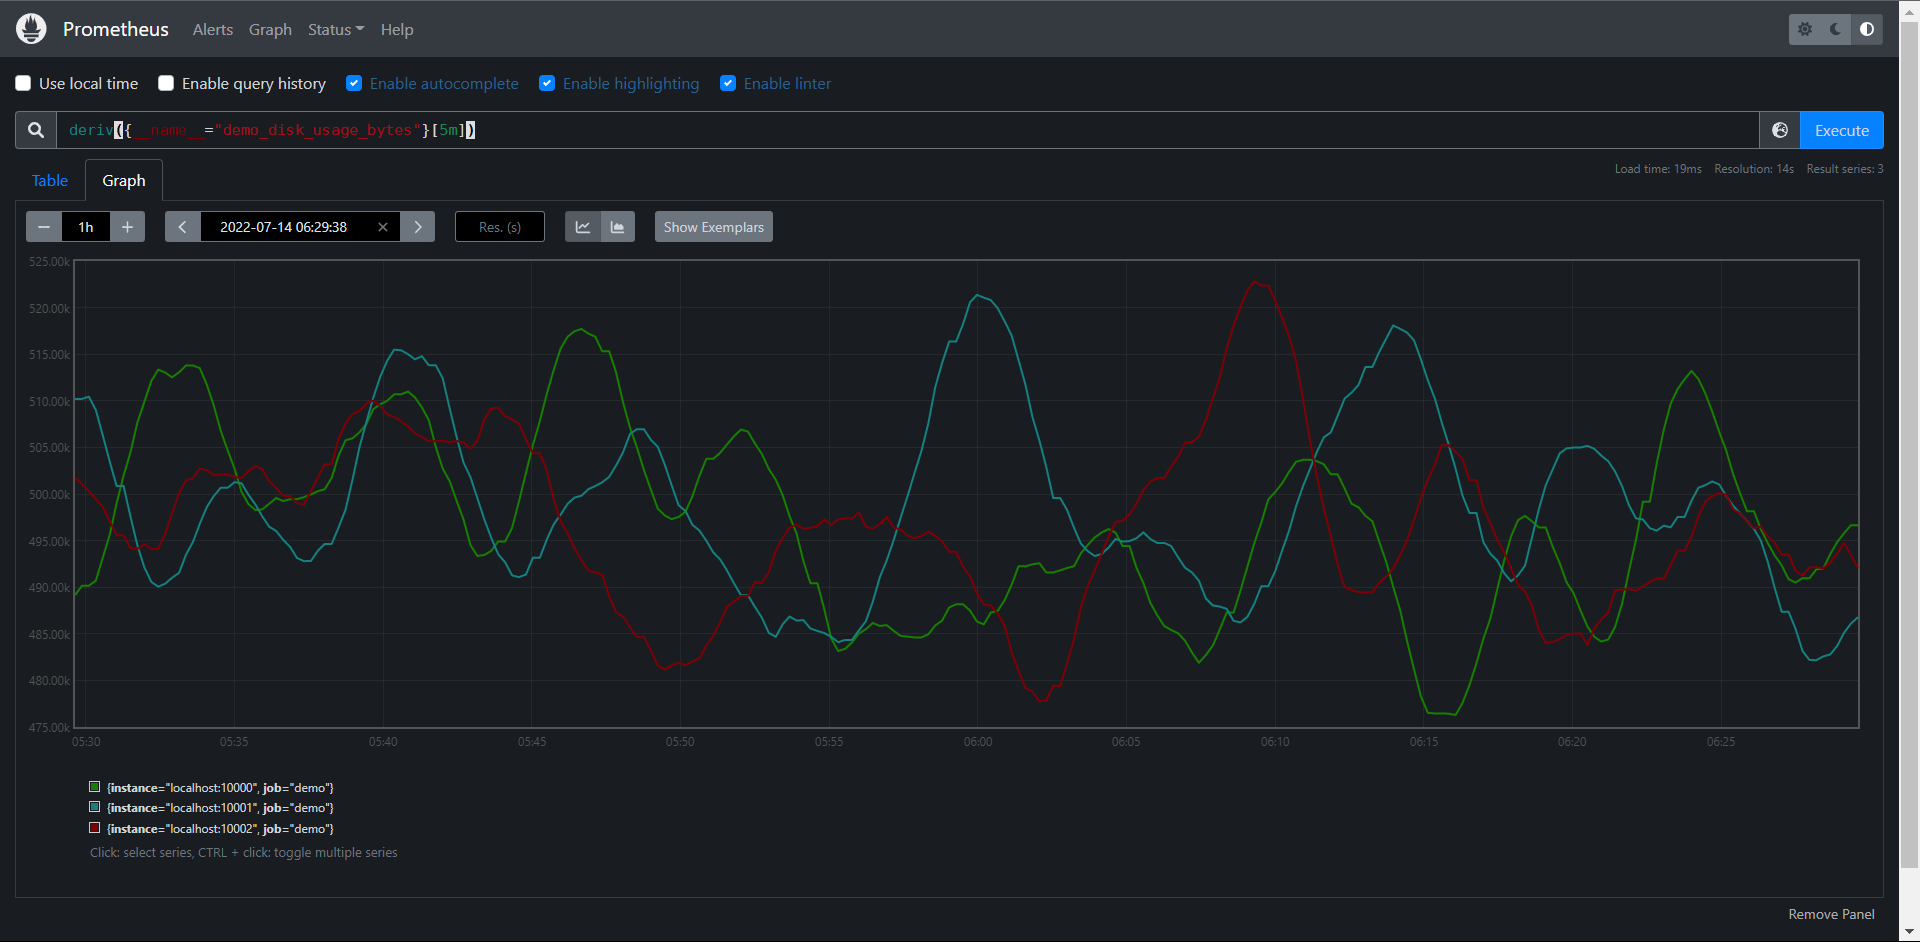
11.5.4:deriv()
deriv()函数可以计算一个区间向量中各个时间序列二阶导数,使用简单线性回归,deriv(v range-vector)参数是一个区间向量,返回一个瞬时向量,这个函数一般只应用于Gauge类型时间序列上。比如:需要计算在15分钟的窗口下,每秒使用磁盘的上升或下降多少

PromQL:deriv({__name__="demo_disk_usage_bytes"}[5m])
11.5.5:predict_linear()
这个函数可以预测一个Gauge类型的指标在未来一定时间内的值,例如我们可以根据过去15分钟的变化情况,来预测一个小时后的池畔使用量是多少,

PromQL:predict_linear(demo_disk_usage_bytes{job="demo"}[15m], 3600)
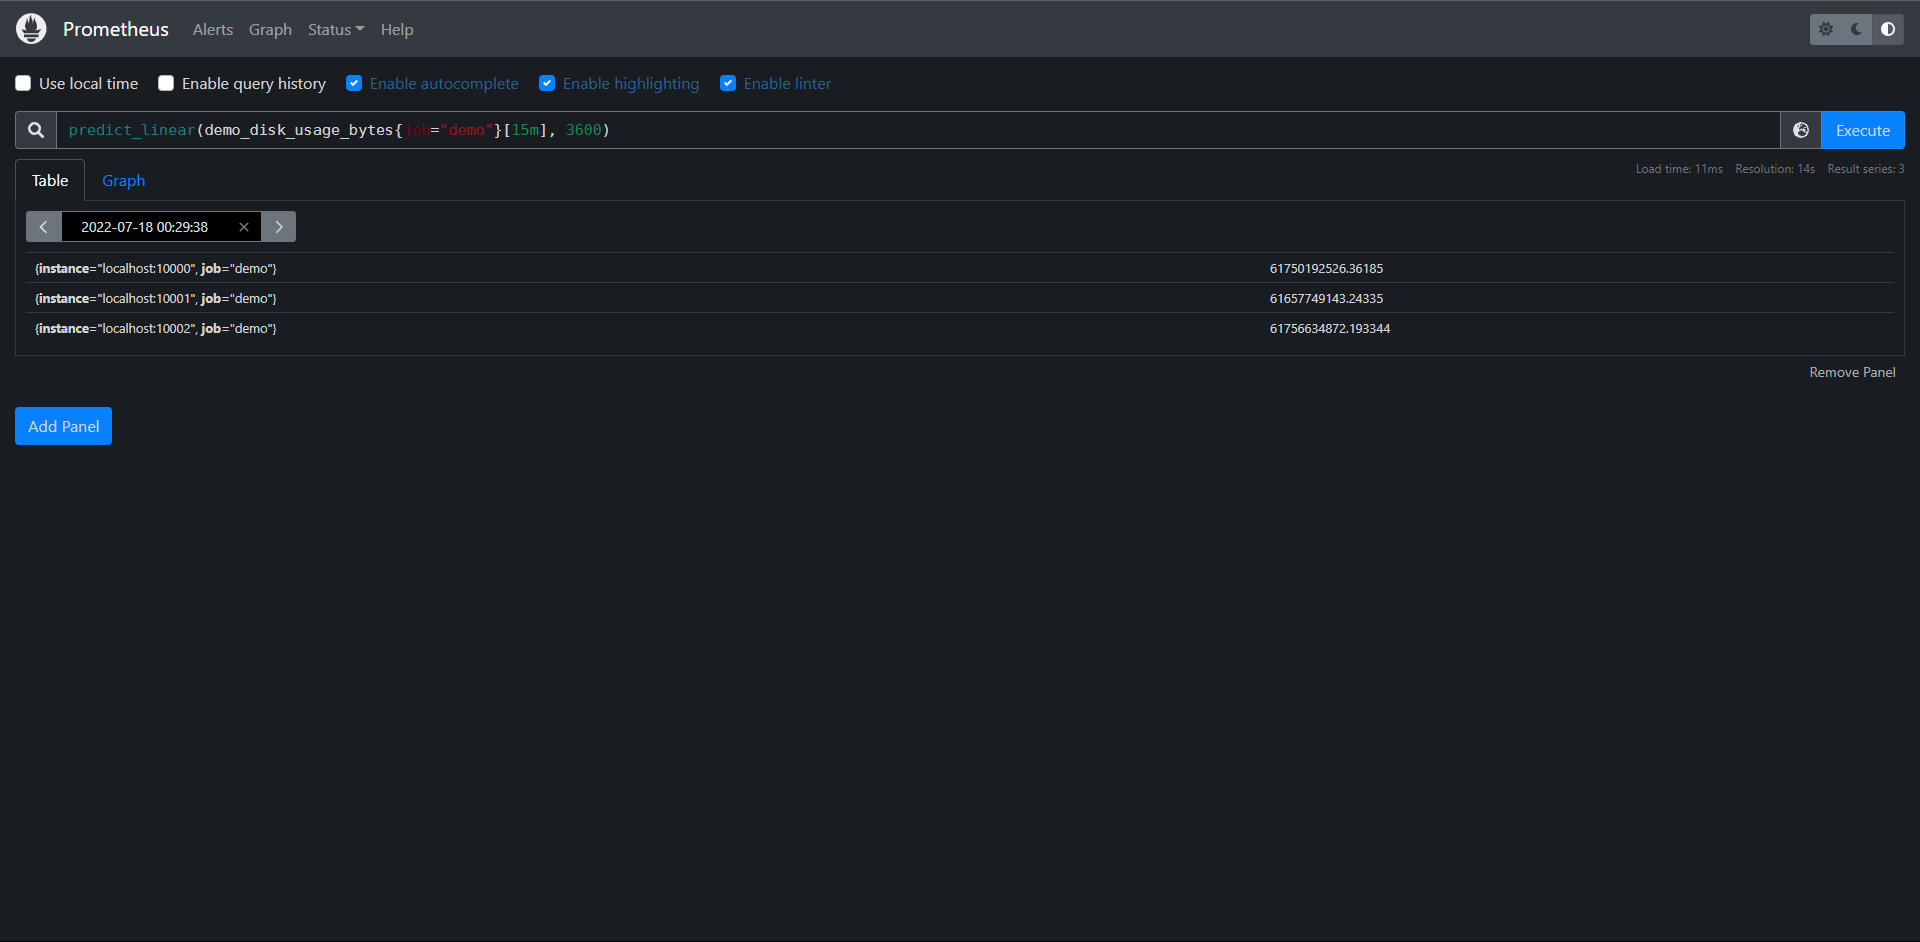
这个函数也可以用来报警,告诉我们磁盘是否会在几小时内用完。
11.6:聚合
我们在学Prometheus的时候都知道,Prometheus的时间序列是多维数据模型,我们经常就有根据各个维度进行汇总的需求。
11.6.1:基于标签聚合
例如我们想知道demo服务每秒处理的请求数,那么可以将单个的速率相加就可以了

PromQL:sum(rate(demo_api_request_duration_seconds_count{job="demo"}[5m]))
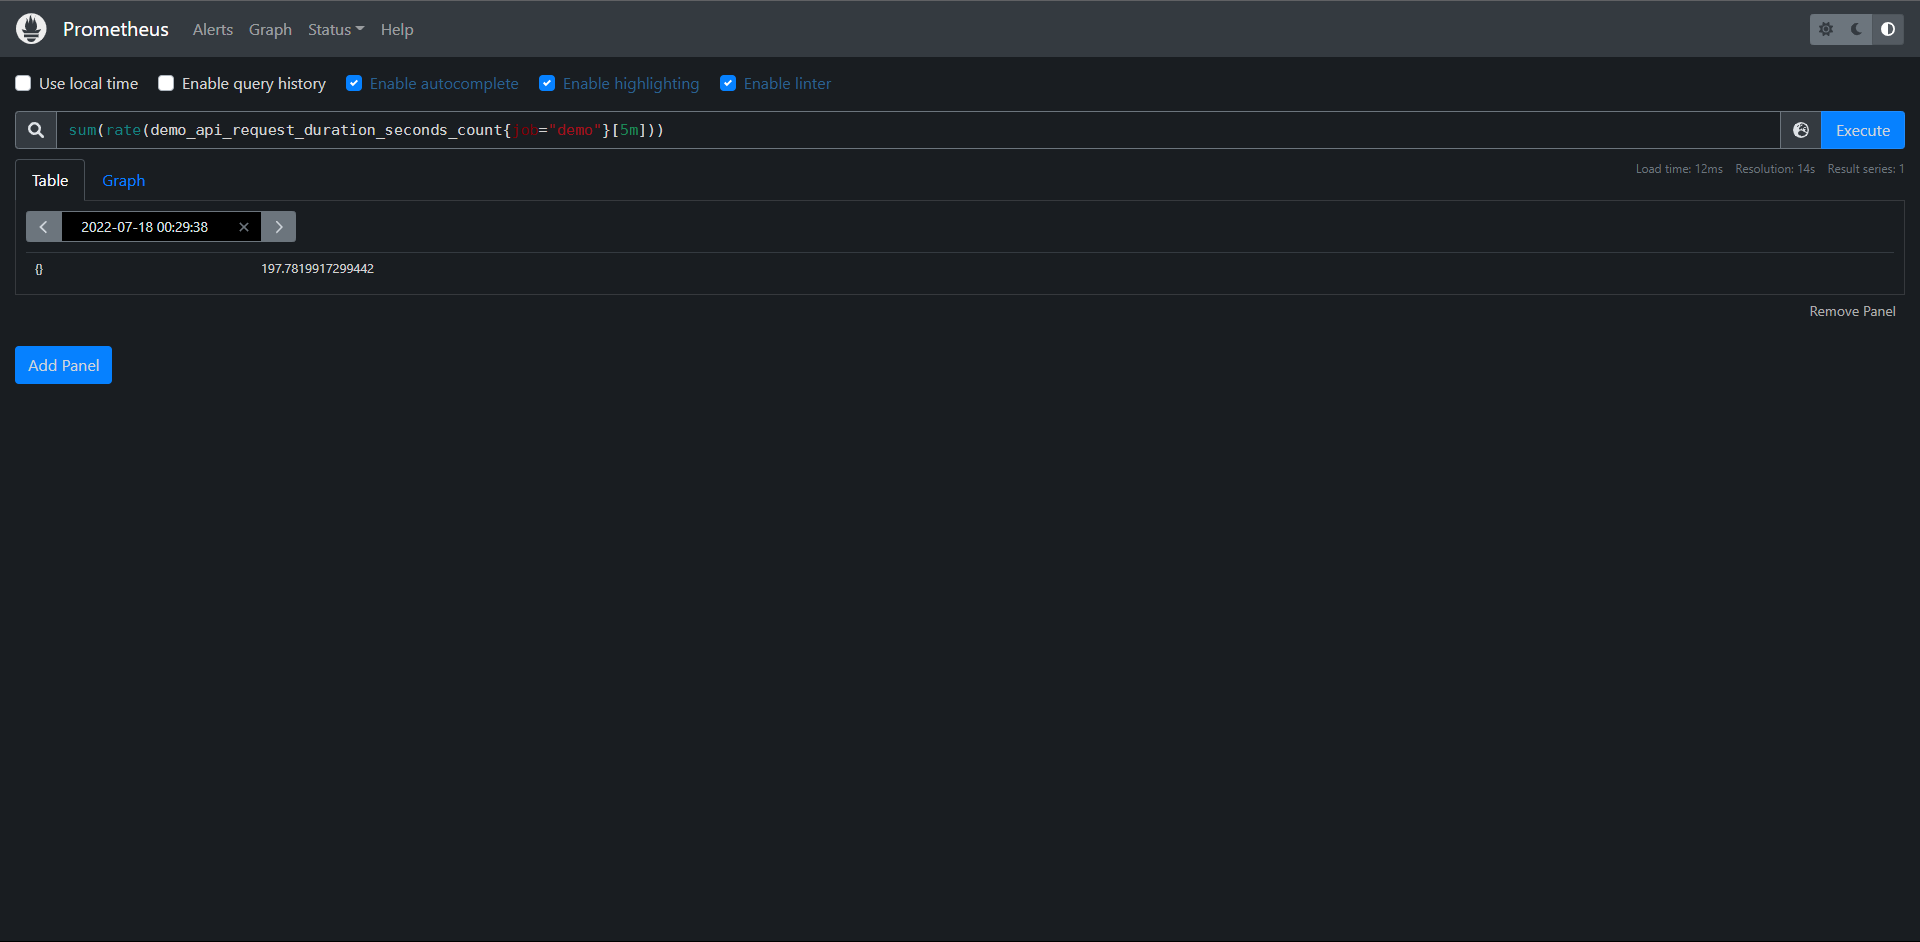
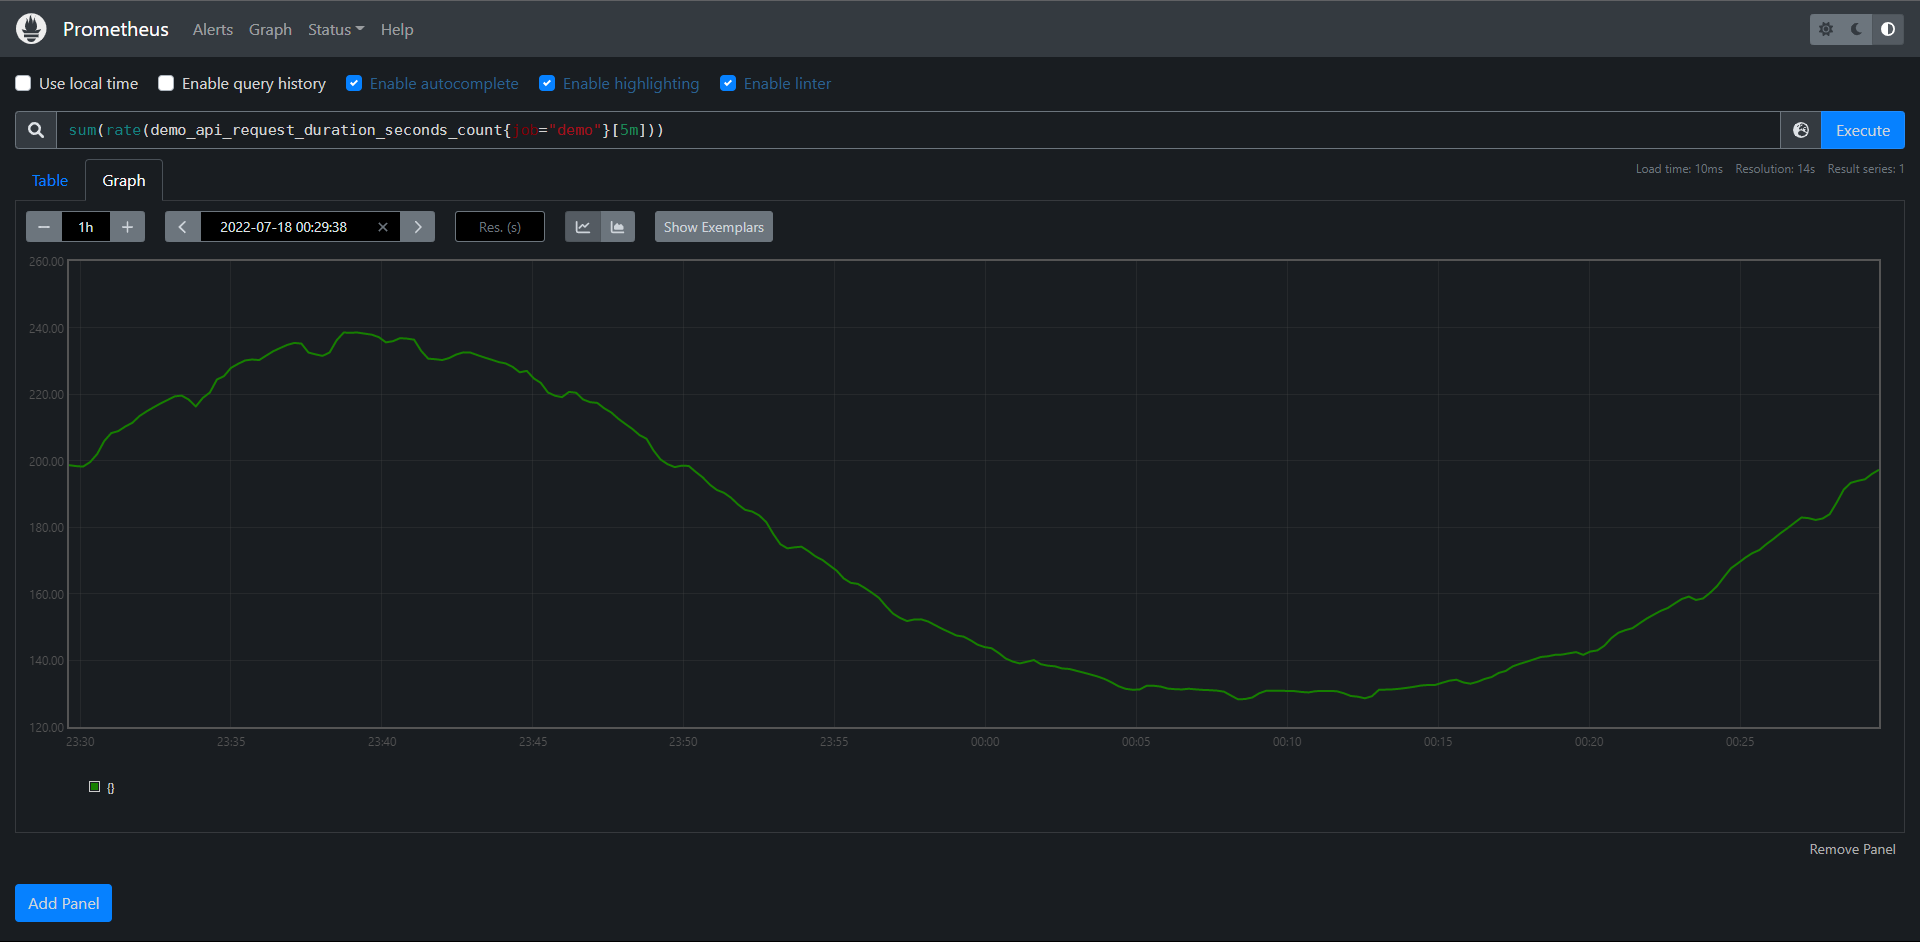
但是这里我们可以看到数据貌似并没有具体显示基于什么标签聚合了,那么我们下面就要介绍的就是它的一个修饰符

PromQL:sum by(instance,path)(rate(demo_api_request_duration_seconds_count{job="demo"}[5m]))
# by内表示我们用什么标签去做聚合
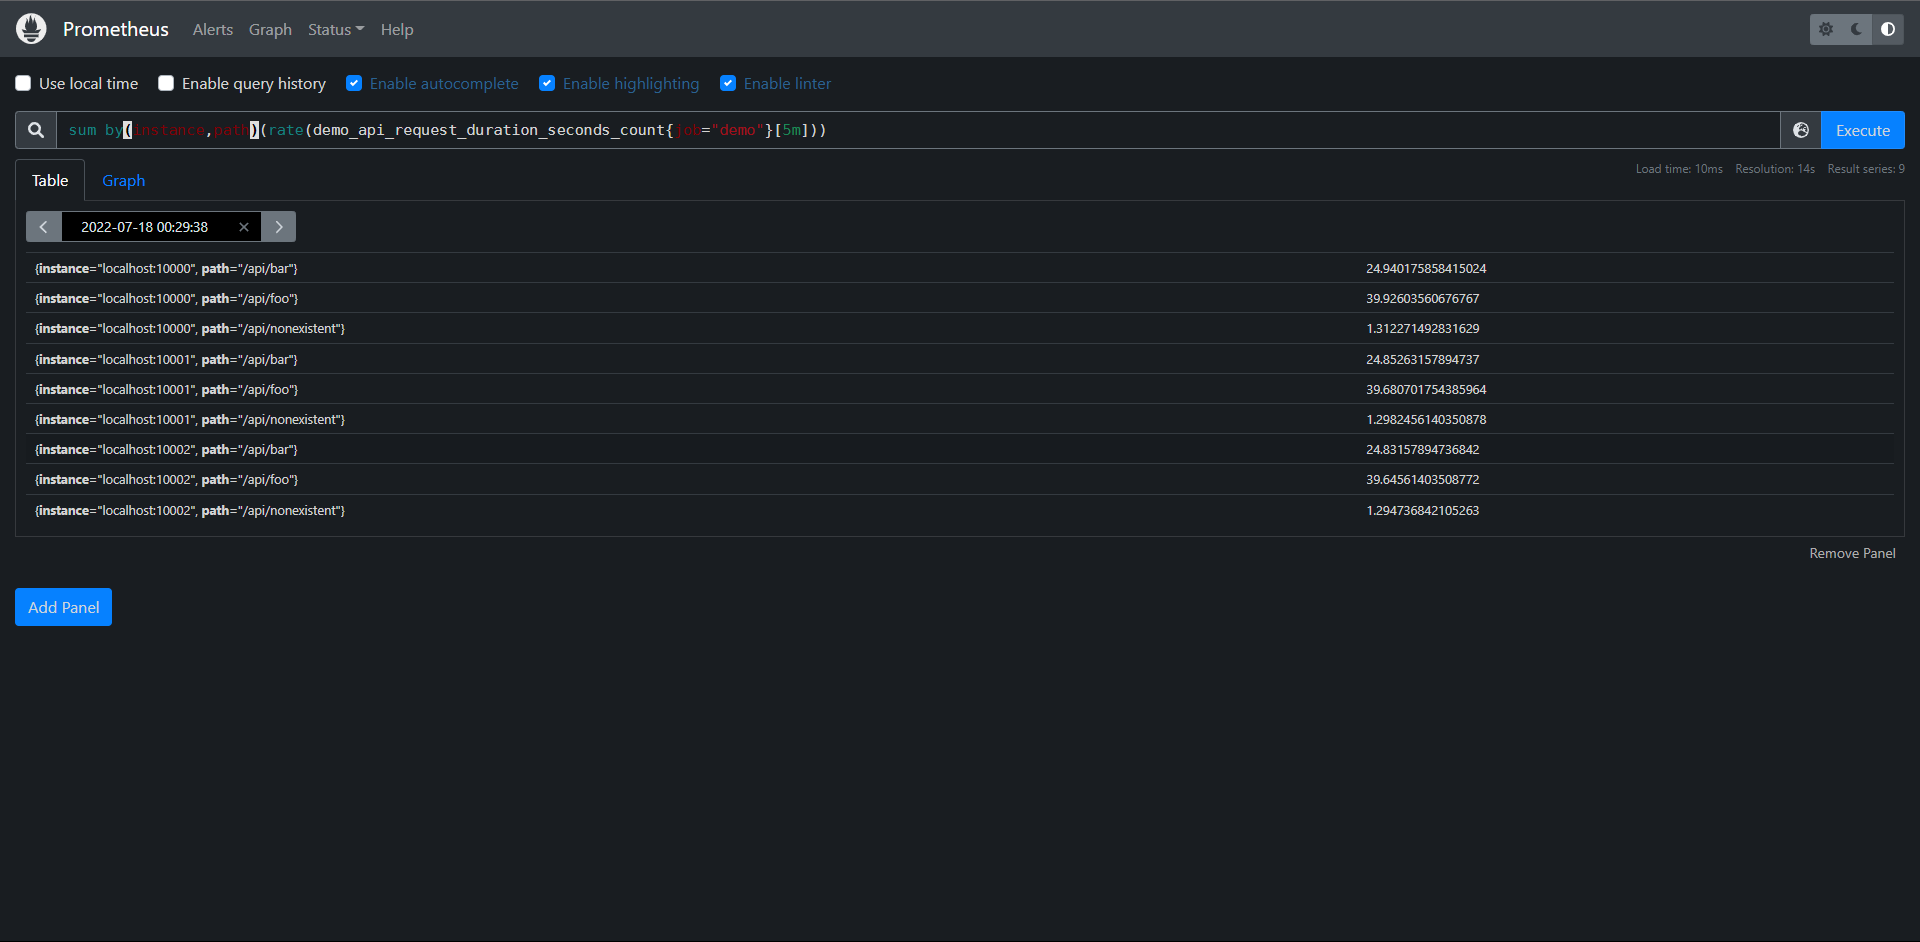
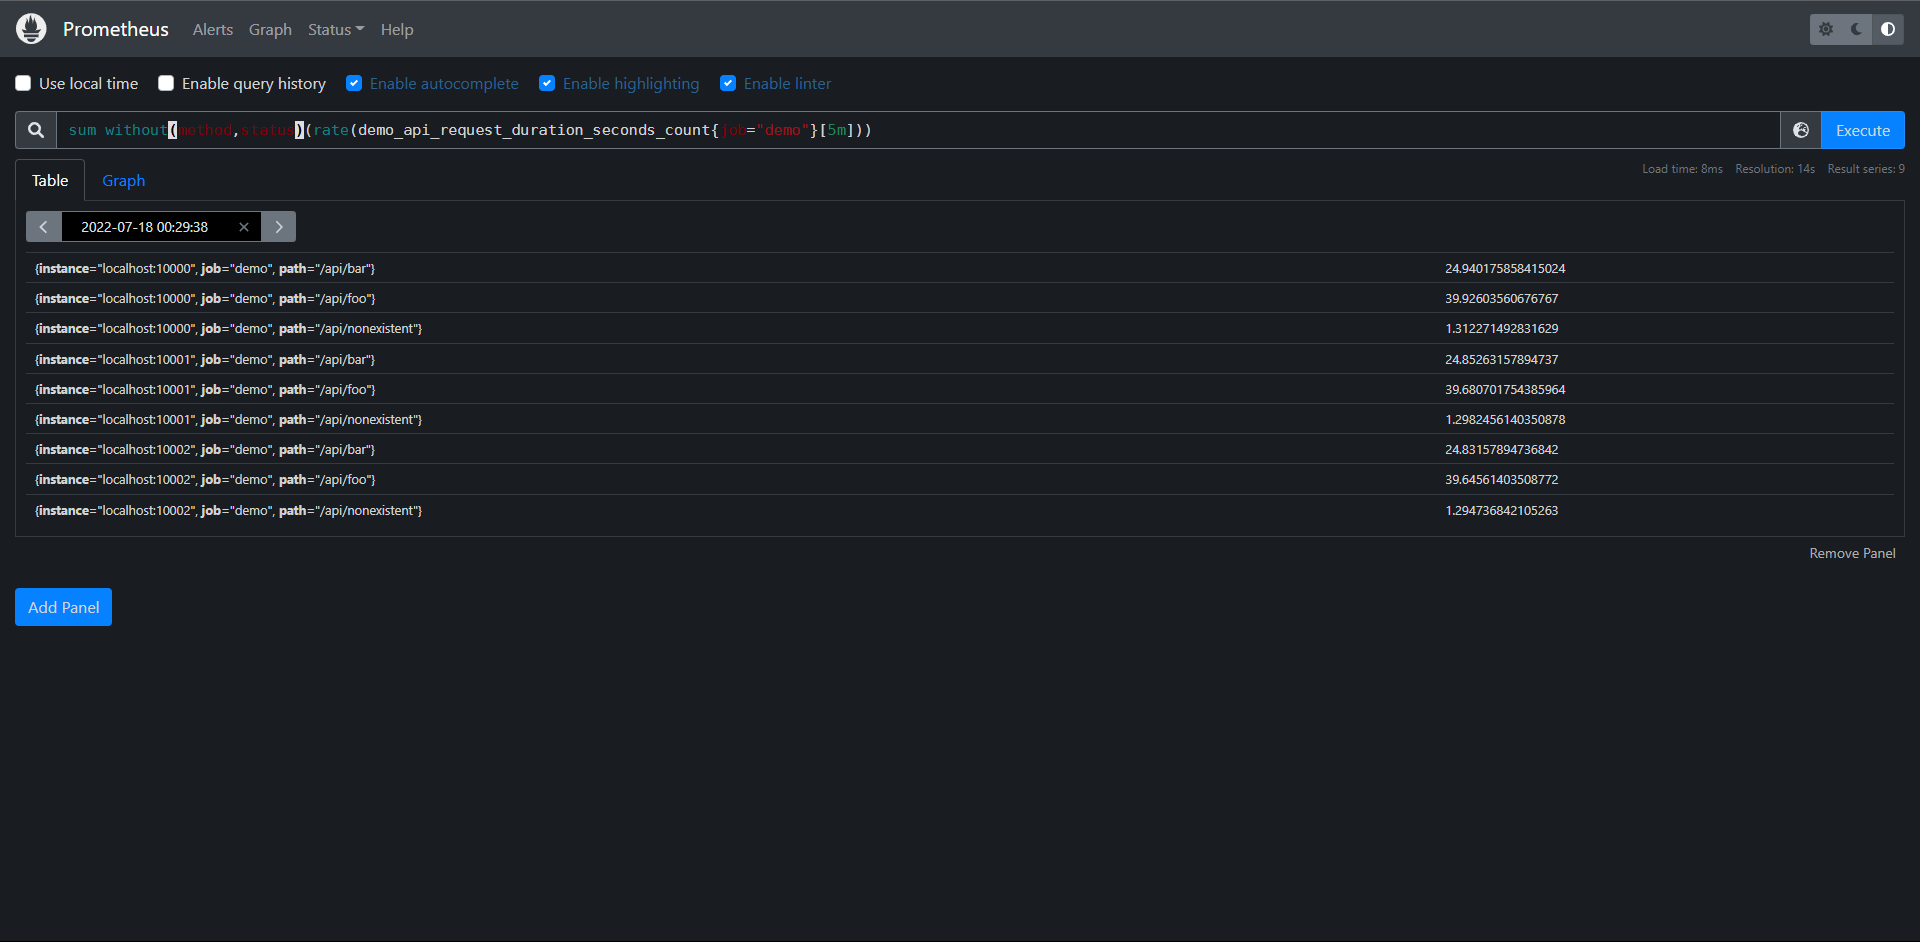
当然了,还有另外一个修饰符为without,它的意思就和by是相反的,就是说它的意思就是不根据什么标签去聚合

PromQL:sum without(method,status)(rate(demo_api_request_duration_seconds_count{job="demo"}[5m]))
其实这里的分组的概念和SQL语句中的分组概念非常的相似,当然除了sum()之外,Prometheus还支持如下很多的聚合函数:
1:sum():对象聚合分组中所有值进行求和
2:min():获取一个聚合分组中的最小值
3:max():获取一个聚合分组中的最大值
4:avg():计算聚合分组中所有数值的平均值
5:stddev():计算聚合分组中所有数值的标准差
6:stdvar():计算聚合分组中所有数值的标准方差
7:count():计算所有聚合分组中所有序列的总数
8:count_values():计算具有相同样本值得元素数量
9:bottomk(k, ...):计算按样本值计算的最小的k个元素
10:topk(k, ...):计算最大k个元素的样本值
11:quantile(a, ...):计算维度上a分位数(0<=a<=1)
12:group(...):只是按标签分组,并将样本值设置为1

练习
1:按job分组聚合,计算我们正在监控的所有进程的总内存使用量(process_restdent_memory_bytes指标)
PromQL:sum by(job)(process_resident_memory_bytes)
2:计算demo_cpu_usage_seconds_total指标有多少不同的CPU格式
PromQL:count(group by(mode)(demo_cpu_usage_seconds_total))
3:计算每个Job任务和指标明称的时间序列数量
PromQL:count by(job,__name__)({__name__!=''})
11.6.2:基于时间聚合
前面我们看到了如何使用su(),avg()和相关的聚合运算从标签维度进行聚合,这些运算符在一个时间内对多个序列进行聚合,但是有时候我们可能想在每个序列中按时间聚合,例如:使尖锐的曲线更平滑,或深入了解一下一个序列在一段时间内的最大值。
为了基于时间进行聚合,PromQL提供了一些与标签聚合运算类似的函数,但是在这些函数名后面附加了_over_time():
1:avg_over_time(range-vector):区间向量内每个指标的平均值
2:min_over_time(range-vector):区间向量内每个指标的最小值
3:max_over_time(range-vector):区间向量内每个指标的最大值
4:sum_over_time(range-vector):区间向量内每个指标求和
5:count_over_time(range-vector):区间向量内每个指标的样本数据个数
6:quantile_over_time(sclar,range-vector):区间向量内每个指标的样本数据值分位数
7:stddev_over_time(range-vector):区间向量每个指标的总体标准差
8:stdvar_over_time(range-vector):区间向量内每个指标的总体标准方差
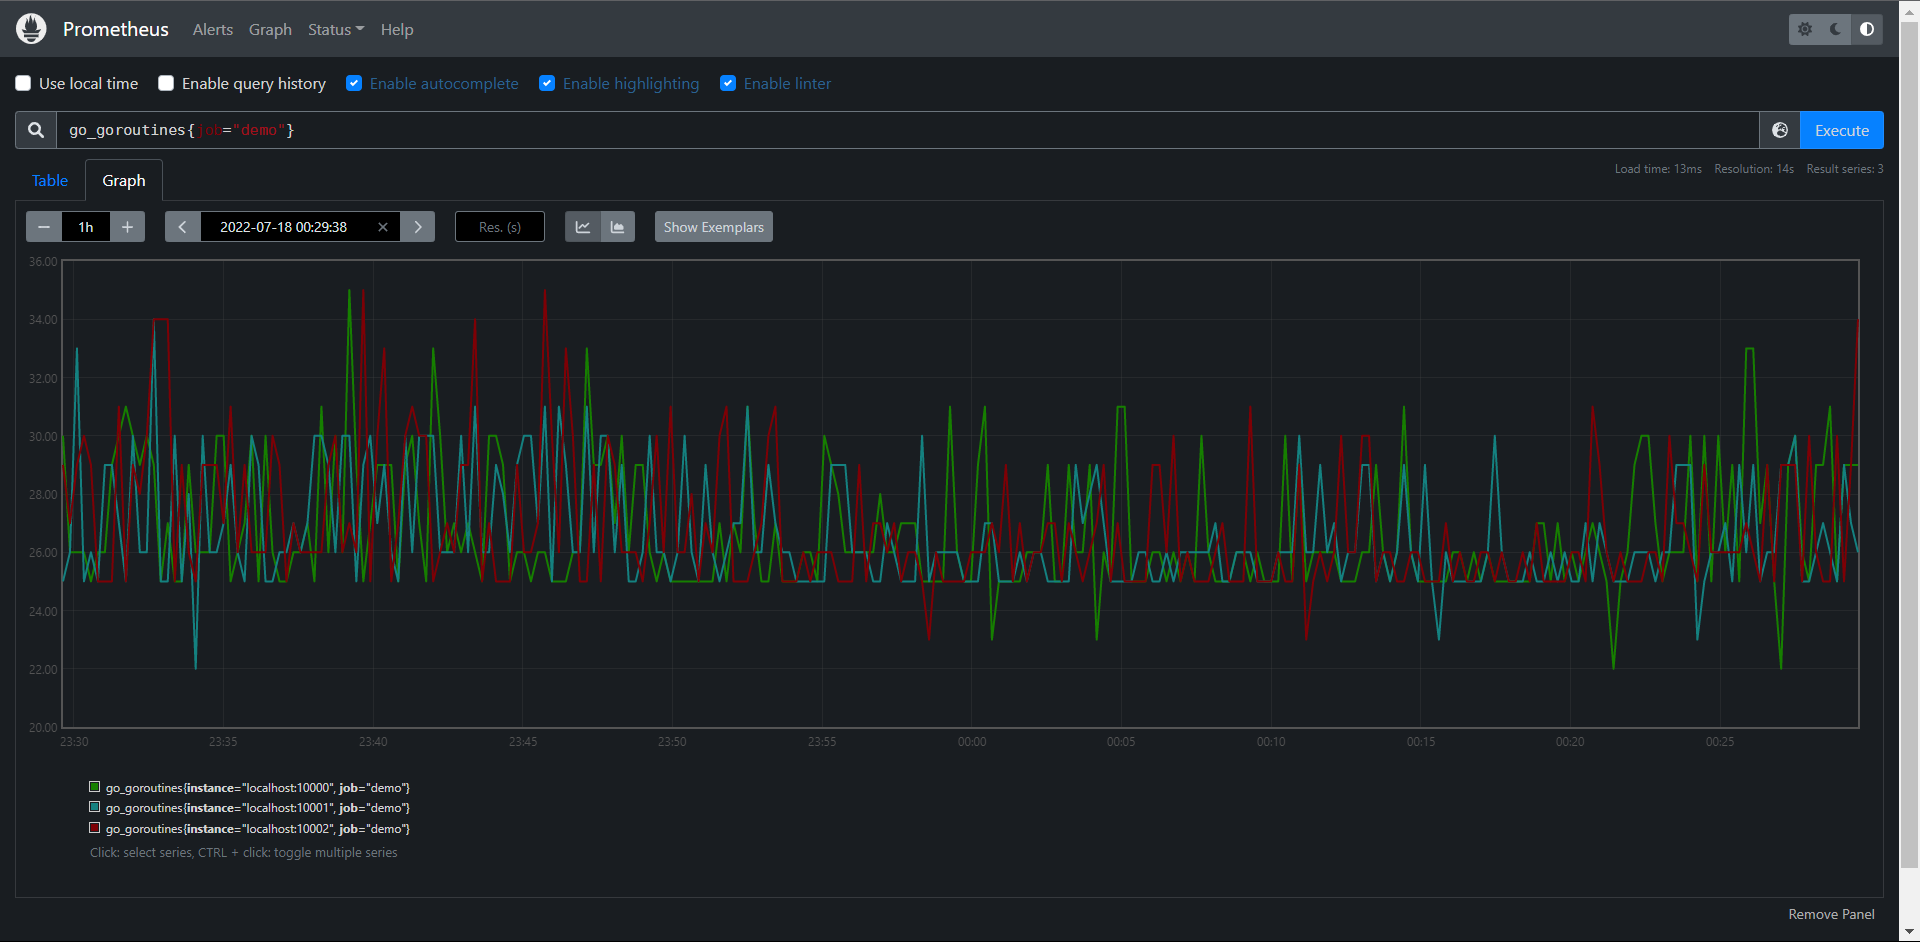
例如我们查询demo实例中的goroutine的原始数量,可以使用查询语句:
PromQL:go_goroutines{job="demo"}
这会产生一些尖锐的峰值图
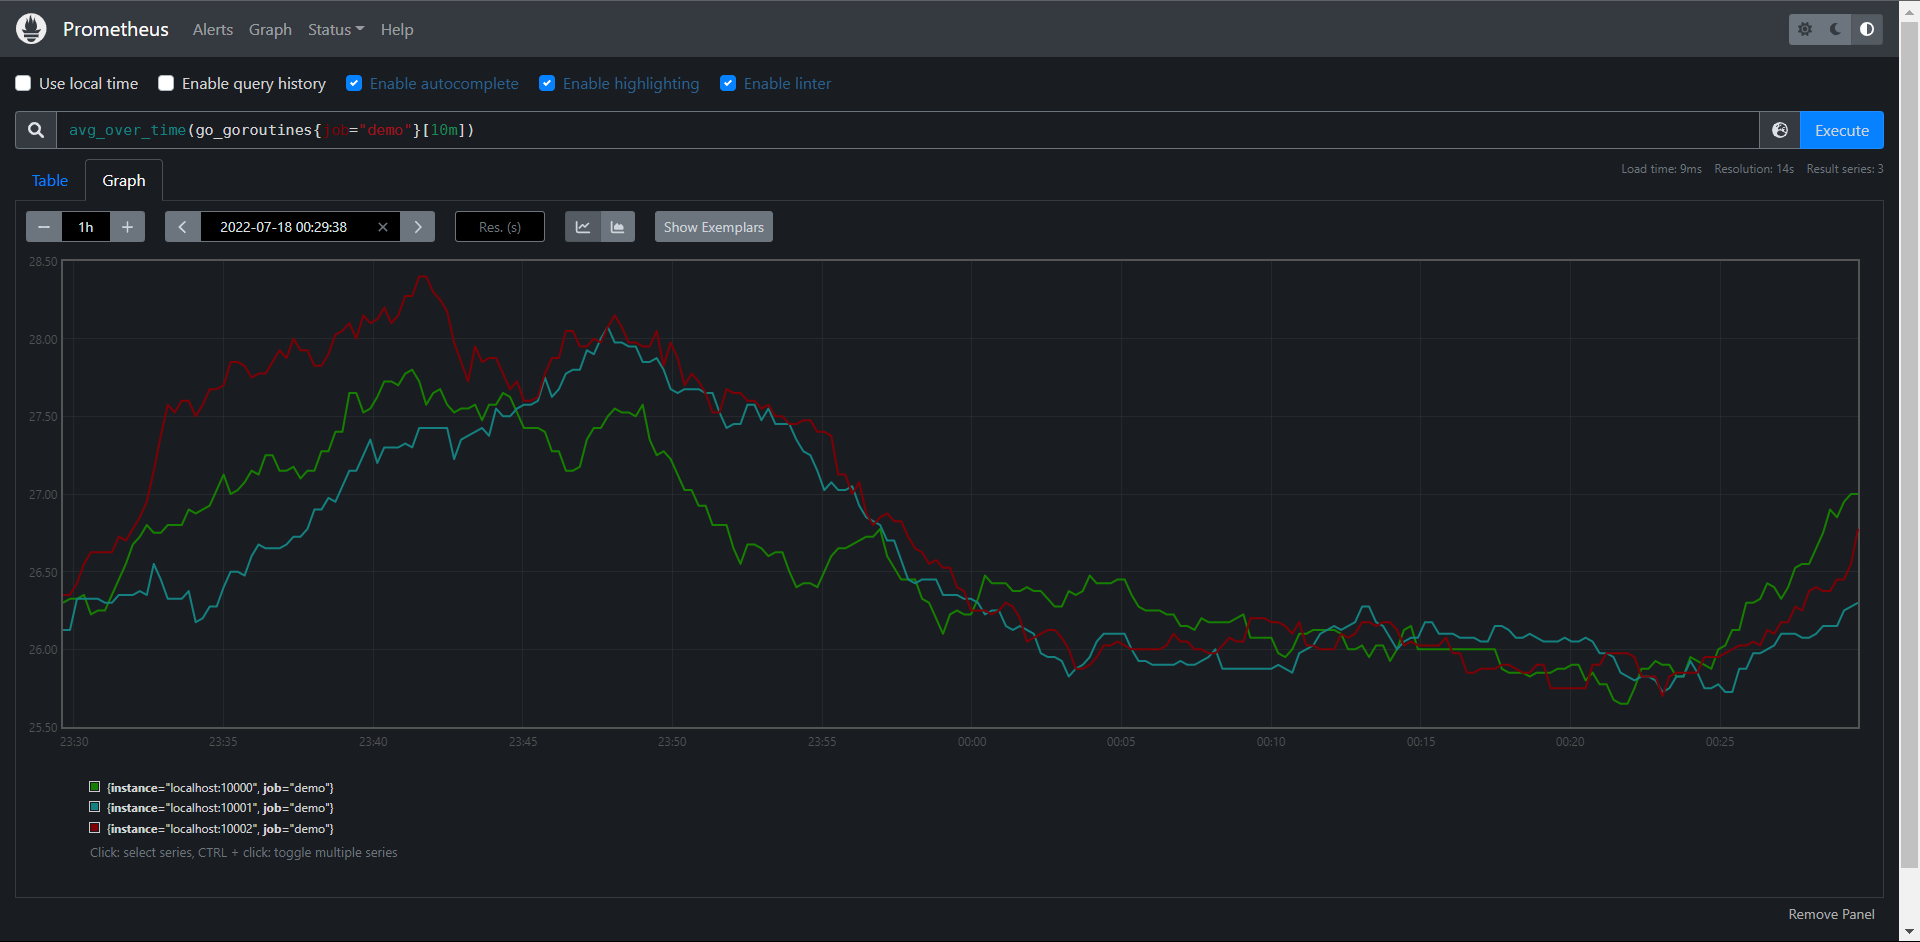
当然我们可以通过算某个时间点的平均值来处理一下:

PromQL:avg_over_time(go_goroutines{job="demo"}[10m])
11.6.3:子查询
上面的所有的_over_time()函数都需要一个范围向量作为输入,通常情况下只能由一个区间向量选择器来产生,比如:metric[5m],但是如果现在我们想使用例如:max_over_time()函数来找出一天中demo服务的最大请求率应该怎么办呢?
请求率rate并不是一个我们可以直接选择时间的原始值,而是一个计算后得到的值:
PromQL:rate(demo_api_request_duration_seconds_count{job="demo"}[5m])
如果我们直接将表达式传入max_over_time()并附加一天的持续时间查询的话会产生错误:
PromQL:max_over_time(rate(demo_api_request_duration_seconds_count{job="demo"}[5m])[1d])
# 报错如下:
Error executing query: invalid parameter "query": 1:76: parse error: ranges only allowed for vector selectors
这个时候我们就涉及到了子查询
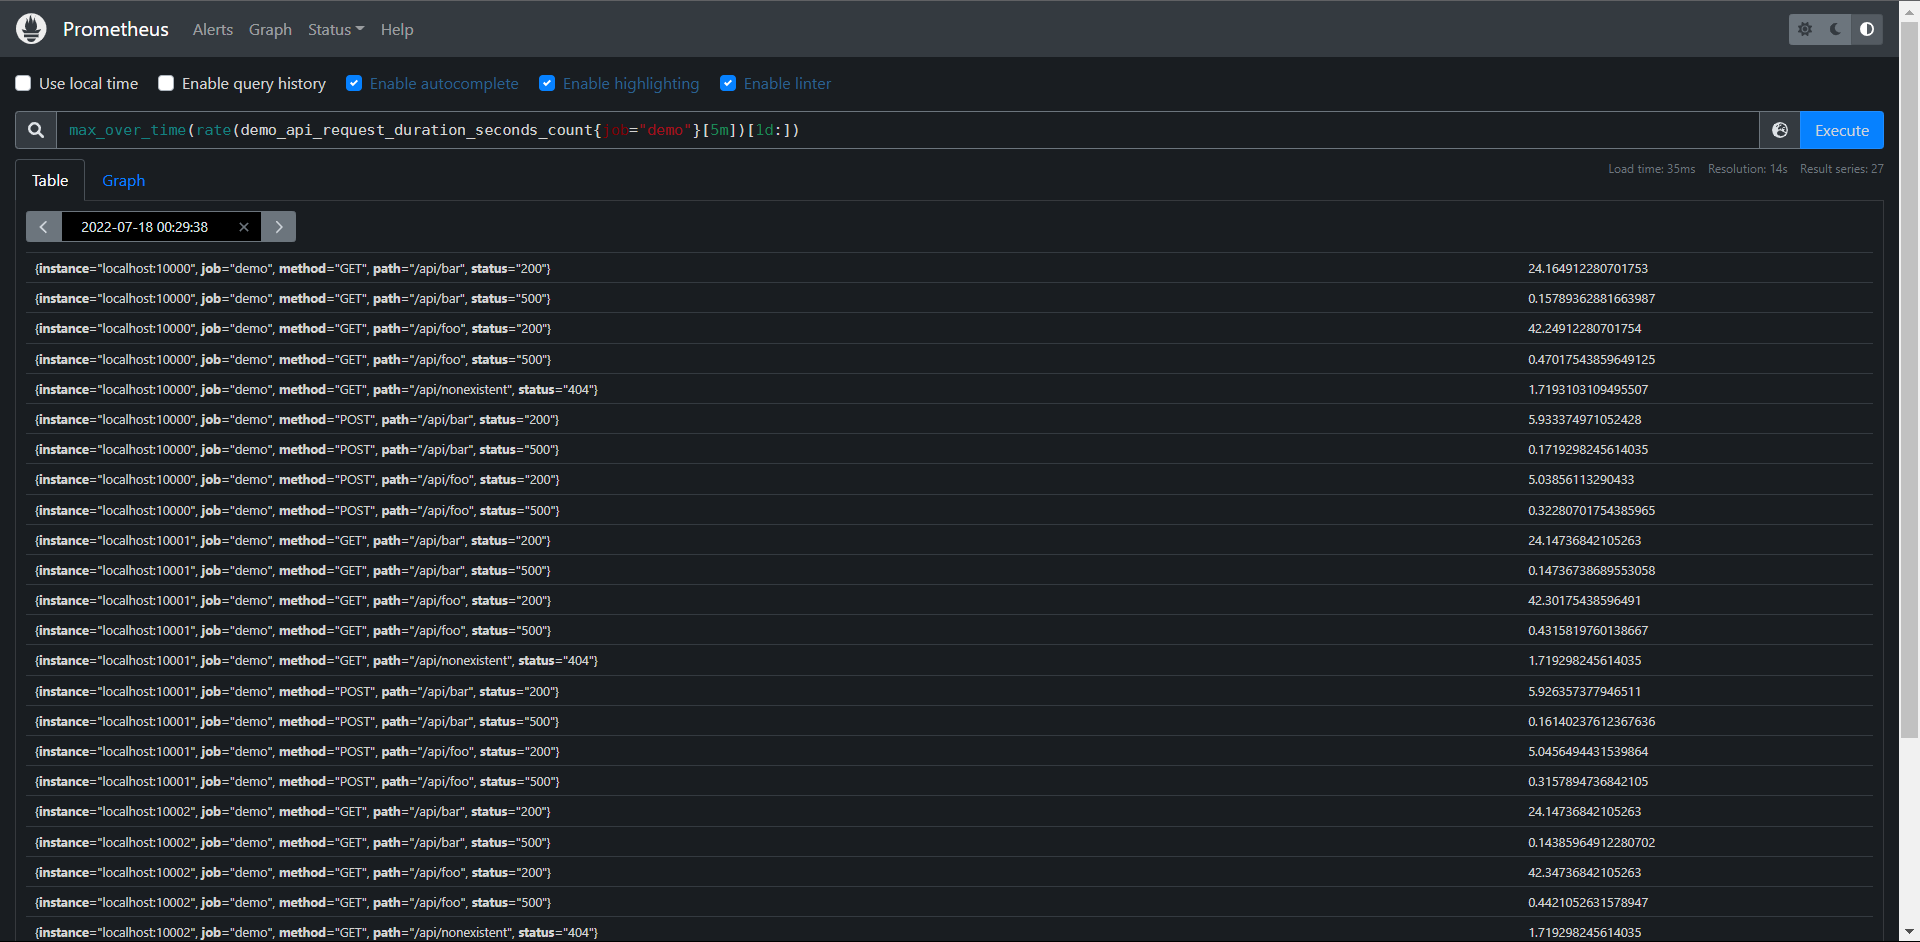
PromQL:max_over_time(rate(demo_api_request_duration_seconds_count{job="demo"}[5m])[1d:10s])
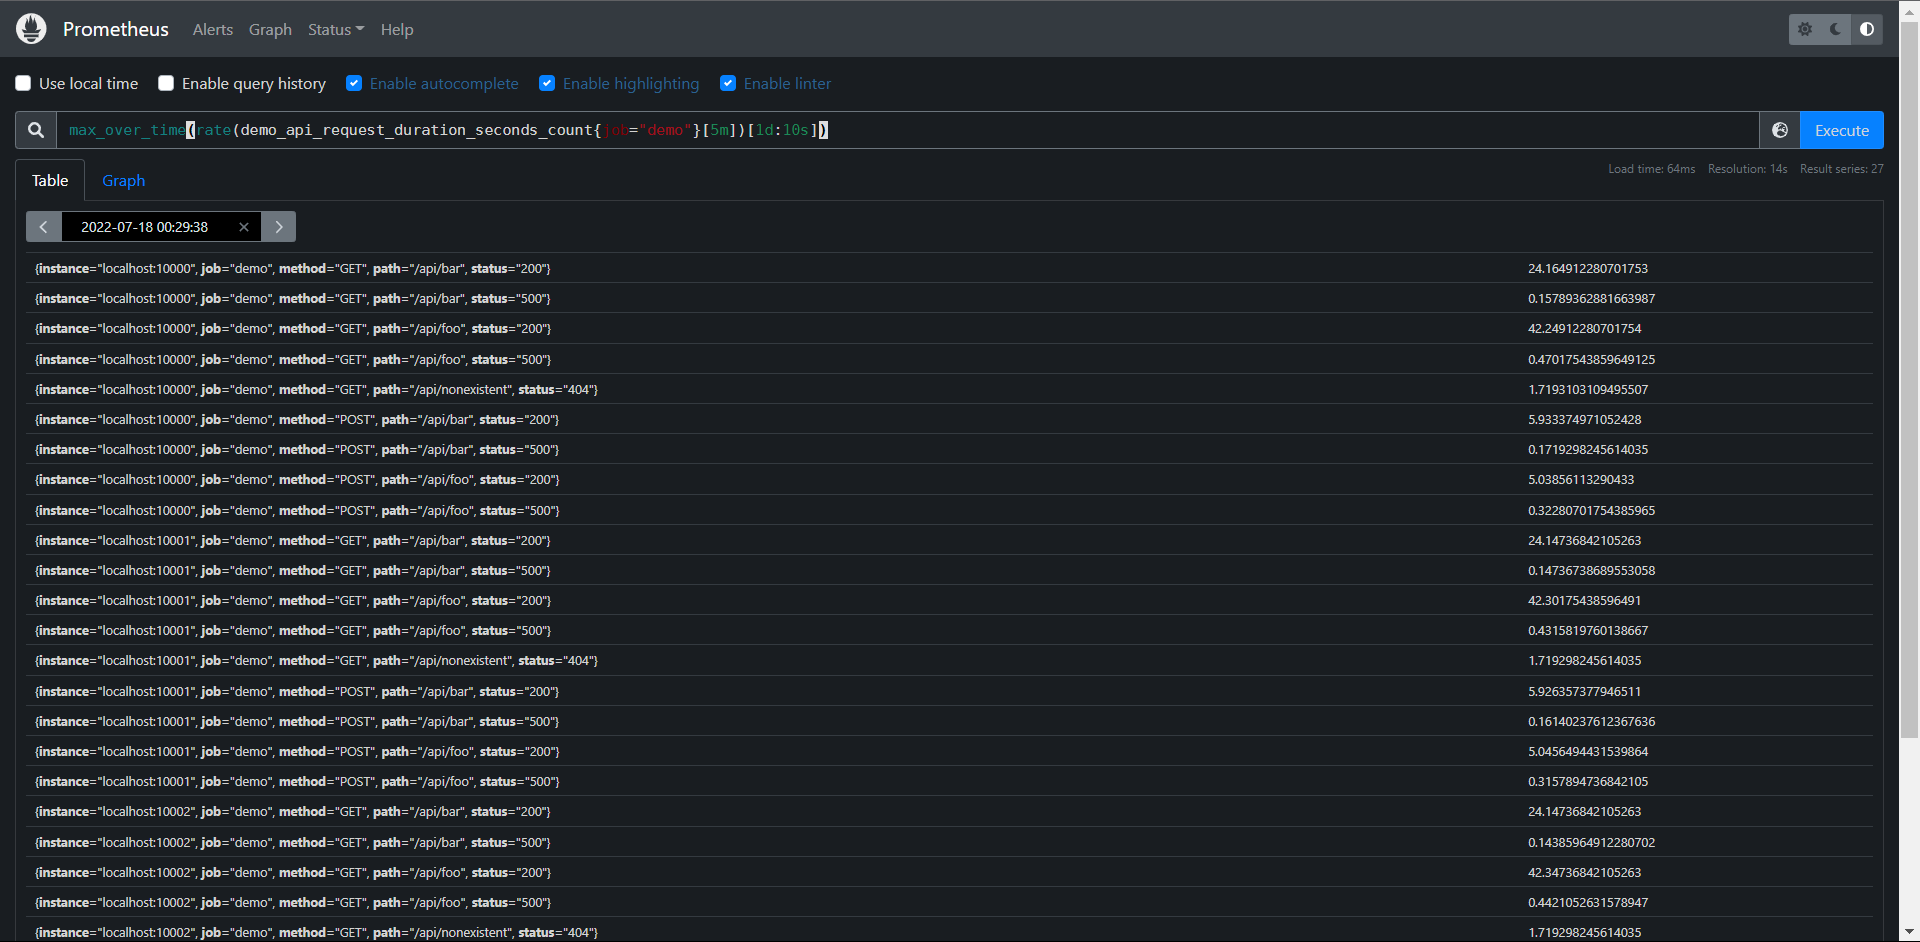
这样其实就OK了,因为我们后面是赋予的一天,但是这个查询只能给区间向量,所以我们要明确是一天内的步长时间,当然了这个10s也不是必须的,我们可以去掉,但是要保留:,这个时候他会去引用我们的全局配置:evaluation_intervar= 1m 这个值
这里注意:子查询是支持 offset的,但是使用子查询的代价是非常的高的。

PromQL:max_over_time(rate(demo_api_request_duration_seconds_count{job="demo"}[5m])[1d:])
11.7:运算
Prometheus的查询语言支持基本的逻辑运算和算术运算。
11.7.1:算术运算
在Prometheus系统中支持以下的二元算术运算符:
1:+:加
2:-:减
3:*:乘
4:/:除
5:%:模
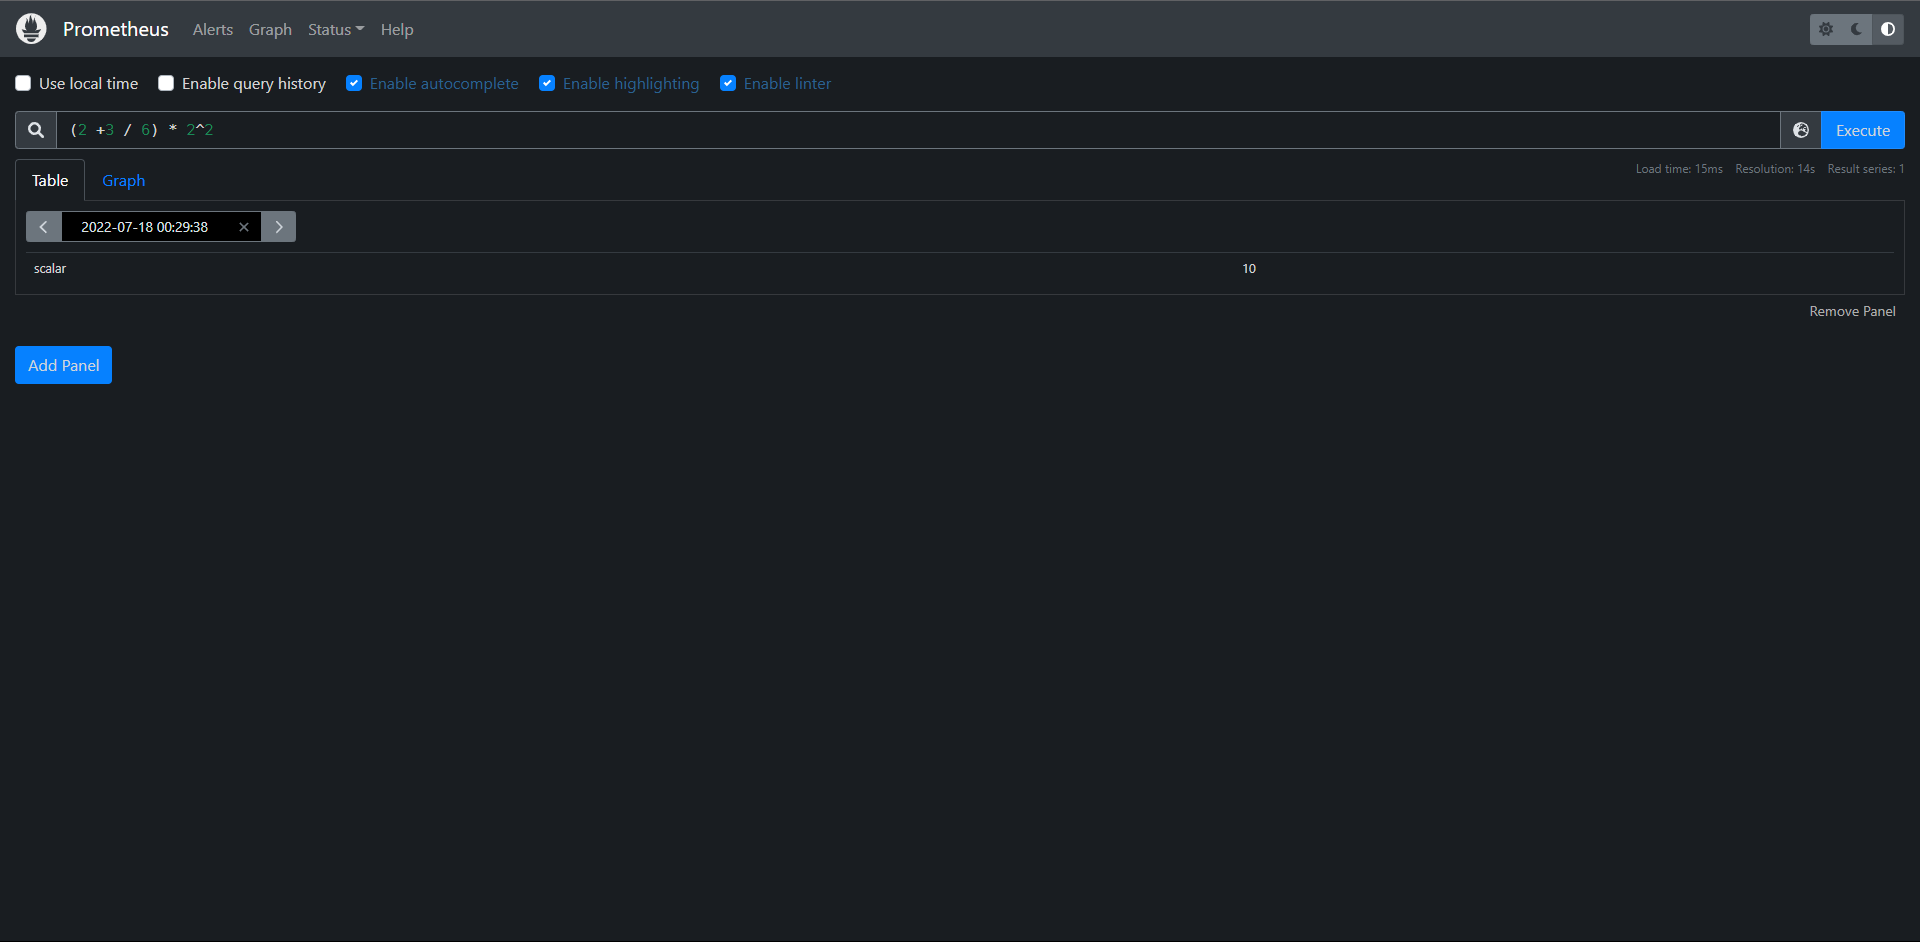
最简单的我们可以将一个数字计算当成一个PromQL语句,用于标量与标量之间计算:
PromQL:(2 +3 / 6) * 2^2
# 这里得到的值是一个标量
二元运算符同样适用于向量和标量的运算,例如我们可以将一个字节数除以两次1024来换算成MiB:

PromQL:demo_batch_last_run_processed_bytes{job="demo"} / 1024 / 1024

# 这里使用的是向量和标量计算

另外PromQL的一个强大的功能就是可以让我们在向量与向量之间进行二元运算:

例如:demo_api_request_duration_seconds_sum的数据包含了在path,method,status等不同维度上花费的总时间,指标 demo_api_request_duration_seconds_count包含上面同纬度下的请求和总数,则我们可以做如下运算:算出5分钟的平均请求持续时间:

PromQL:
rate(
    demo_api_request_duration_seconds_sum{
        job="demo"
    }[5m]
)
/
rate(
    demo_api_request_duration_seconds_count{
        job="demo"
    }[5m]
)
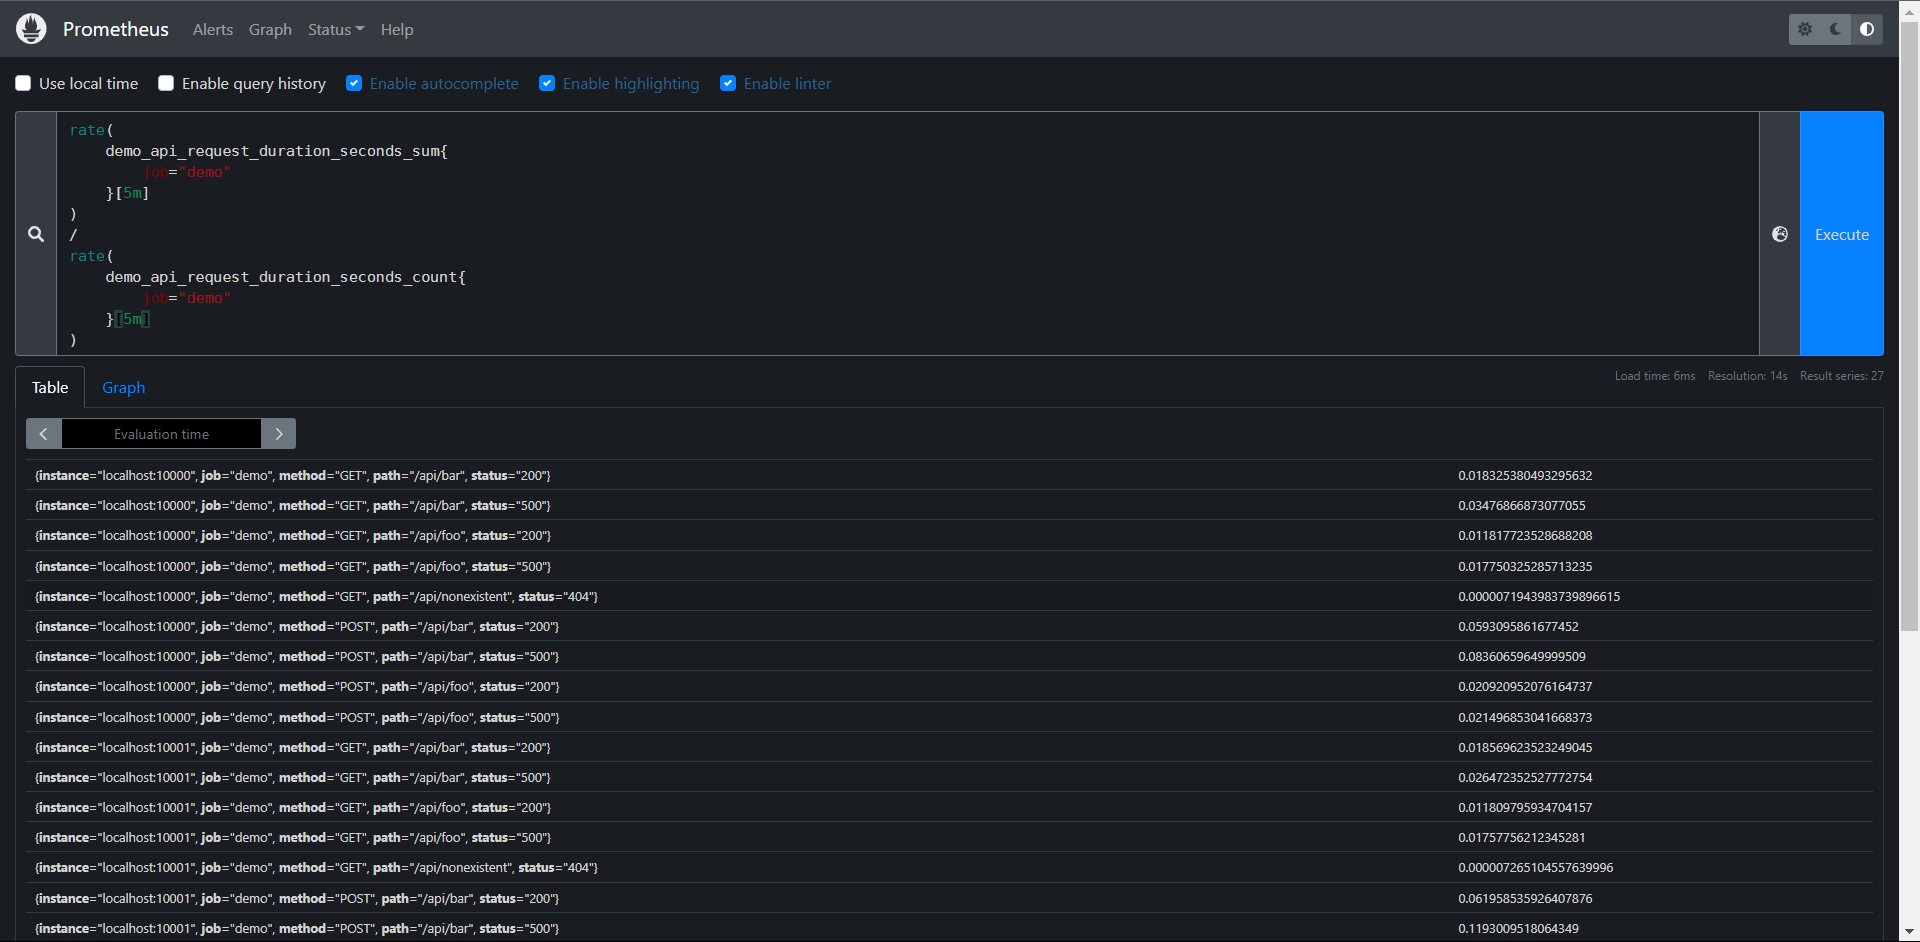
PromQL会通过相同的标签集自动匹配操作符左边和右边的元素,并将二元运算应用到它们身上,由于上面两个指标的标签集都是一致的。所以可以看得到相同标签集的平均请求延迟结果。
11.7.2:向量匹配
11.7.2.1:一对一
上面的实例其实就是一对一的向量匹配,但是一对一向量匹配也有两种情况,就是是否按照所有标签匹配计算,下面是匹配所有标签的情况:

1:默认情况下,对于向量左边的每一个元素,操作符都会尝试在右边找到一个相同的匹配的元素。
2:匹配是通过比较所有的标签来完成的
3:没有匹配到的标签会被丢弃
# 我这里构建一个假的来看看
foo = {job="demo", method="GET", path="/api/bar", status="200", time="1.111111"} 1
bar = {job="demo", method="GET", path="/api/bar", status="200"} 1
PromQL:foo{} + bar{}
结果是:{job="demo", method="GET", path="/api/bar", status="200"} 2
# 因为foo去匹配bar的标签的时候匹配不到time所以就被丢弃了

如果通过所有标签进行匹配是不可取的,则可以使用"on"或"ignoring"关键字指定一个标签子集。
On/ignoring并不会影响两边向量基数,它仍然是1:1

foo = {job="demo", method="GET", path="/api/bar", status="200", time="1.111111"} 1
bar = {job="demo", method="GET", path="/api/bar", status="200"} 1
PromQL:foo{} + on(method) bar{}
结果是:{method="GET"} 2

PromQL:foo{} + ignoring(path) bar{}
结果是:{job="demo", method="GET", status="200"} 2
# 解释:
1:on:只匹配这个标签做运算
2:ignoring:不匹配某个或某些标签匹配
11.7.2.2:一对多多对一
上面讲解的一对一的向量计算是直接的方式,在多数情况下,on或者ignoring修饰符有助于查询返回合理的结果,但是通常情况用于计算讲个向量之间并不是一对一的关系,更多的是一对多或者多对一的关系,对于这种场景我们就不能简单的使用上面的方式进行处理了。
多对一和一对多两种匹配模式是指一侧的每一个向量元素可以与多侧的多个元素匹配的情况,在这种情况下,必须使用group进行修饰:group_left或者group_right来决定哪儿一个向量具有更高的基数(充当多角色),多对一和一对多两种模式一定是出现在操作符两侧表达式返回的向量标签不一致的情况,因此同样需要用 ignoring和on进行修饰来排除或匹配标签列表
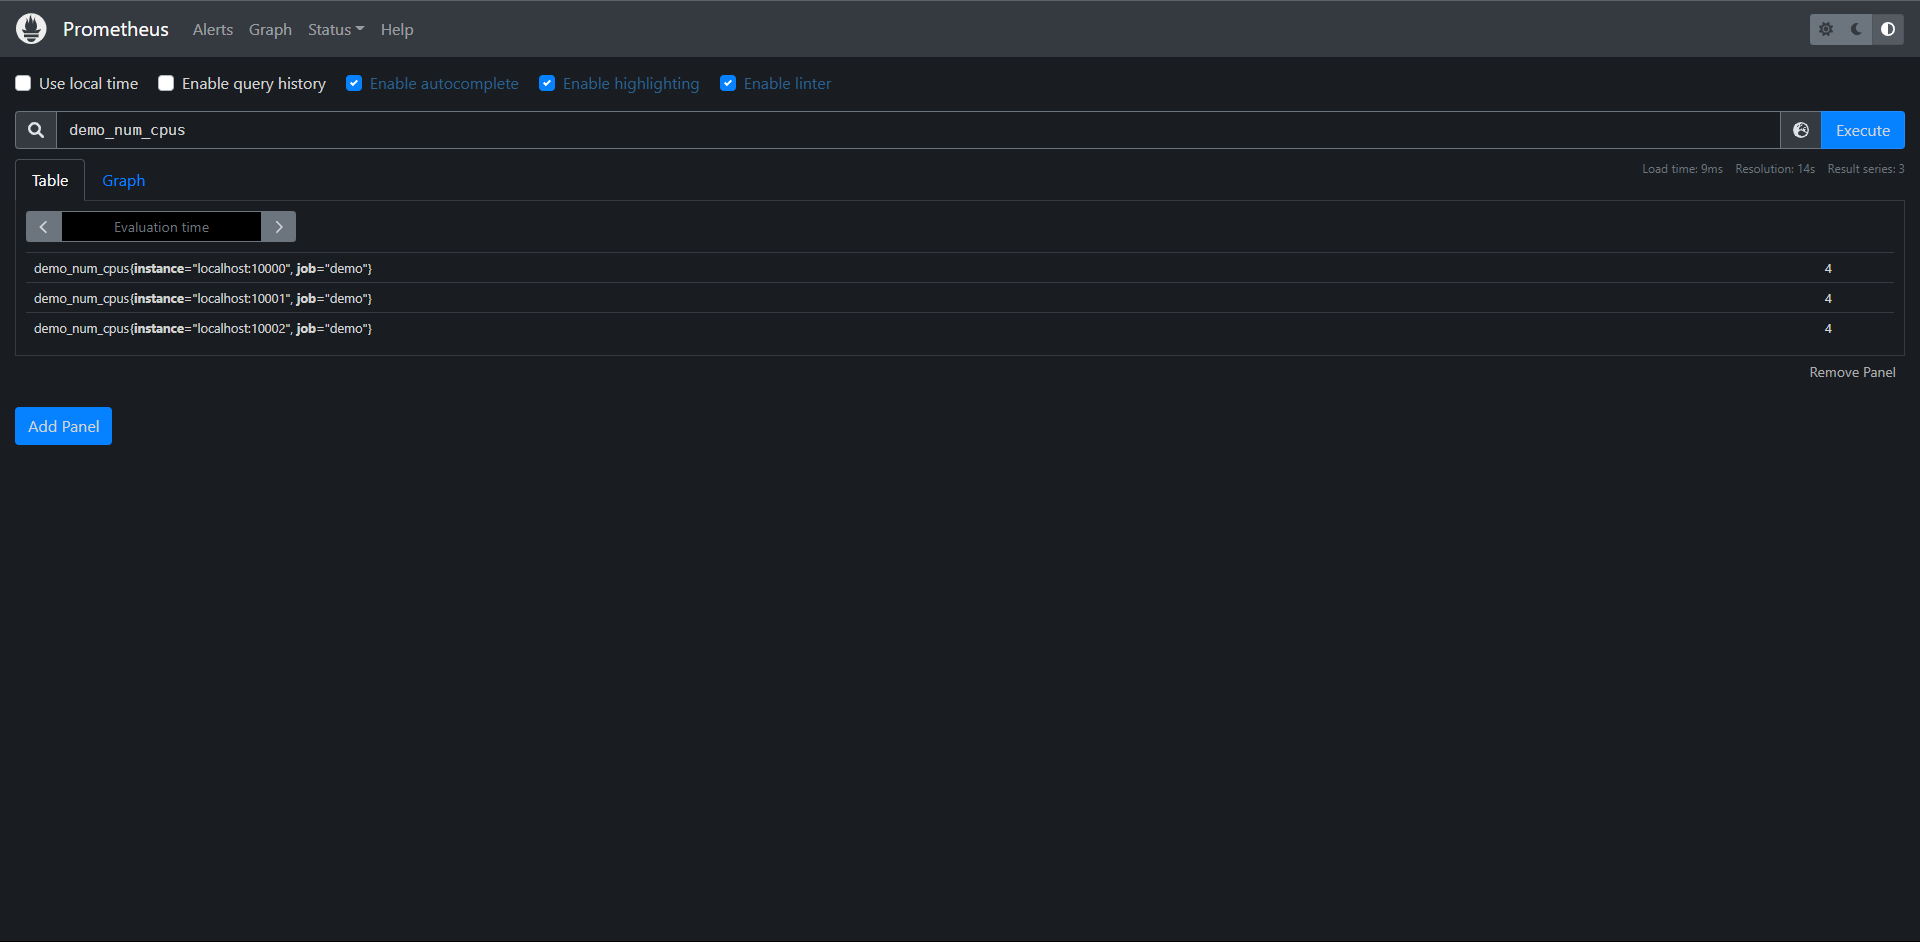
例如:demo_num_cpus指标告诉我们每个实例的CPU核心数量,只有instance和job这两个标签
PromQL:demo_num_cpus
而demo_cpu_usage_seconds_total指标则多出一个mode标签维度,将每个mode模式(idle,system,suer)的CPU使用情况分开进行了统计

PromQL:demo_cpu_usage_seconds_total
如果要计算每个模式的CPU使用量除以核心数,我们需要告诉除法运算符按照demo_cpu_usage_seconds_total指标上的额外的mode标签维度对结果进行分组,我们可以使用group_left(表示左边的向量具有更高的基数)修饰符来实现,同时,我们还要通过on()修饰符明确将所考虑的标签集减少到需要的标签列表:

PromQL:rate(demo_cpu_usage_seconds_total{job="demo"}[5m]) / on(job,instance) group_left demo_num_cpus{job="demo"}
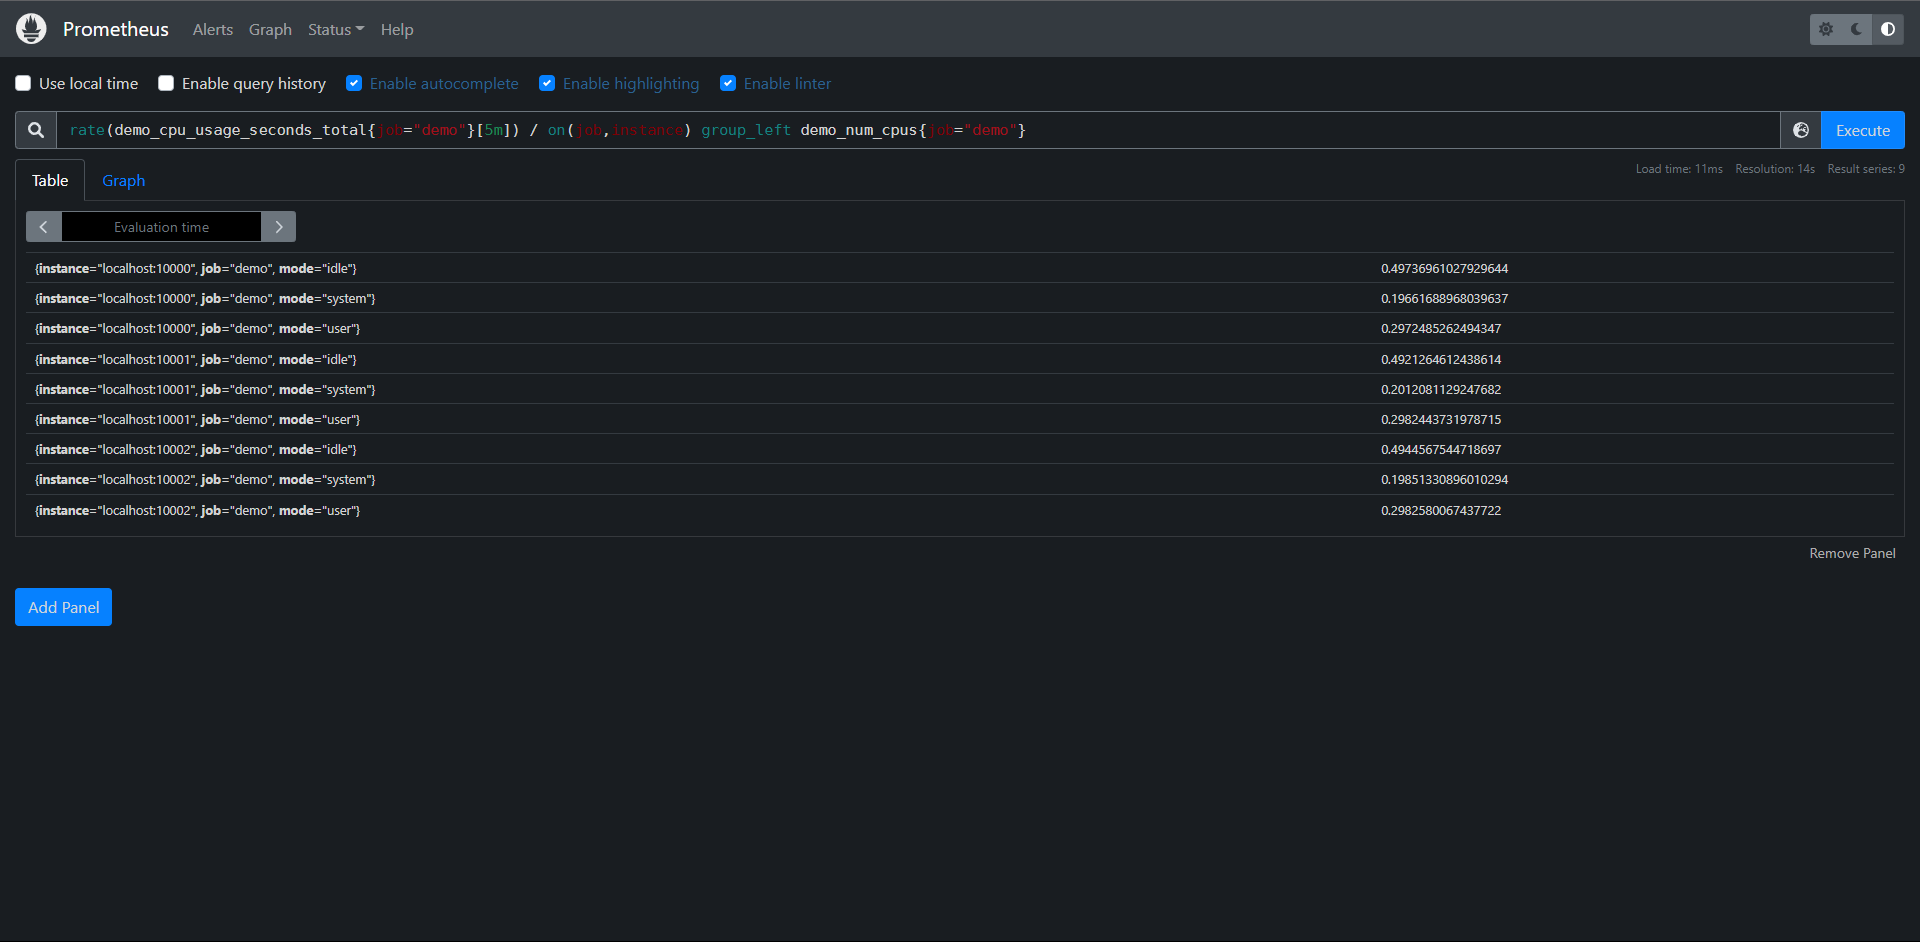
到这里我们就知道PromQL查询数据的时候进行标量和向量之间的运算了,不过我们在使用PromQL查询数据的时候还需要避免使用关联查询,先想想能不能通过Relabel(后续介绍)的方式给原始数据加多个Label,一条语句能查出来何必用join呢?时序数据库不是关系数据库。

练习:
1:计算过去5分钟所有POST请求平均数的总和相对于所有请求平均数总和的百分比
PromQL:
sum(
    rate(
        demo_api_request_duration_seconds_count{job="demo",method="POST"}
        [5m]
    )
)
/
sum(
    rate(
        demo_api_request_duration_seconds_count
        [5m]
    )
)
* 100

2:计算过去5分钟内每个实例的user和system的模式(demo_cpu_usage_seconds_total指标)下CPU使用量平均值总和
PromQL:
sum by(instance,job)
    (rate
        (demo_cpu_usage_seconds_total{mode=~"user|system"}
            [5m]
        )
    )
# 第二种
sum without(mode)
    (rate
        (demo_cpu_usage_seconds_total{mode=~"user|system"}
            [5m]
        )
    )
# 第三种
rate(
    demo_cpu_usage_seconds_total{mode="user"}
    [5m]
 )
 + ignoring(mode)
 rate(
     demo_cpu_usage_seconds_total{mode="system"}
     [5m]
 )
11.8:阈值
PromQL通过提供一组过滤的二元运算符(<,>,== 等),允许根据其样本值过滤一组序列,这种过滤最常见的场景就是在报警规则中使用的阈值,比如我们想查找在过去15分钟内的status="200"和"500"请求率大于20%的所有http路径,我们在rate表达式后加一个>0.2的过滤运算符

PromQL:rate(demo_api_request_duration_seconds_count{status=~"500|200"}[15m]) > 0.2
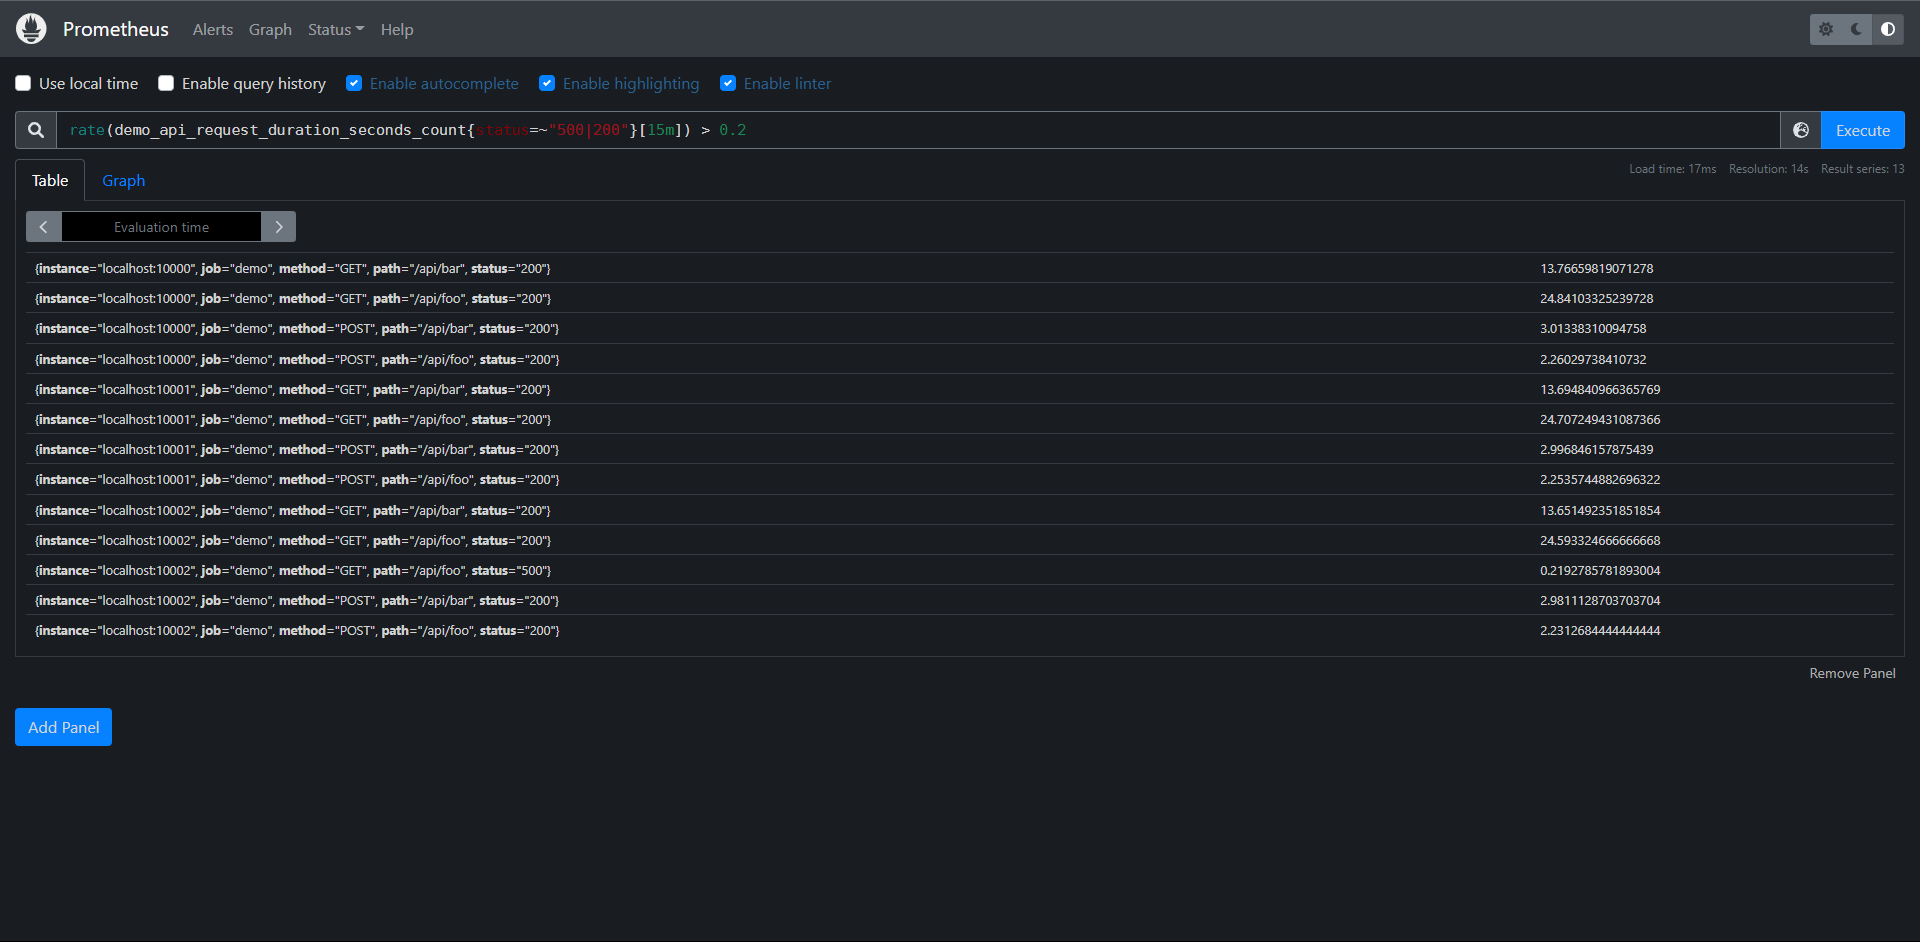
注意:由于在图形中每个步长都是完全独立评估表达式的,因此根据每个步骤的过滤条件,某些比率会出现或消失(因此存在间隙),一般来说,二元过滤运算符在图形中不常见,大多在报警中常见,用于表示阈值。
这种过滤方式不仅用于过滤单个数字,PromQL还允许你用一组时间序列过滤另一组序列,与上面的二元运算一样,比较运算符会自适应用于比较左侧和右侧具有相同标签集的序列之间,on()/ignoring()和group_left()/group_right()修饰符的作用也于前面的二元算术符一样
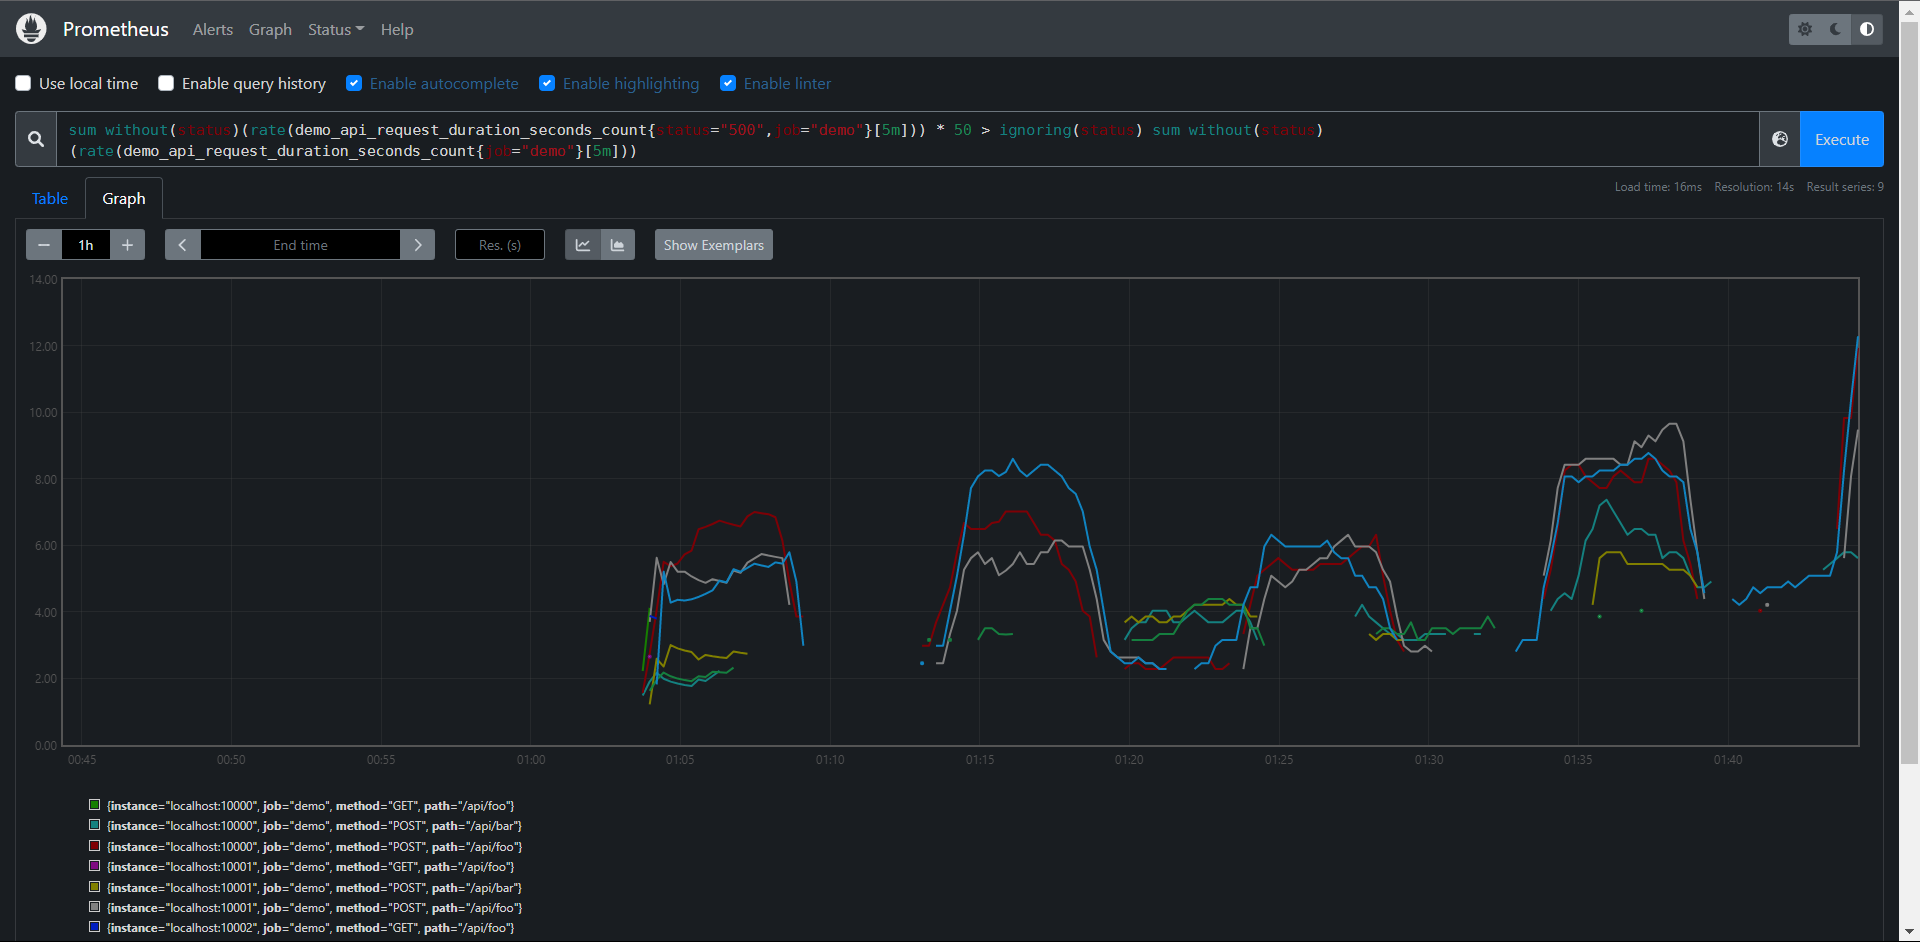
比如:选择所有具有500错误率且至少同一路径的总数请求率大50倍的路径。
PromQL:
sum without(status)(
rate(
demo_api_request_duration_seconds_count{status="500",job="demo"}
[5m]
)
) * 50
> ignoring(status)
sum without(status)(
rate(
demo_api_request_duration_seconds_count{job="demo"}
[5m]
)
)
正如我们所说,它会出现一些断续。
# 注意:我们必须忽略匹配中的status,因为在左边的语句一直有这个标签,而右边却没有这个标签
比如我们还可以计算demo演示服务实例在一小时内的预测磁盘使用量,但是过滤只有那些预测磁盘已满的实例:
PromQL:predict_linear(demo_disk_usage_bytes{job="demo"}[1h], 3600) >= demo_disk_total_bytes{job="demo"}
这个在demo内是暂时没有数据的,但是PormQL是这么写的
Prometheus支持以下过滤操作:
1:==
2:!=
3:<
4:<=
5:>
6:>=
有时你可能想知道比较运算符的结果而不实际删除任何输出序列,要实现这一点,我们可以向运算符添加一个bool修饰符来保留所有的序列,但是把输出的样本值设置为1(比较为真)或者0(比较为假)
例如:要简单的显示一组数据中哪儿些请求率高于或低于0.2/s,我们可以做如下查询:
PromQL:rate(demo_api_request_duration_seconds_count{job="demo"}[5m]) > bool 0.2
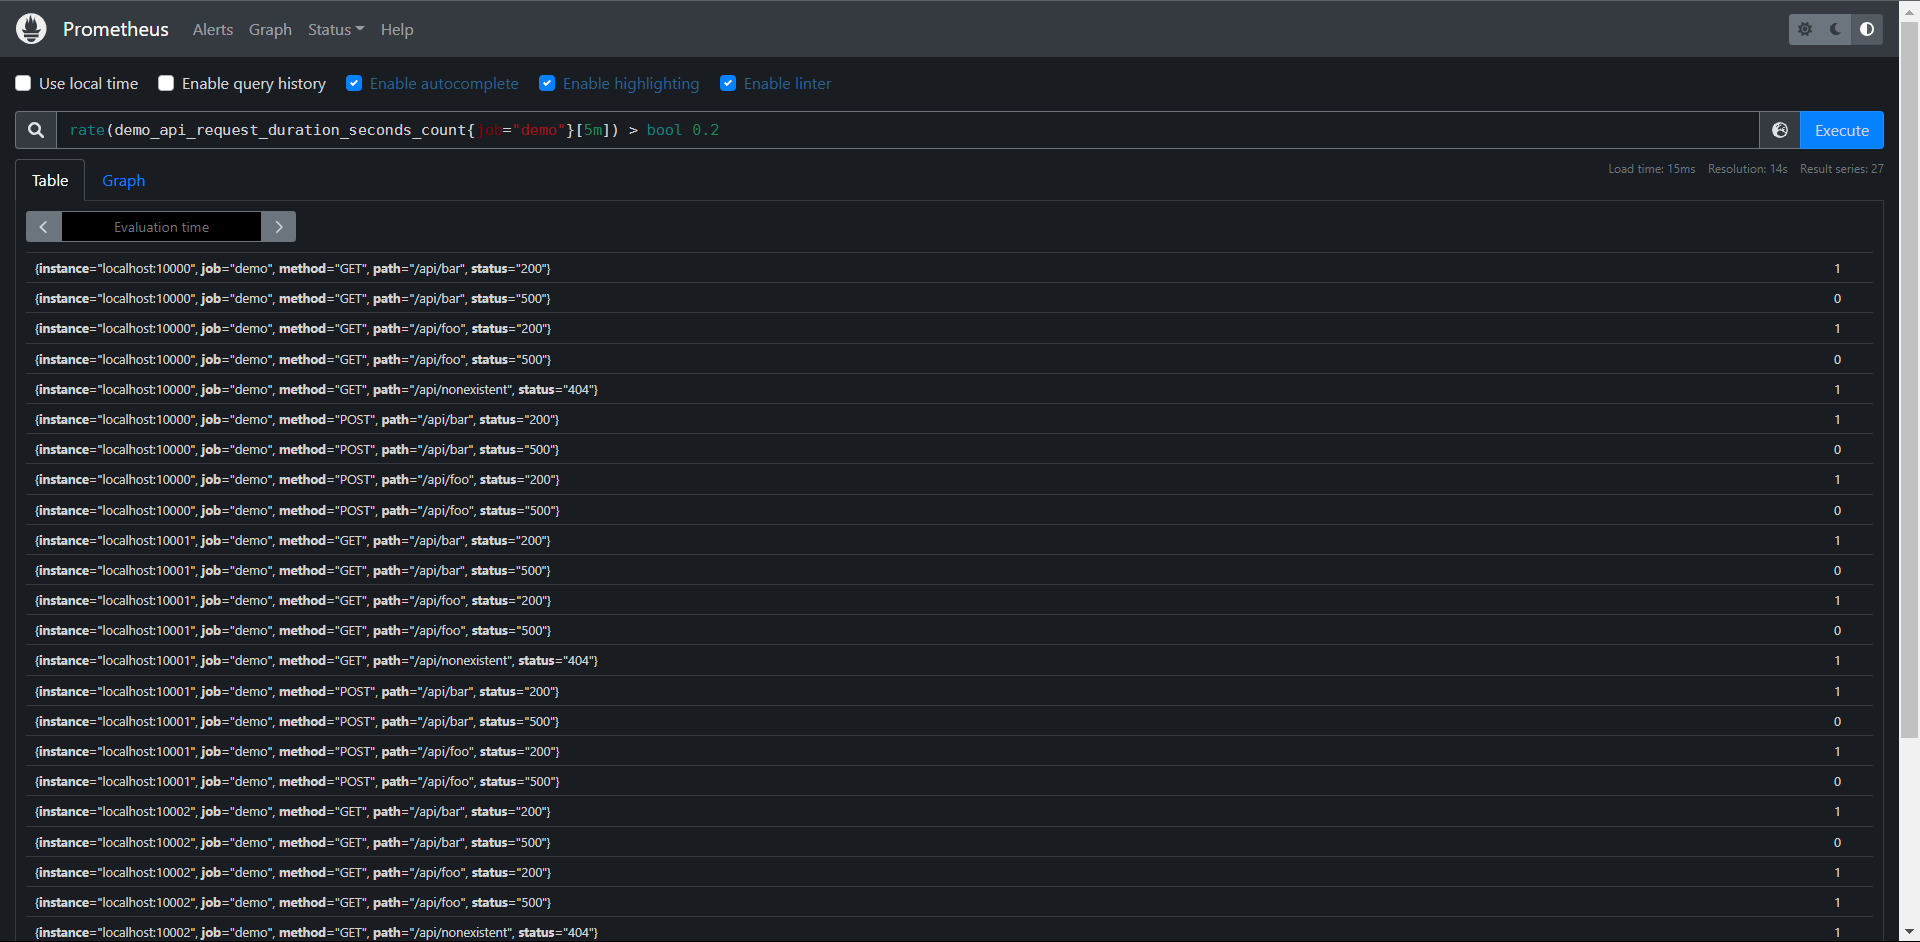
我们可以看到输入序列的结果为0或1,把数字条件转换为布尔输出值

练习:
1:构建一个查询,显示使用少于20MB内存的目标(process_resident_momory_bytes指标)
PromQL:process_resident_memory_bytes{job="demo"} / 1024^2 < 20
2:构建一个查询,显示Prometheus服务内所有过去5分钟内没有收到任何查询的HTTP处理器
PromQL:rate(prometheus_http_requests_total[5m]) == 0
11.9:集合
有时候我们需要过滤一组时间序列与另一组时间序列进行合并,Prometheus提供了三个在瞬时向量之间操作的集合运算符

1:and(集合交集):比如对较高的错误率触发报警,但是只有当对应的总错误率超过某个阈值的时候才会触发告警
2:or(集合并集):对序列进行并集计算
3:unless(除非):比如要对磁盘空间不足进行告警,除非它是只读文件系统

与算术和过滤二元运算符类似,这些集合运算符会尝试根据相同的标签集在左侧和右侧之间查找来匹配序列,除非你提供on()或ignoring()修饰符来指定如何找到匹配。
注意:与算术和过滤二进制运算符相比,集合运算符没有group_left和group_right修饰符,因为集合运算符总是进行多对多的匹配,也就是说,它们总是允许任何一边的序列与另一边的多个序列相匹配
对于and运算符,如果找到一个匹配的,左边的序列就会成为输出结果的一部分,如果右边没有匹配到序列,则不会 输出任何结果。
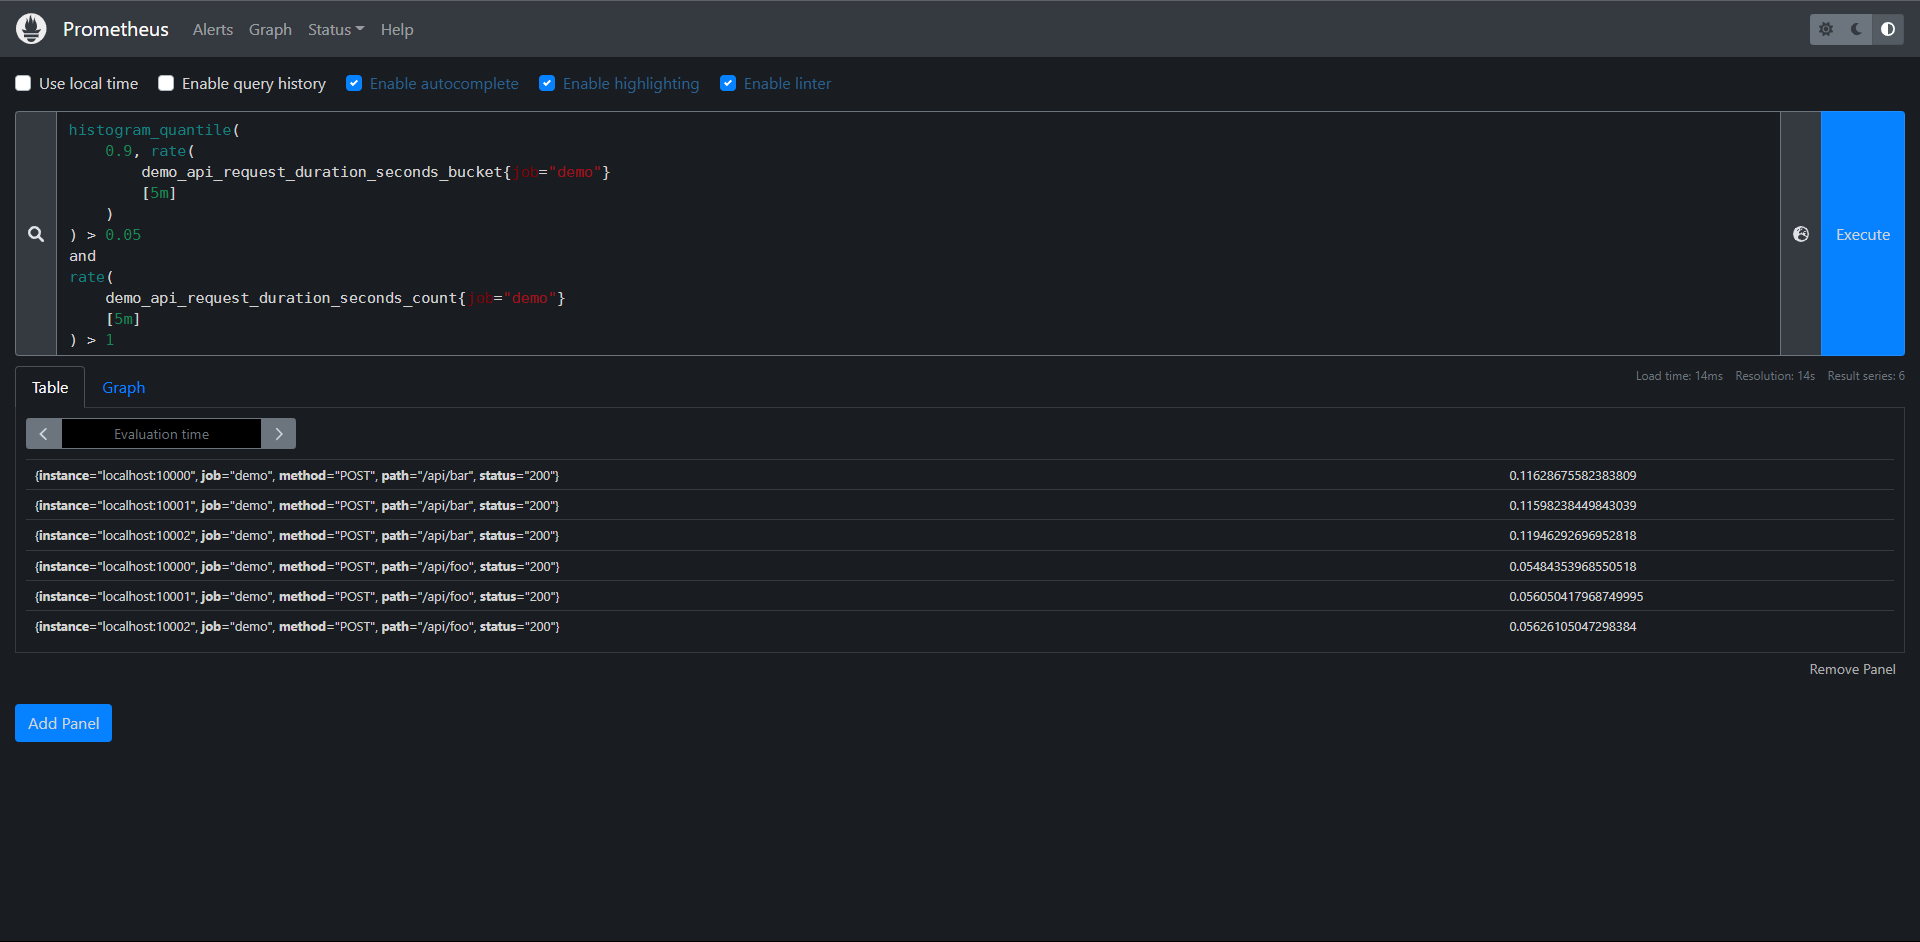
例如:我们想筛选出第90个百分位延迟高于50ms的所有http端点,但只针对每秒收到多个请求的维度组合,查询方式如下:
PromQL:
histogram_quantile(
0.9, rate(
demo_api_request_duration_seconds_bucket{job="demo"}
[5m]
)
) > 0.05
and
rate(
demo_api_request_duration_seconds_count{job="demo"}
[5m]
) > 1
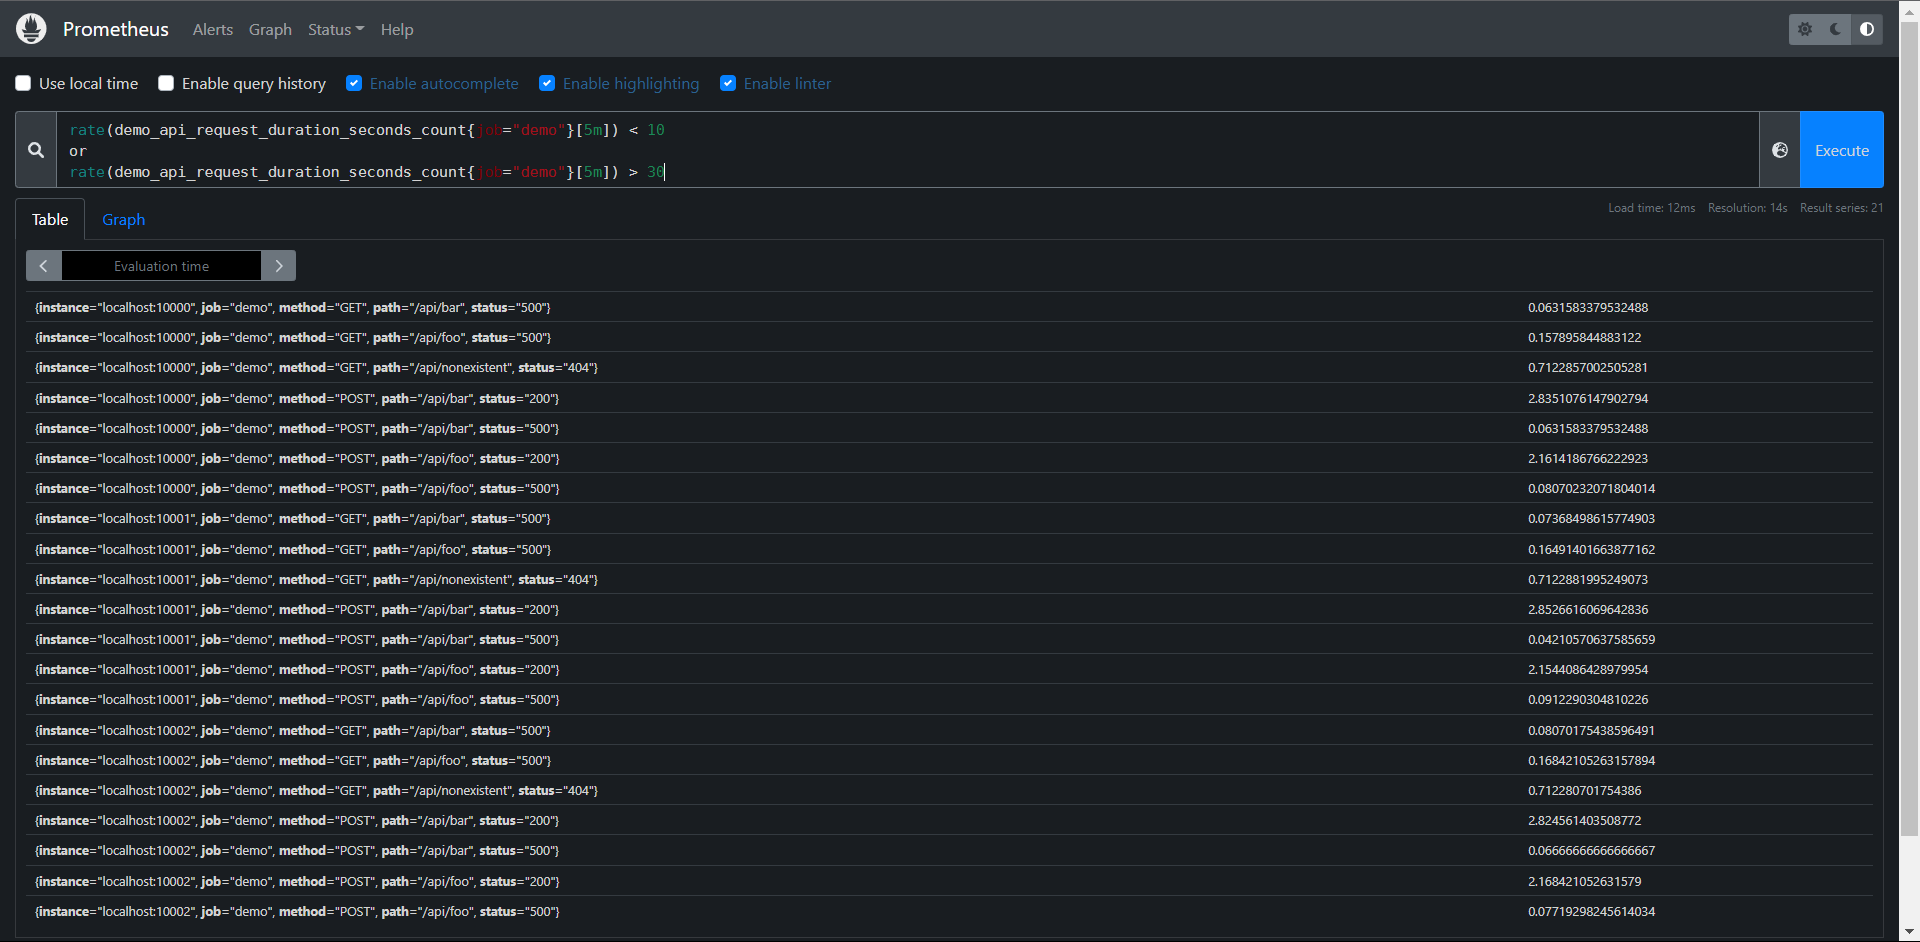
有的时候我们需要对两组序列进行合并操作,而不是交集,这个时候我们就要使用到or集合运算符,产生的结果是运算符左侧的序列,加上来自右侧但左边没有匹配标签集的时间序列,比如我们要列出所有低于10或者高于30的请求率,则可以使用下面的表达式:

PromQL:
rate(
    demo_api_request_duration_seconds_count{job="demo"}
    [5m]
) < 10
or
rate(
    demo_api_request_duration_seconds_count{job="demo"}
    [5m]
) > 30
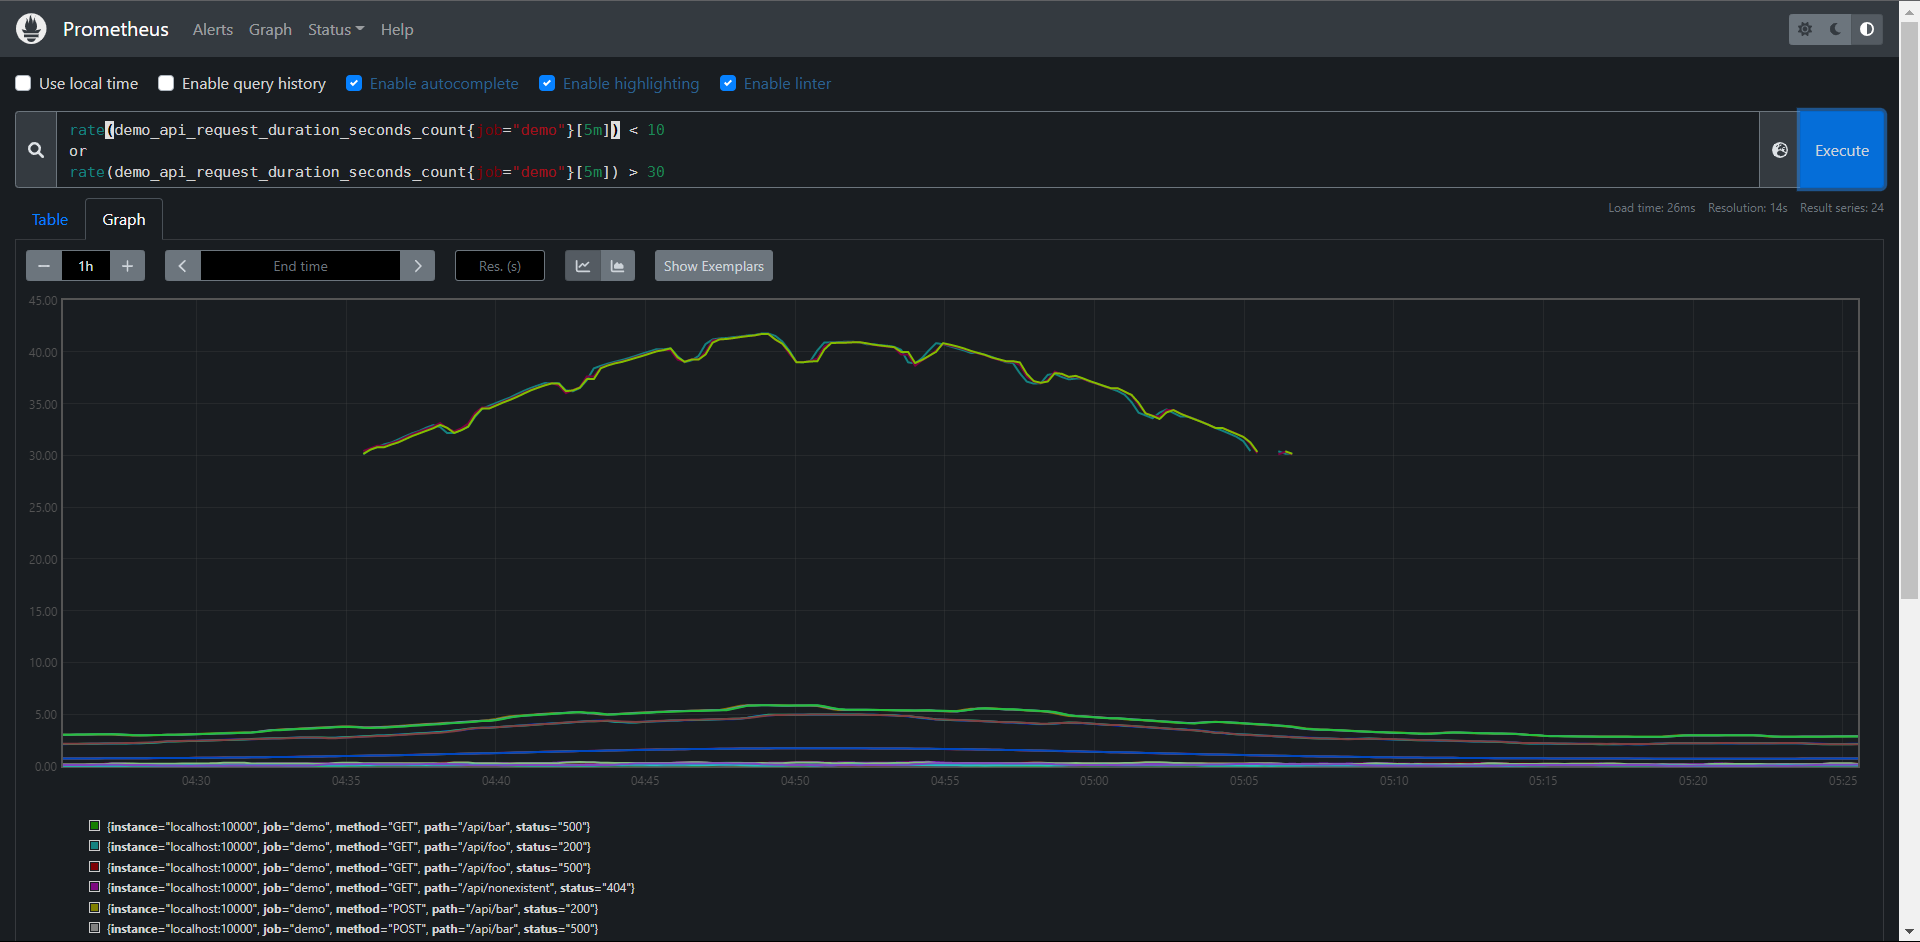
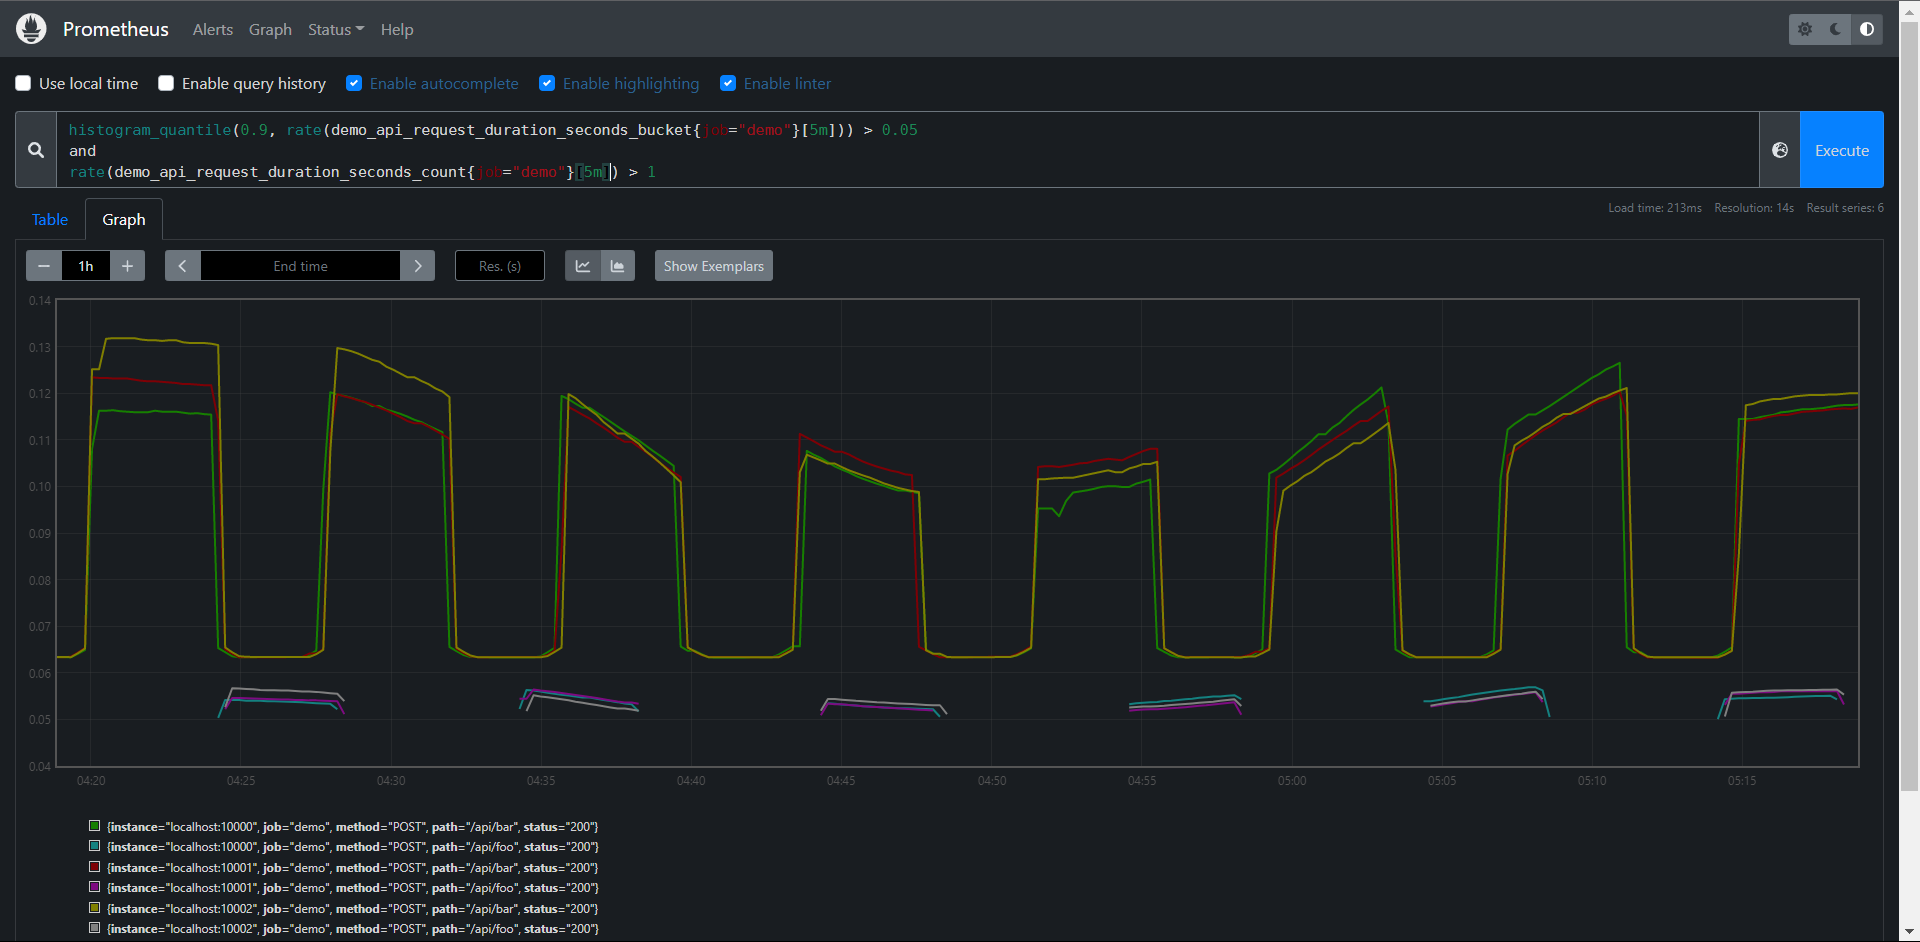
我们可以看到图中使用值过滤器和集合草最会导致时间序列在图中有断点的现象,这取决于它们在图中的时间间隔下是否能够于过滤器匹配,所以一般情况下,我们建议只在告警规则种使用这种过滤操作。
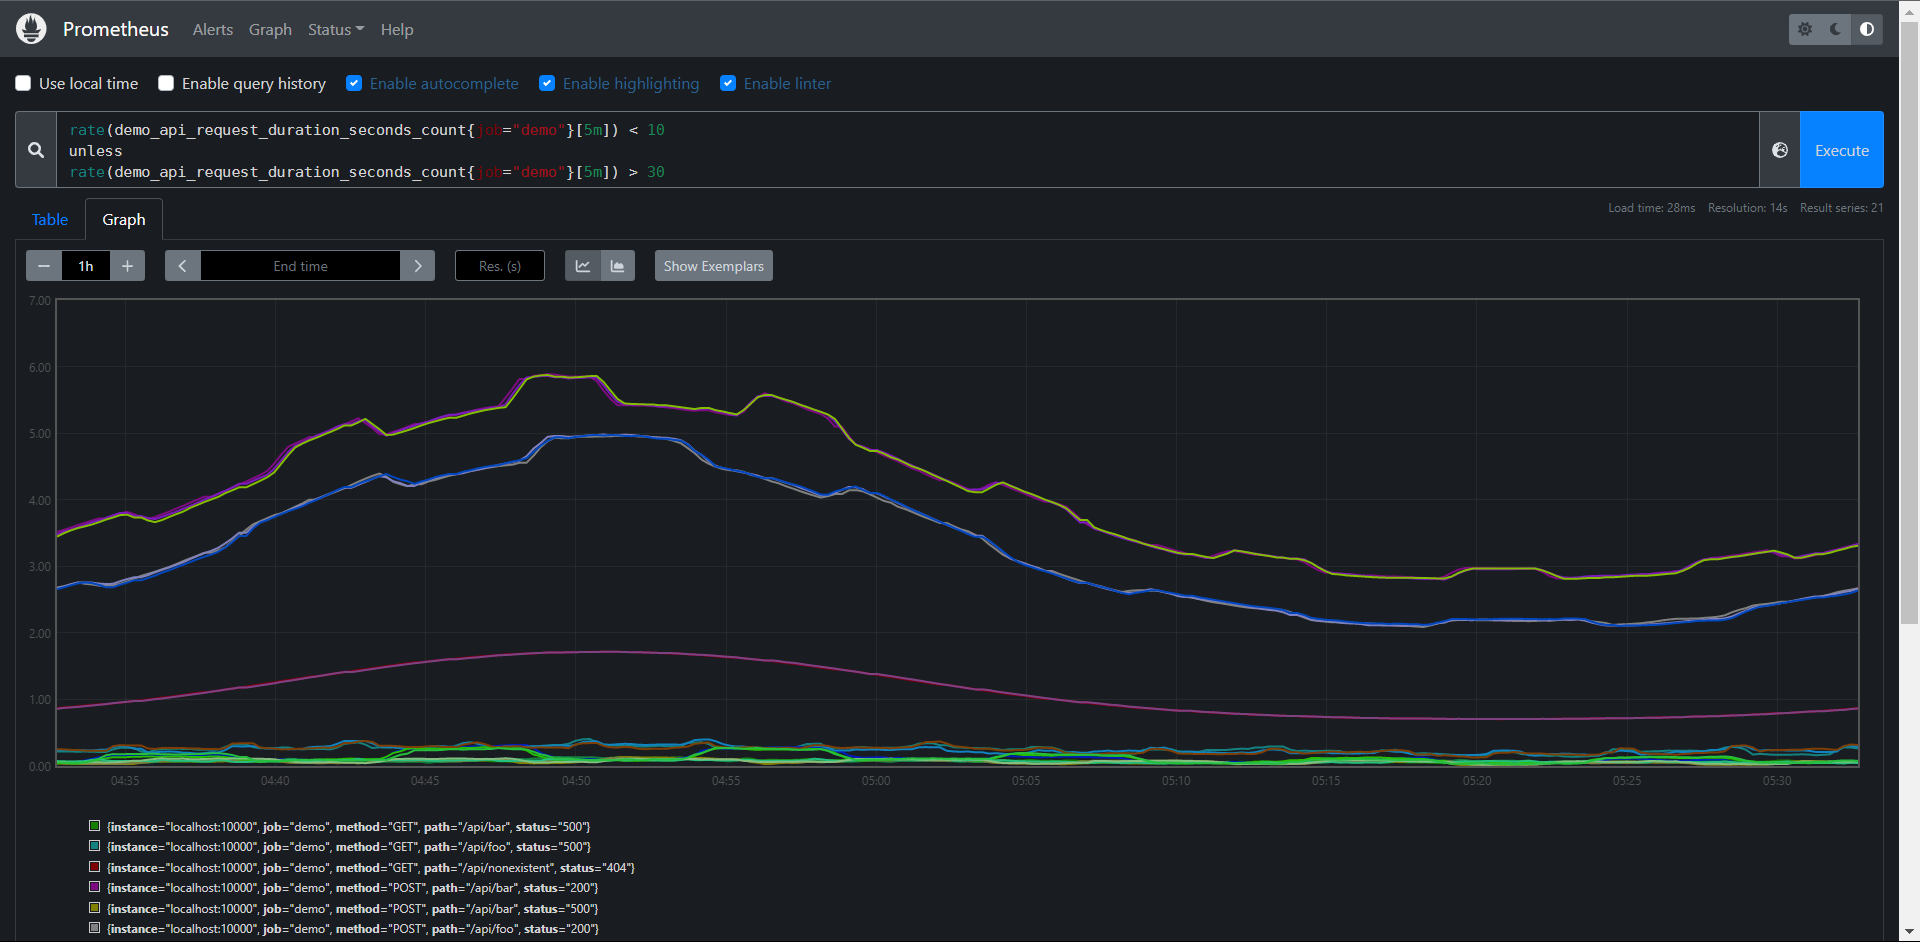
还有一个 unless操作符,它只会保留左边的时间序列,如果右边不存在相等的标签集和的话
PromQL:
rate(
demo_api_request_duration_seconds_count{job="demo"}
[5m]
) < 10
unless
rate(
demo_api_request_duration_seconds_count{job="demo"}
[5m]
) > 30
练习:
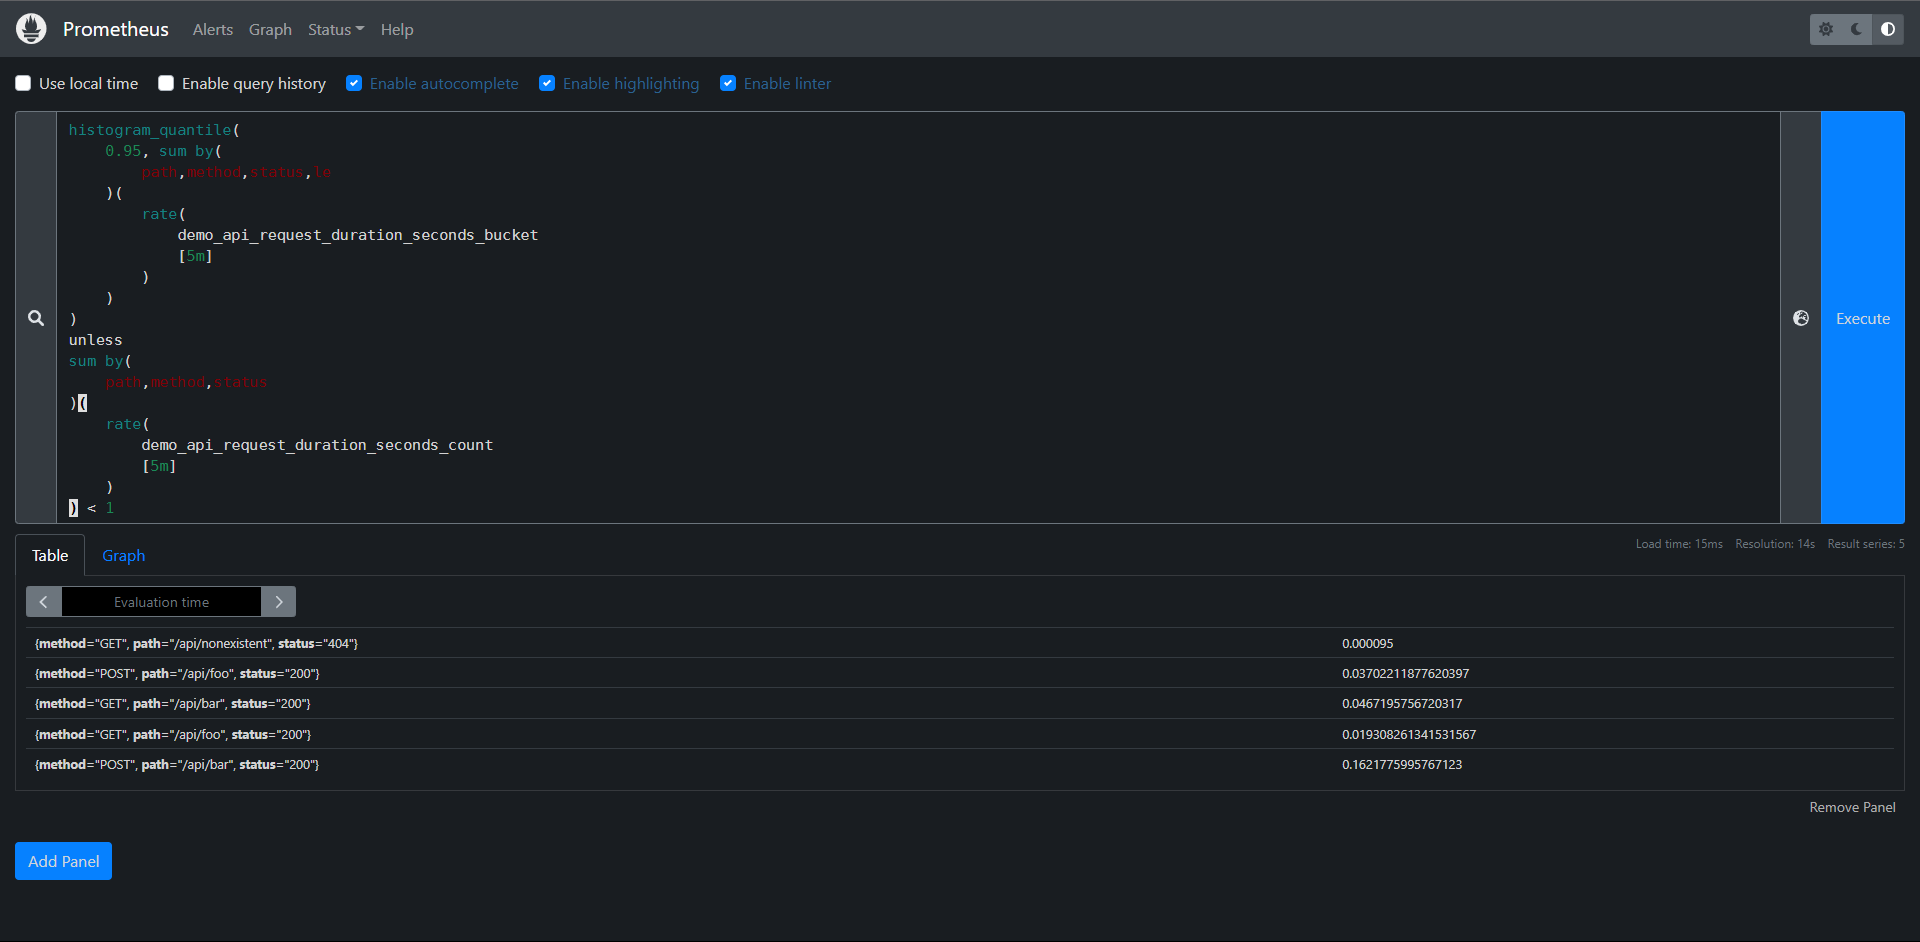
1:构建一个查询,显示按path,method,status(5分钟内平均)划分的demo API请求的第95个百分位延迟,除非这个维度组合每秒收到的请求小于1个请求(5分钟内平均)
PromQL:
histogram_quantile(
0.95, sum by(
path,method,status,le
)(
rate(
demo_api_request_duration_seconds_bucket
[5m]
)
)
)
unless
sum by(
path,method,status
)(
rate(
demo_api_request_duration_seconds_count
[5m]
)
) < 1
11.10:排序
接下来我们要学习的就是如何对查询的结果进行排序,或者只选择一组序列中最大或最小的值。
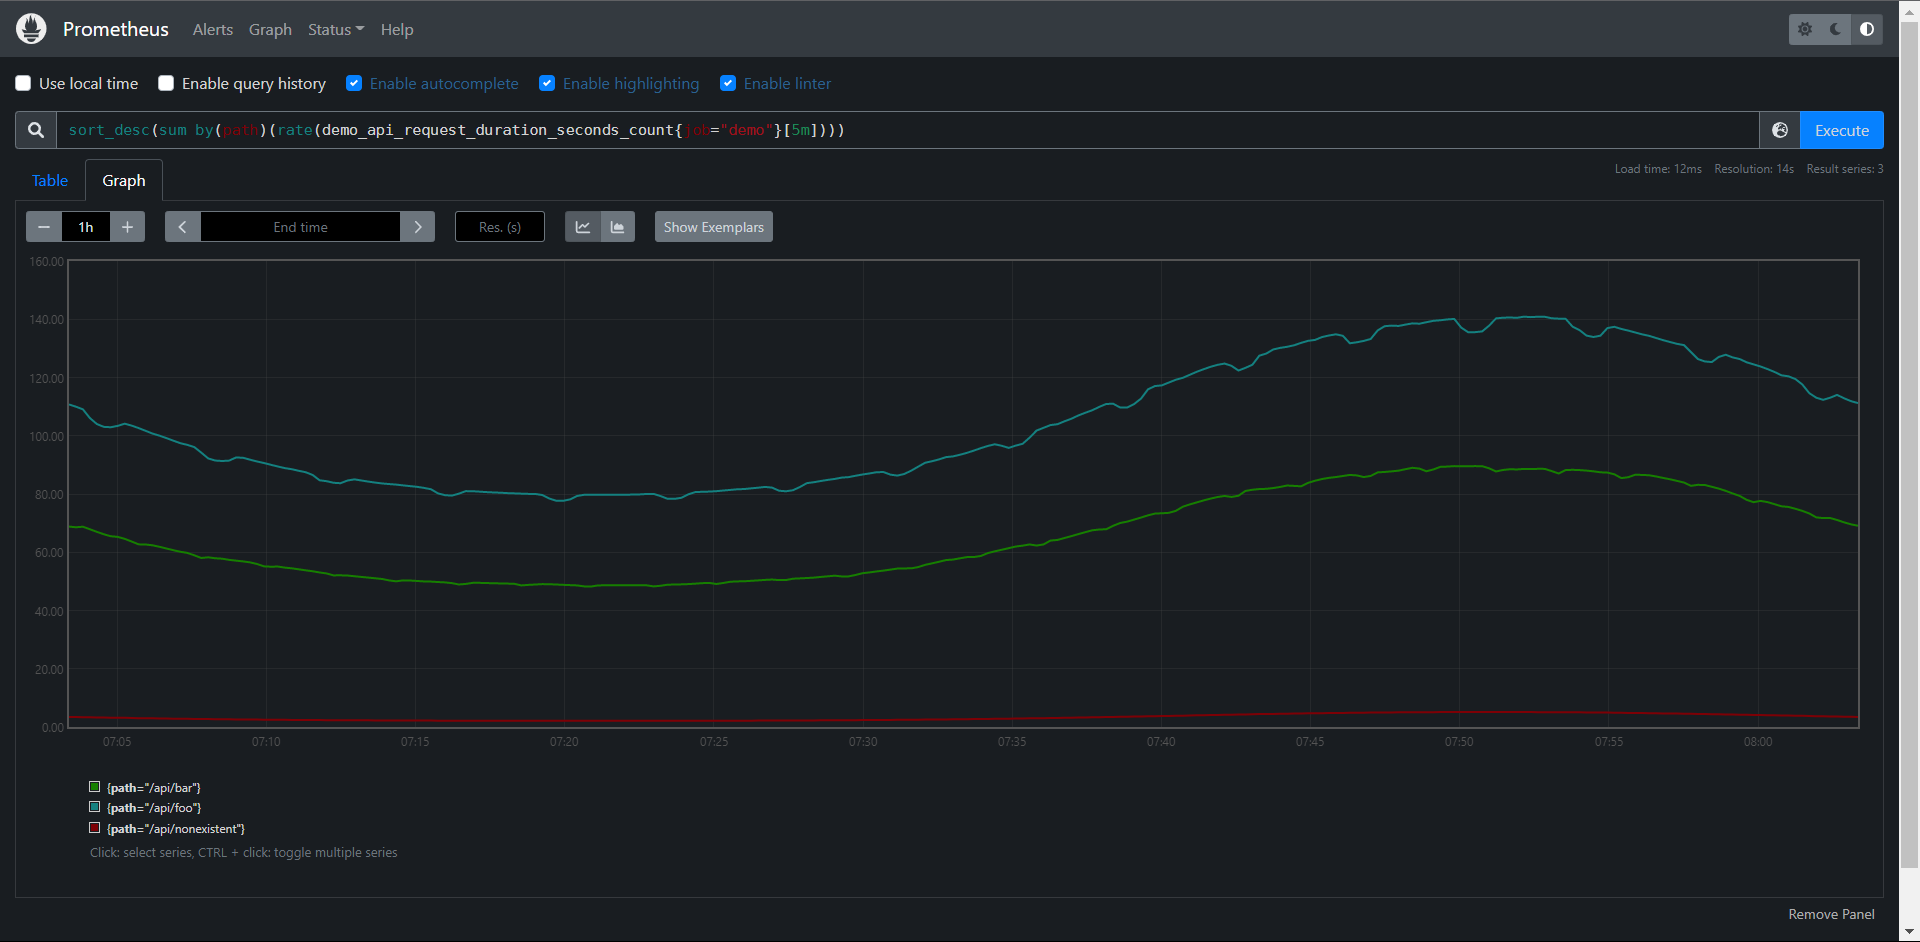
我们可以使用sort()升序,或者sort_desc()降序函数来实现对输出的结果进行排序,例如:要显示按值排序的每个路径的请求率,从高到低:
PromQL:sort_desc(sum by(path)(rate(demo_api_request_duration_seconds_count{job="demo"}[5m])))

升序
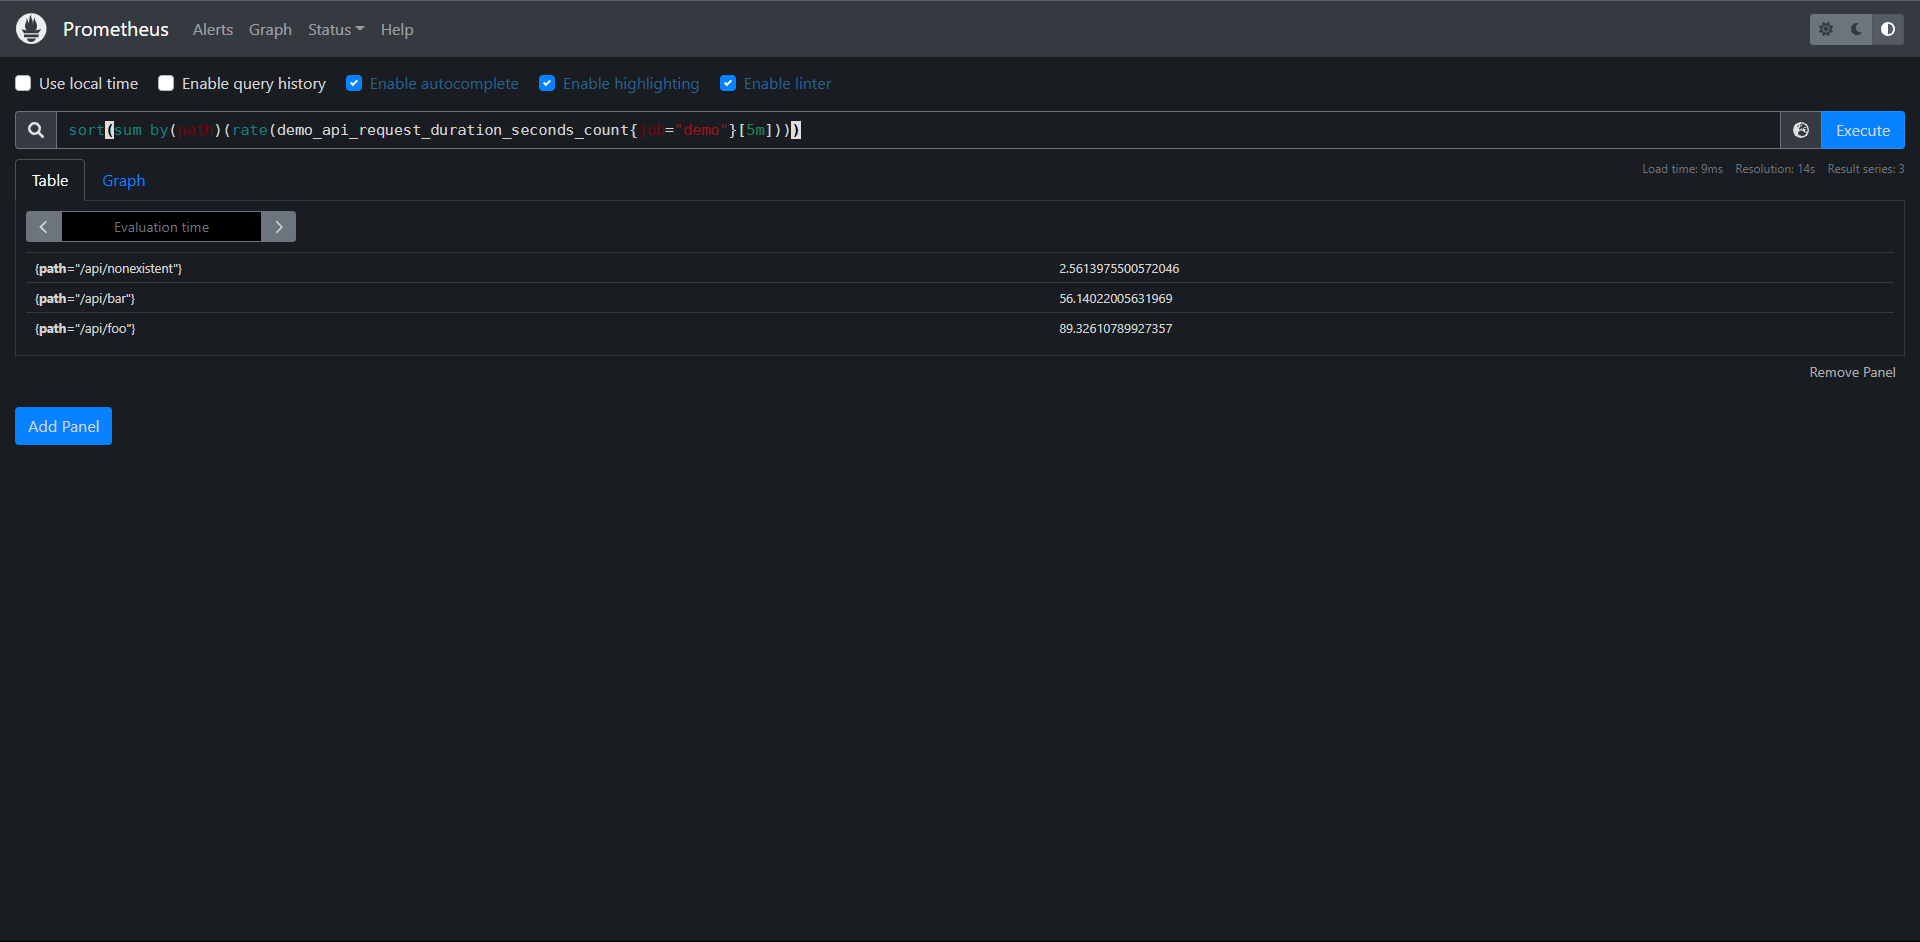
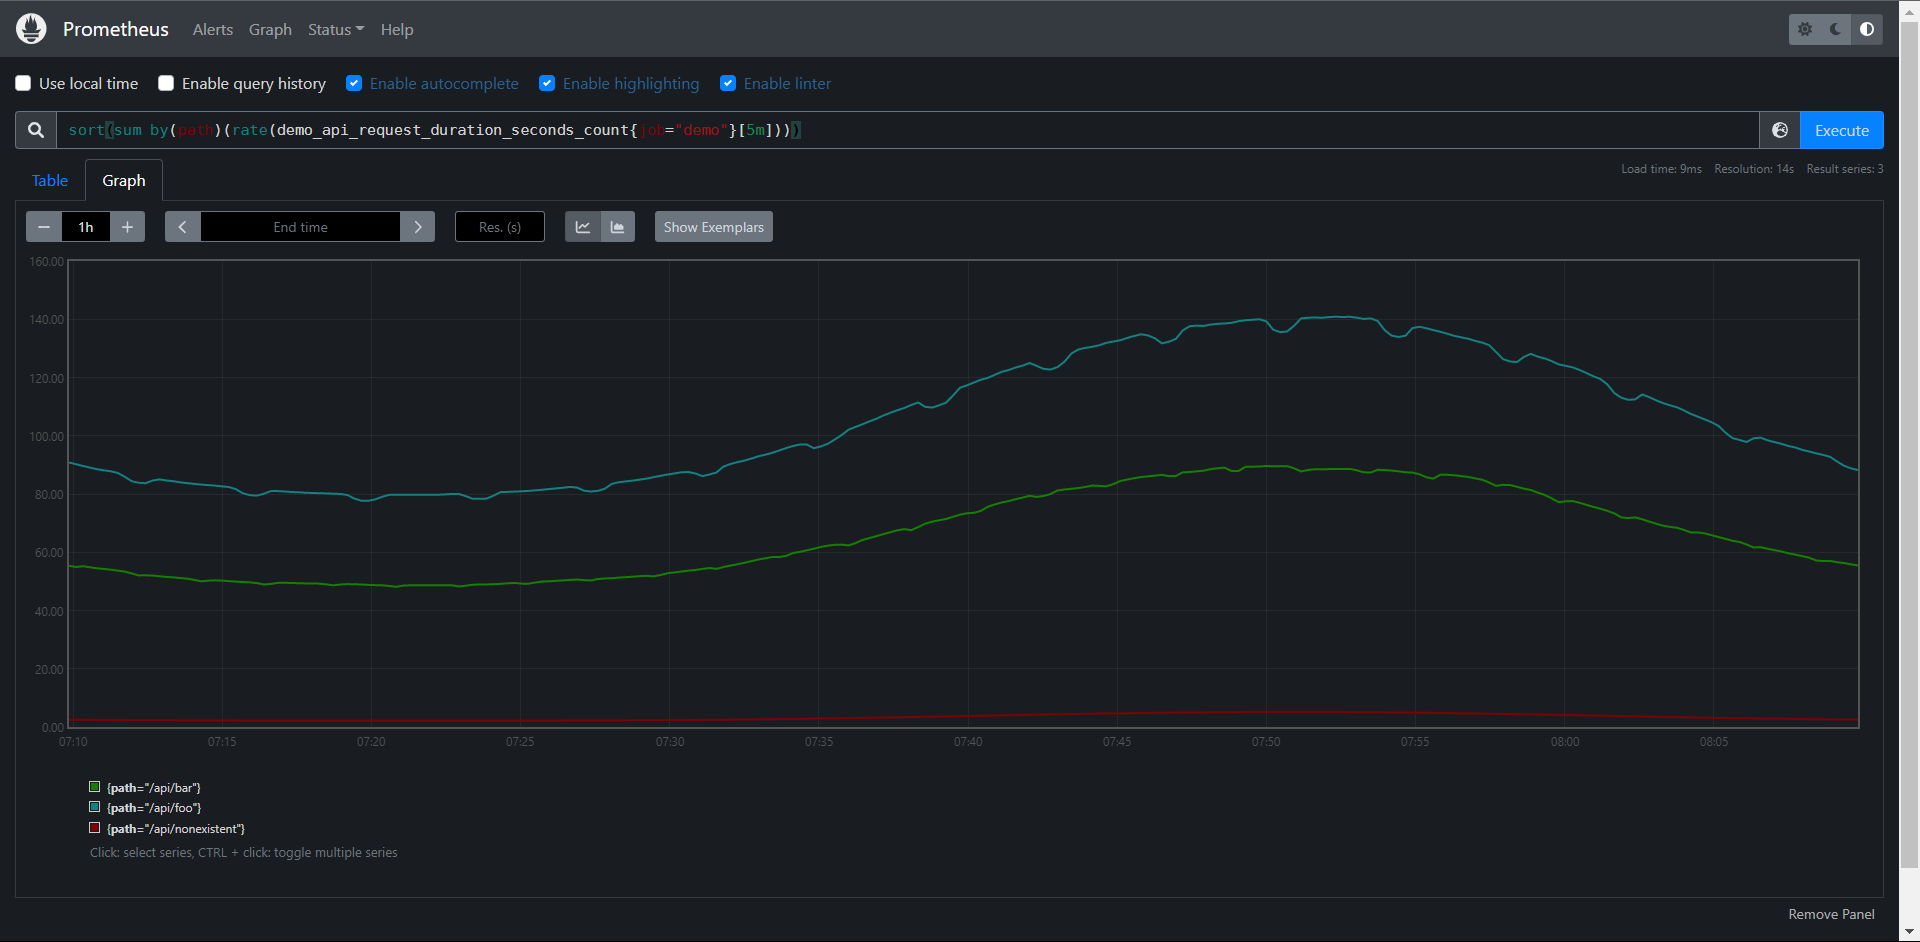
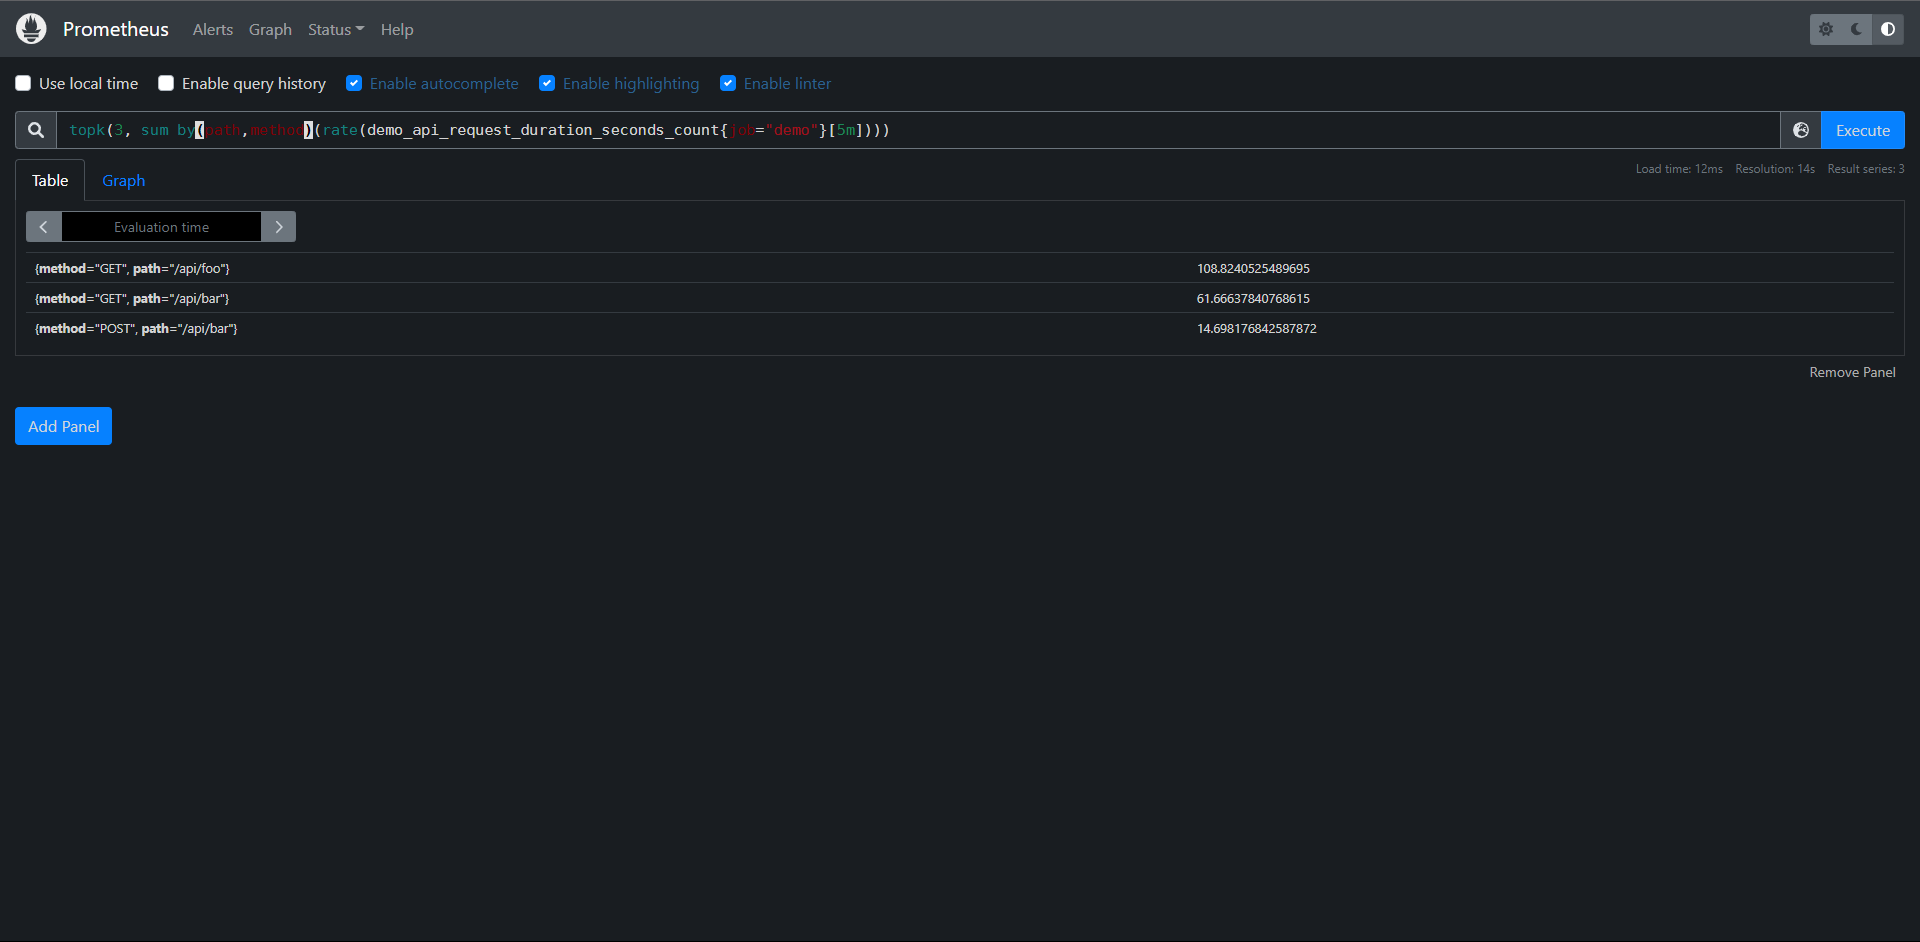
有时候我们并不是对所有的序列兴趣,只对最大值和最小值几个序列感兴趣,我们可以用topk()和bottomk()这两个运算符来操作。可以返回K给最大或最小值,比如只显示每个path的method的前三请求率:

PrmQL:topk(3, sum by(path,method)(rate(demo_api_request_duration_seconds_count{job="demo"}[5m])))
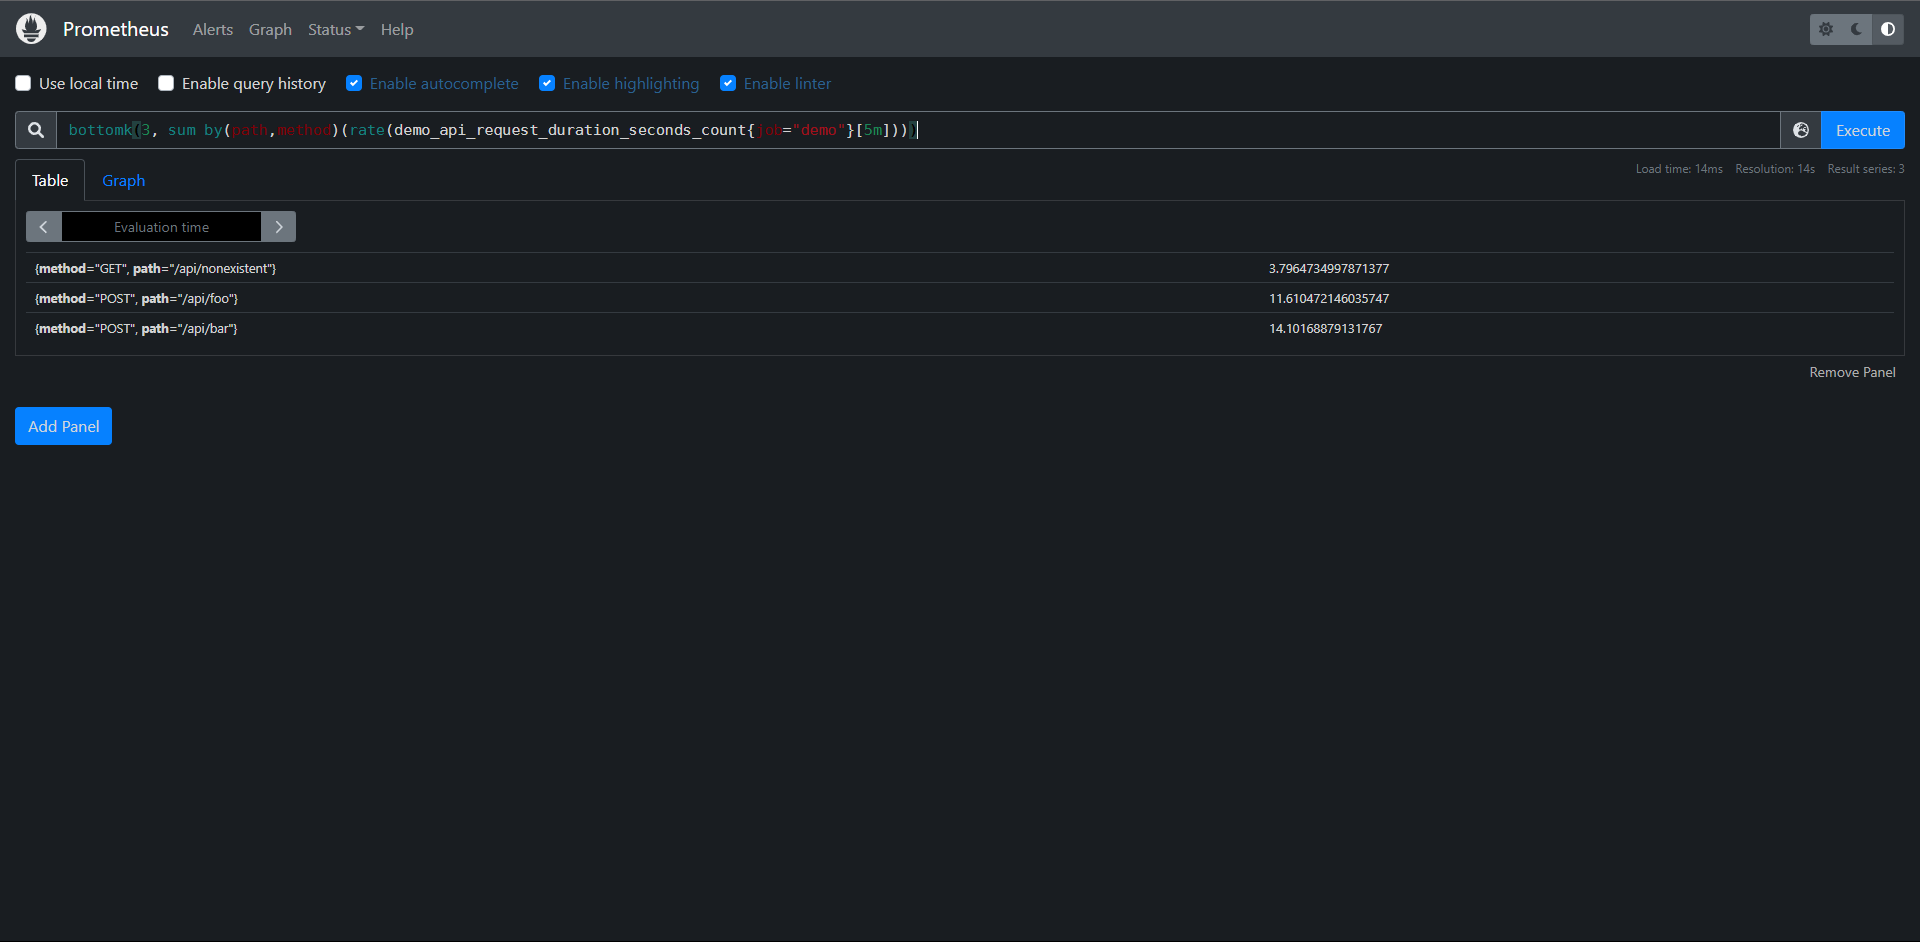
最小的三个
PromQL:bottomk(3, sum by(path,method)(rate(demo_api_request_duration_seconds_count{job="demo"}[5m])))
练习:
1:构建一个查询,以升序的方式显示3个demo服务的磁盘使用情况
PromQL:sort(demo_disk_usage_bytes) / 1024^2
2:构建一个查询,按method,path和status维度显示三个最低流量的demo API请求率
最低:PromQL:bottomk(3,sum by(path,method,status)(rate(demo_api_request_duration_seconds_count[5m])))
最高:PromQL:topk(3,sum by(path,method,status)(rate(demo_api_request_duration_seconds_count[5m])))
11.11:直方图
这里我们主要开学直方图指标,了解如何根据这些指标来计算分位数,Prometheus中的直方图指标允许一个服务记录一系列值得分布,直方图通常用于跟踪请求得延迟或响应得大小等指标值,当然理论上它是可以跟踪任何根据某种分布而产生波动数值得大小,Prometheus直方图是在客户端对数据进行采集,它们使用得一些可配置(例如延迟)bucket桶对观察到得值进行计数,然后将这些bucket作为单独得时间序列暴露出来。

我们来看一下直方图得例子:
在Prometheus内部,直方图被实现为一组时间序列,每个序列代表指定桶得计数(例如:10s以下得请求数,25s以下得请求数,50s以下得请求数 等),在Prometheus中每个bucket桶得计数器都是累加得,这就意味着较大的值得桶也包括所有低数值得桶得计数。在作为直方图一部分得,每个时间序列上,相应得桶由特殊得le标签表示,le代表得是小于或等于

Prometheus得直方图得计数是累计得,这就很奇怪,因为通常情况下非累积得直方图更容易理解,Prometheus为什么要这么做呢?想象一下,如果直方图指标加入额外得标签,或者划分了更多得bucket,那么样本数据得分析就会变得越来越复杂,如果直方图是累积得,在抓取指标时就可以根据需要丢弃某些bucket,这样可以降低Prometheus得维护成本得同时,还可以粗糙的计算样本值得分位数,通过这种方法,用户不需要修改应用代码,便可以动态减少抓取到得样本数量,另外直方图提供了_sum指标和_count指标,所以即使你丢弃了所有的bucket,仍然可以通过这两个指标来计算请求得平均响应时间,通过累积直方图得方式,还可以轻松得计算某个bucket得样本占所有样本数得比例

我们演示得demo中暴露了一个直方图指标 demo_api_request_duration_seconds_bucket,用于跟踪API请求时长得分布,由于这个直方图为每个跟踪的维度导出了26个bucket,因此这个指标有很多时间序列:

PromQL:
demo_api_request_duration_seconds_bucket{
    instance="localhost:10000",
    job="demo",
    method="POST",
    path="/api/bar",
    status="200"
}
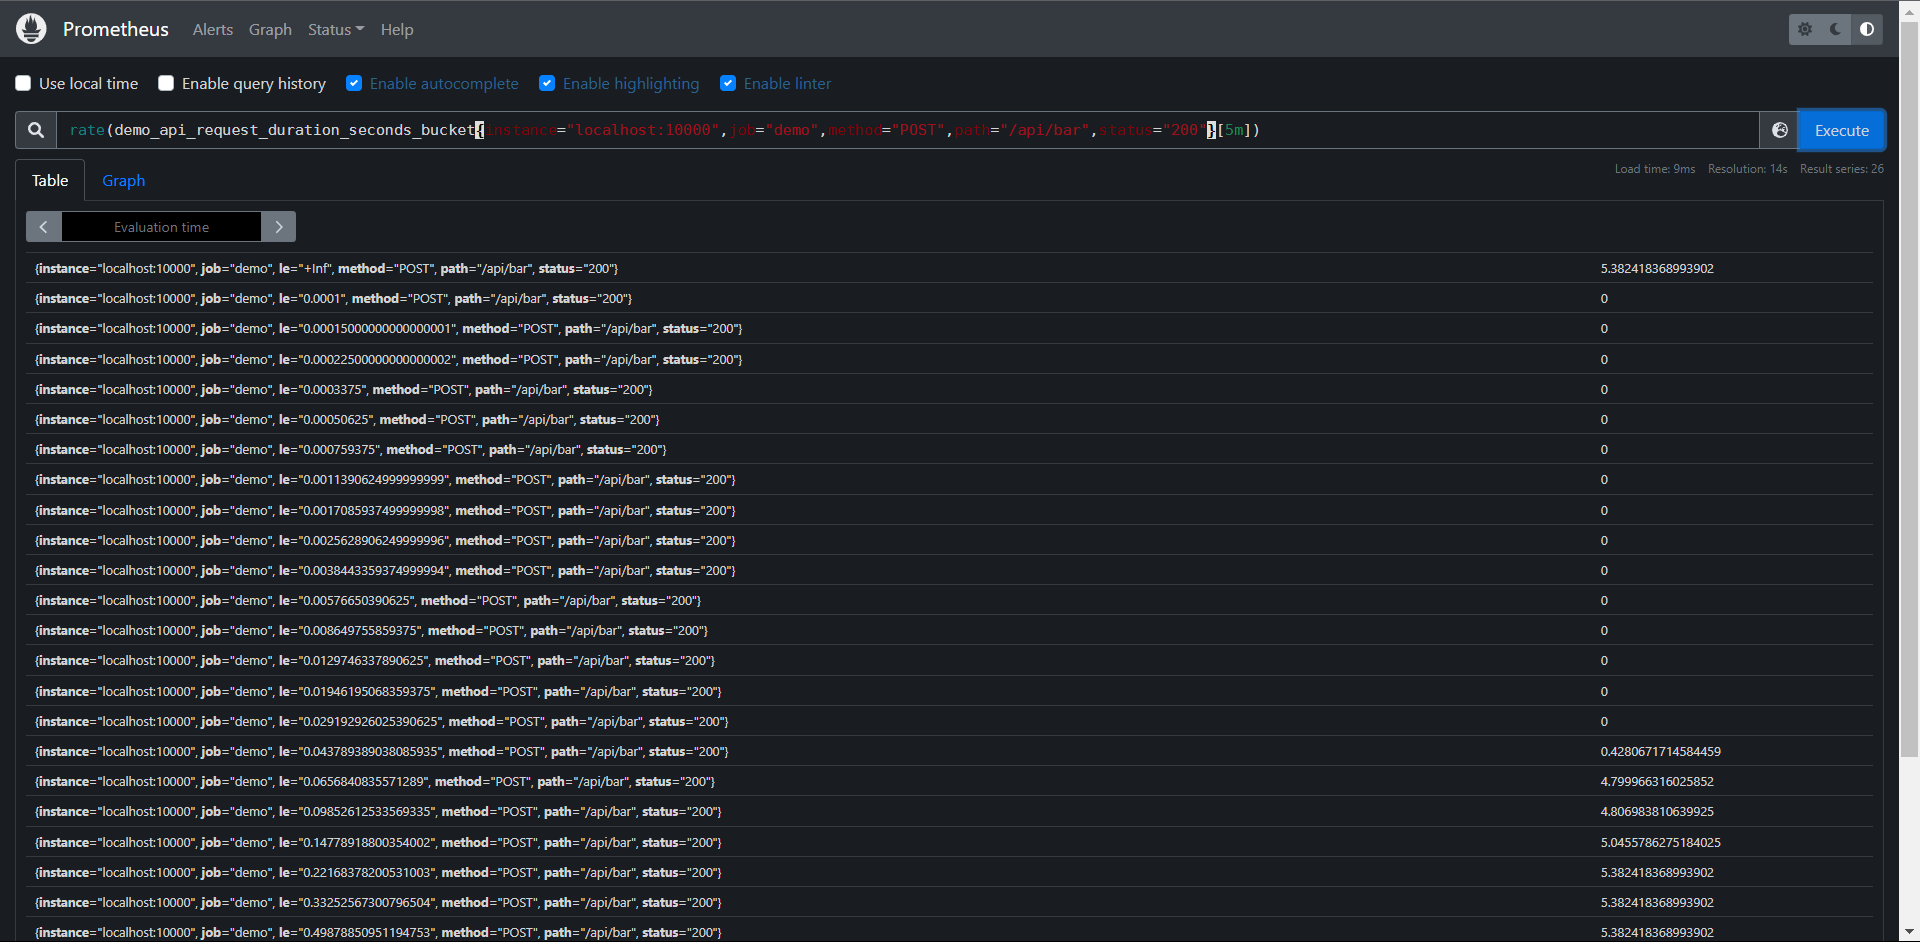
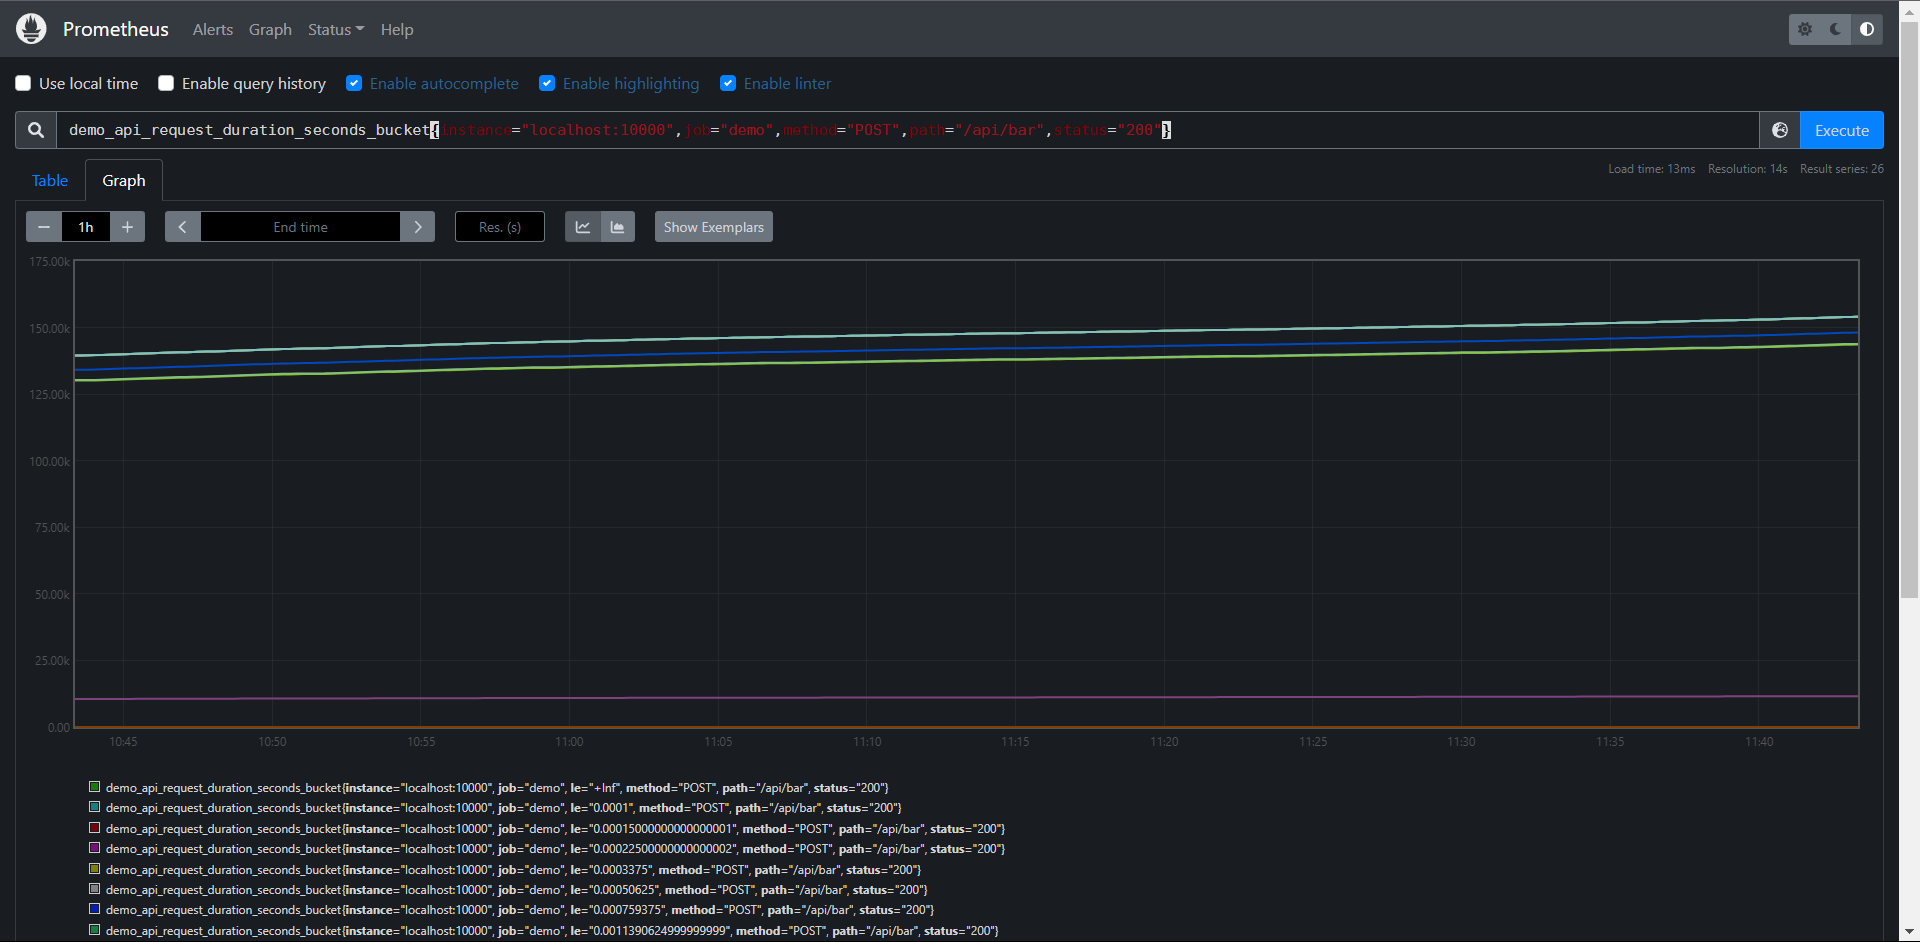
正常情况我们应该可以看到26个序列,每个序列代表一个bucket,由le标签标识:

直方图可以帮助我们了解这样的问题,比如:"我有多个请求超时了100ms的时间",(当然需要直方图中配置了一个以100ms为边界的桶),又比如:"我99%的请求是在多少延迟下完成的?",这类数值被称为百分位数或分位数。在Prometheus中这两个术语几乎是可以通用的,只是百分位数指定在0-100内,而分位数表示在0和1之间,所以第99个百分位数相当于目标分位数0.99.

如果你的直方图桶粒度足够小,那么我们可以使用histogram_quantile(a scalar, b instant-vector)函数用于计算历史数据指标一段时间内的分位数,该函数将目标分位数(0 <= a <= 1)和直方图指标作为输入,就和大家平时讲的pxx,p50就是中位数,参数b一定是包含le这个标签的瞬时向量,不包含就无法计算分位数了,但是计算的分位数是一个预估值,并不完全准确,因为这个函数是假定每个区间内的样本分布来计算结果值得,预估得=准确度取决于bucket区间划分得粒度,粒度越大,准确度越低。

回到我们演示得服务,我们可以尝试计算所有维度在所有时间内得第90个百分位,也就是90%得请求持续时间:

PromQL:histogram_quantile(0.9, demo_api_request_duration_seconds_bucket{job="demo"})
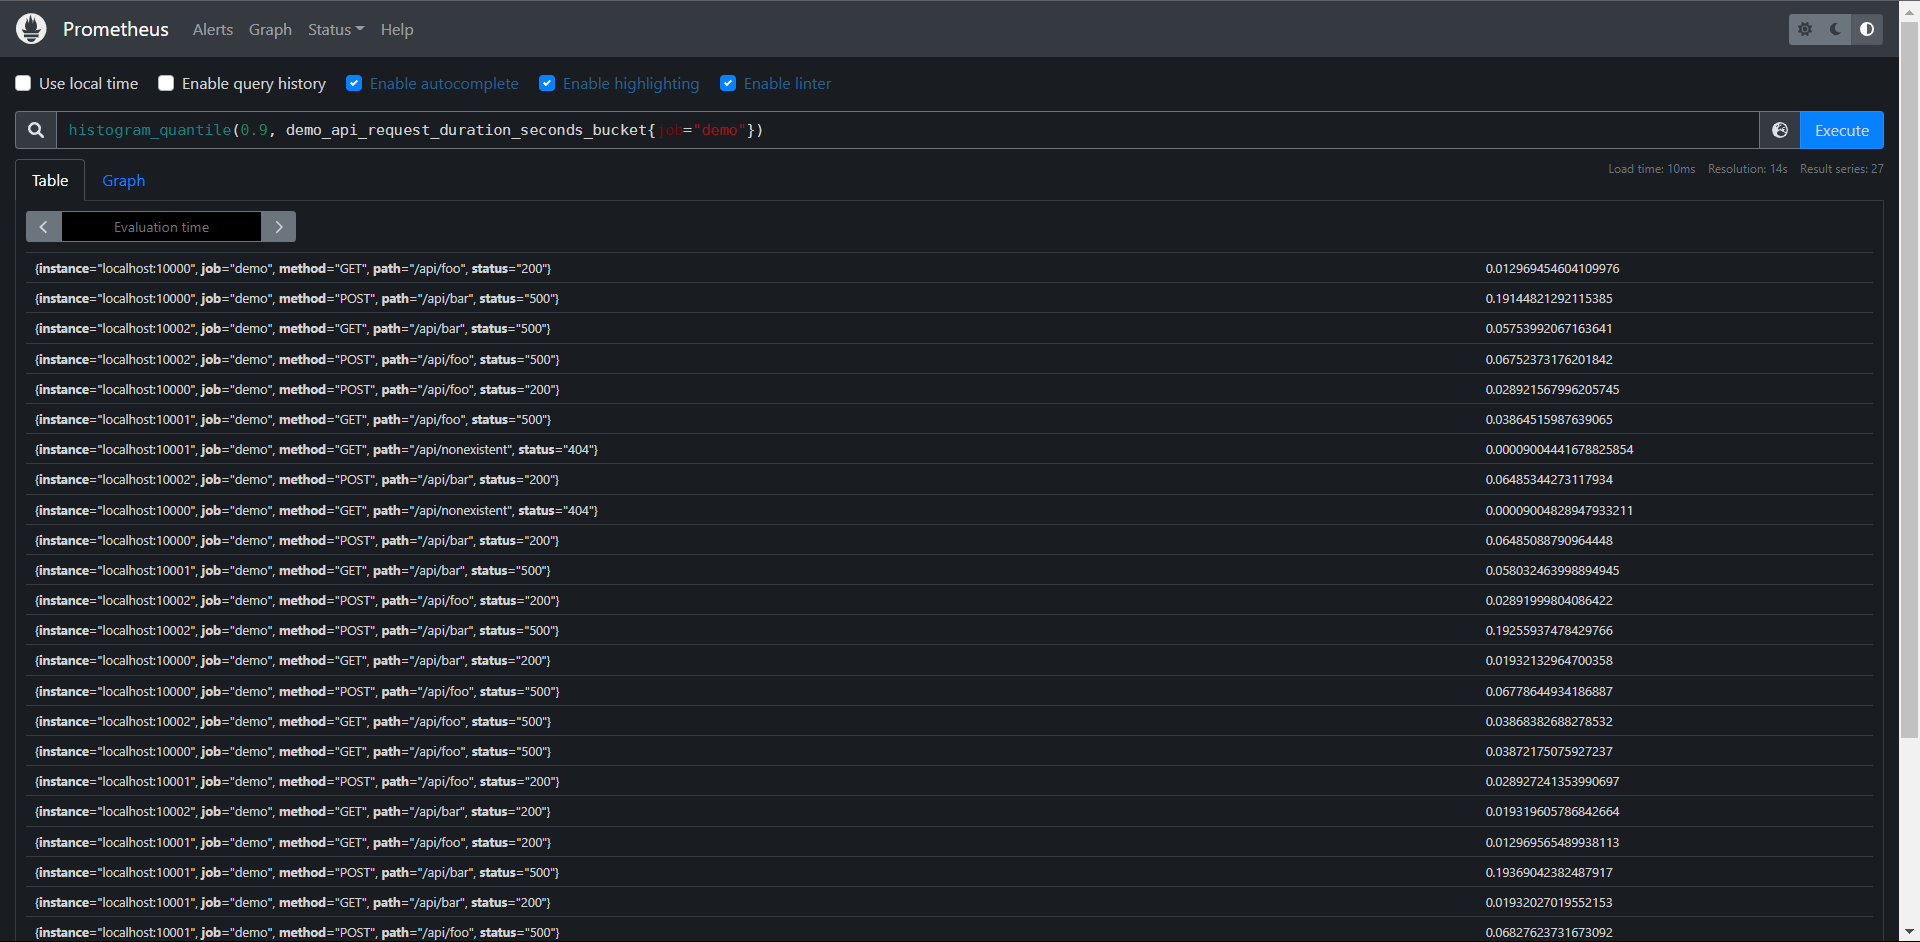
但是这个查询有点问题,当单个服务实例重启时,bucket的我Counter计数器会被重置,而且我们常常想看看现在延迟多少(比如在过去5分钟内),而不是整个时间内得指标,我们可以用rate()函数应用于的底层直方图计时器来实现这一点,该函数会自动处理Counter重置,又可以只计算每个桶在指定时间窗口内的平均增长。
我们可以这样去计算过去5分钟内第90个百分位的API的延迟:
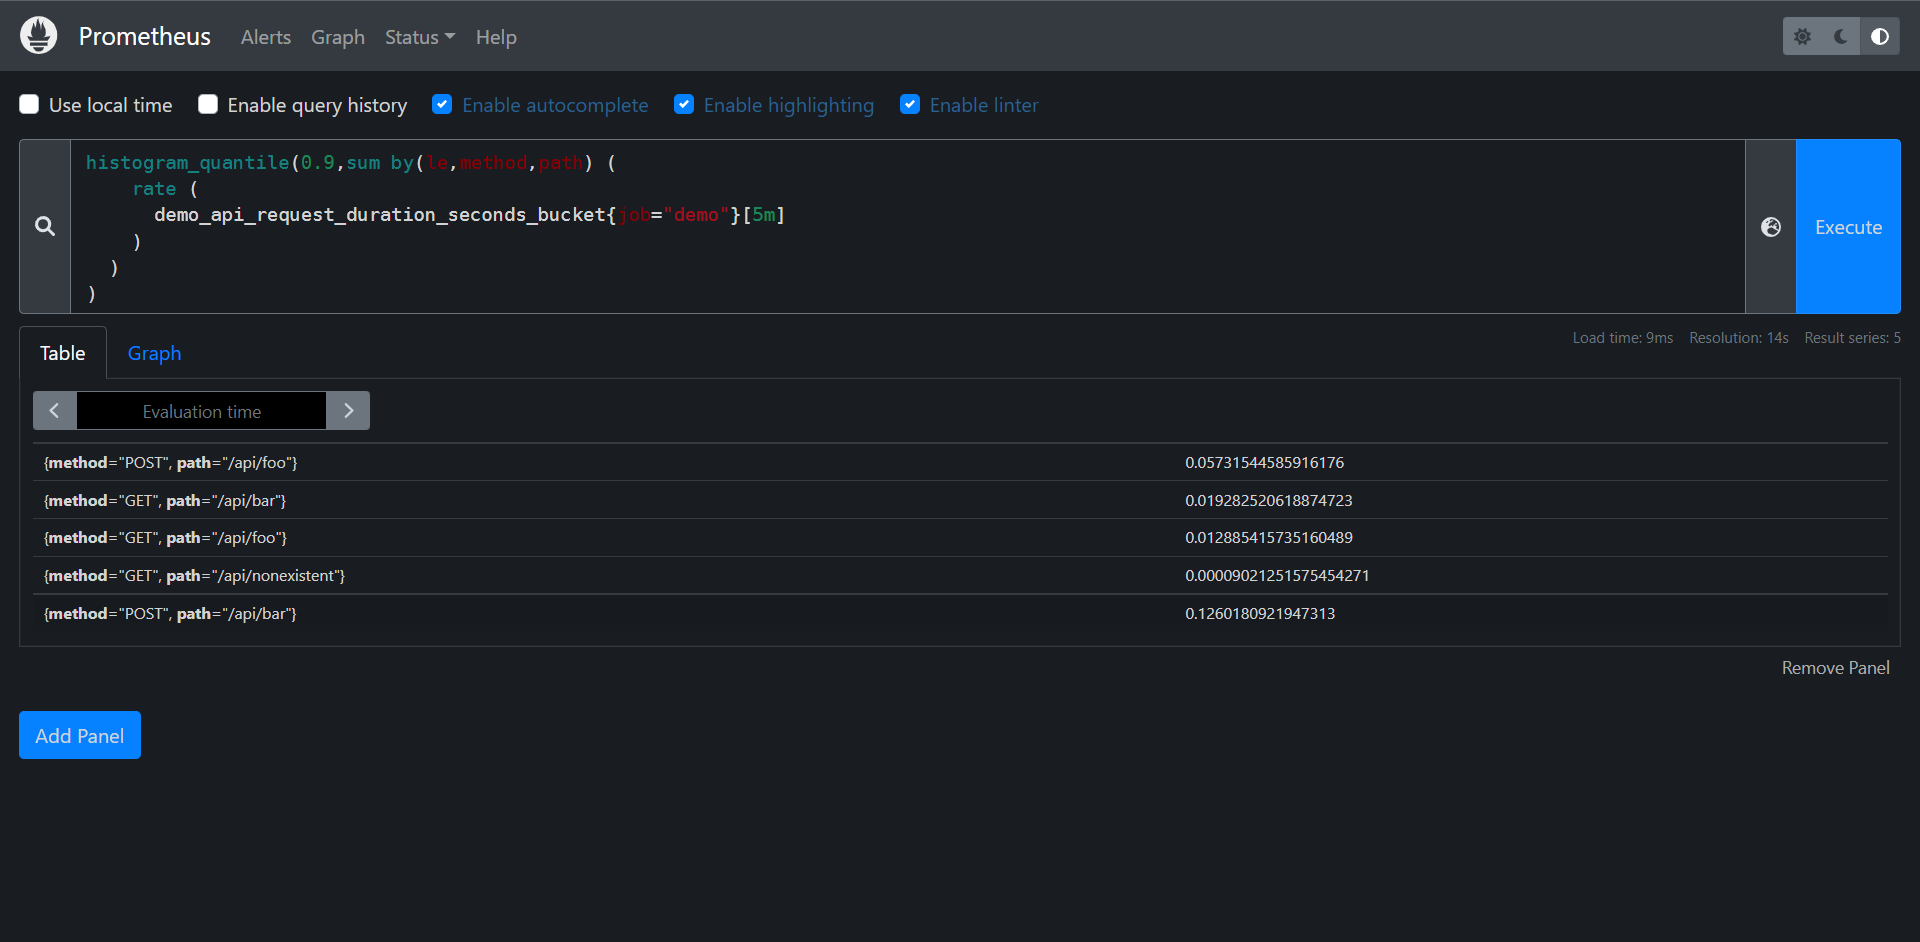
PromQL:histogram_quantile(0.9, rate(demo_api_request_duration_seconds_bucket{job="demo"}[5m]))
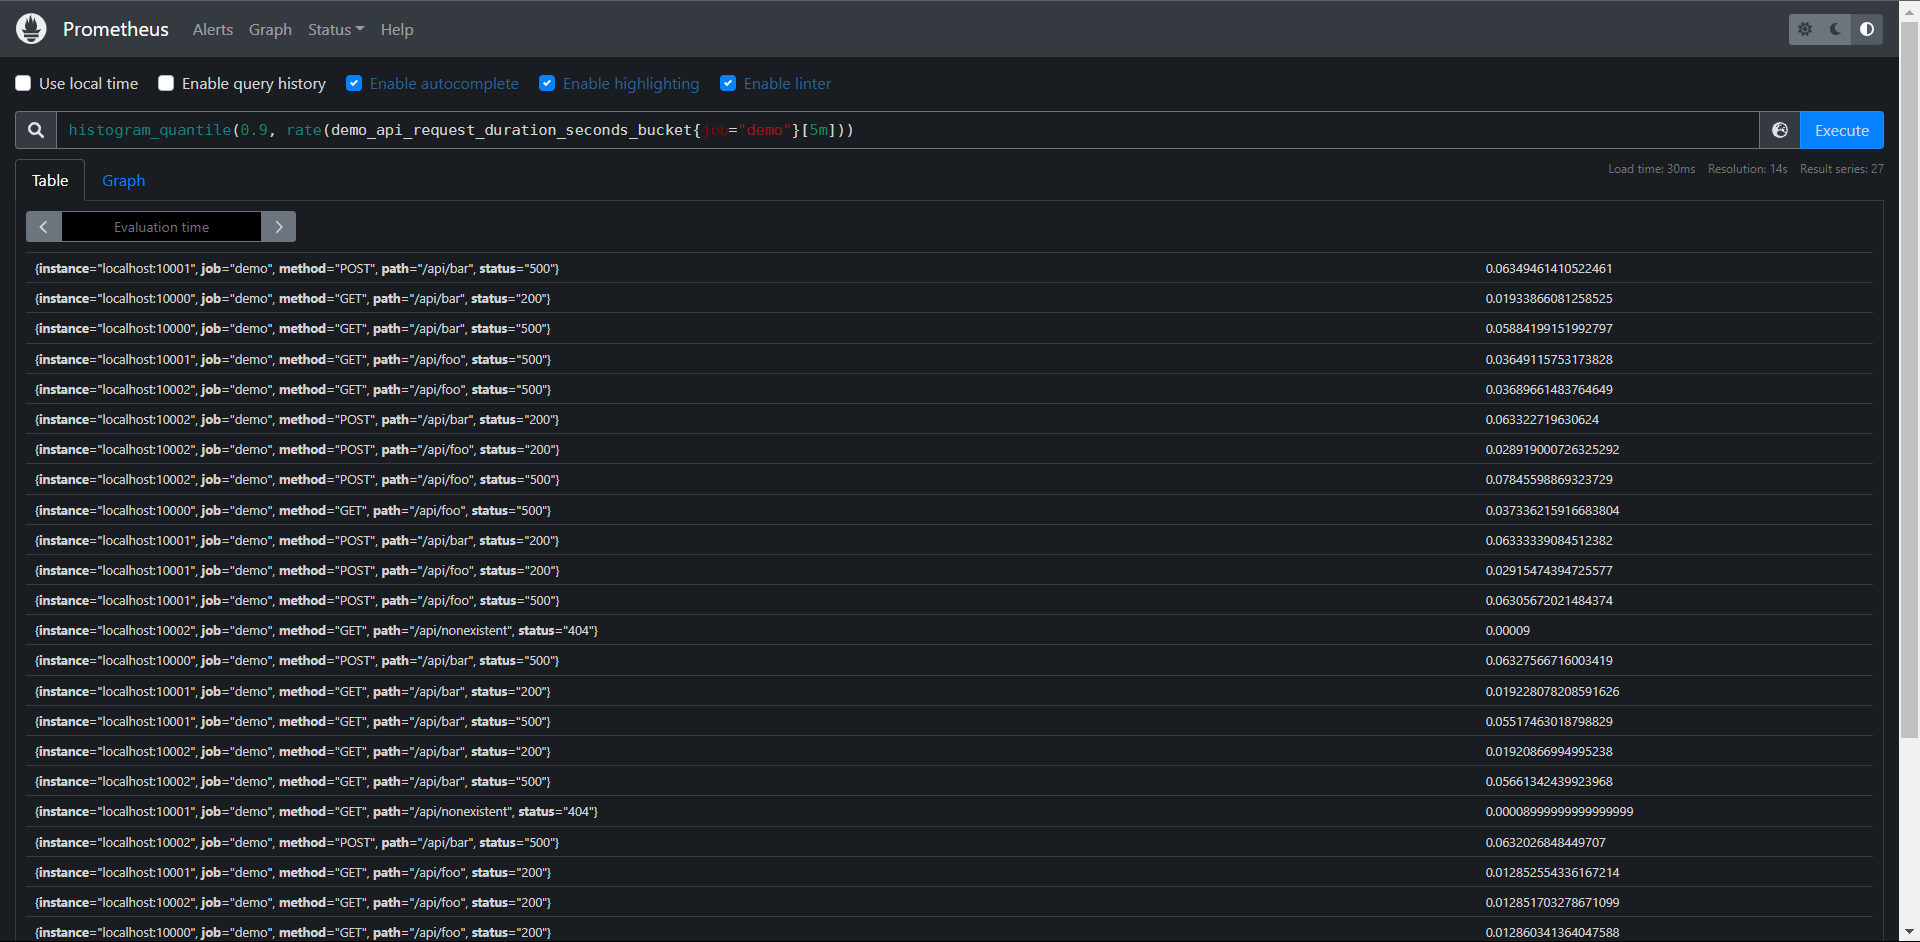
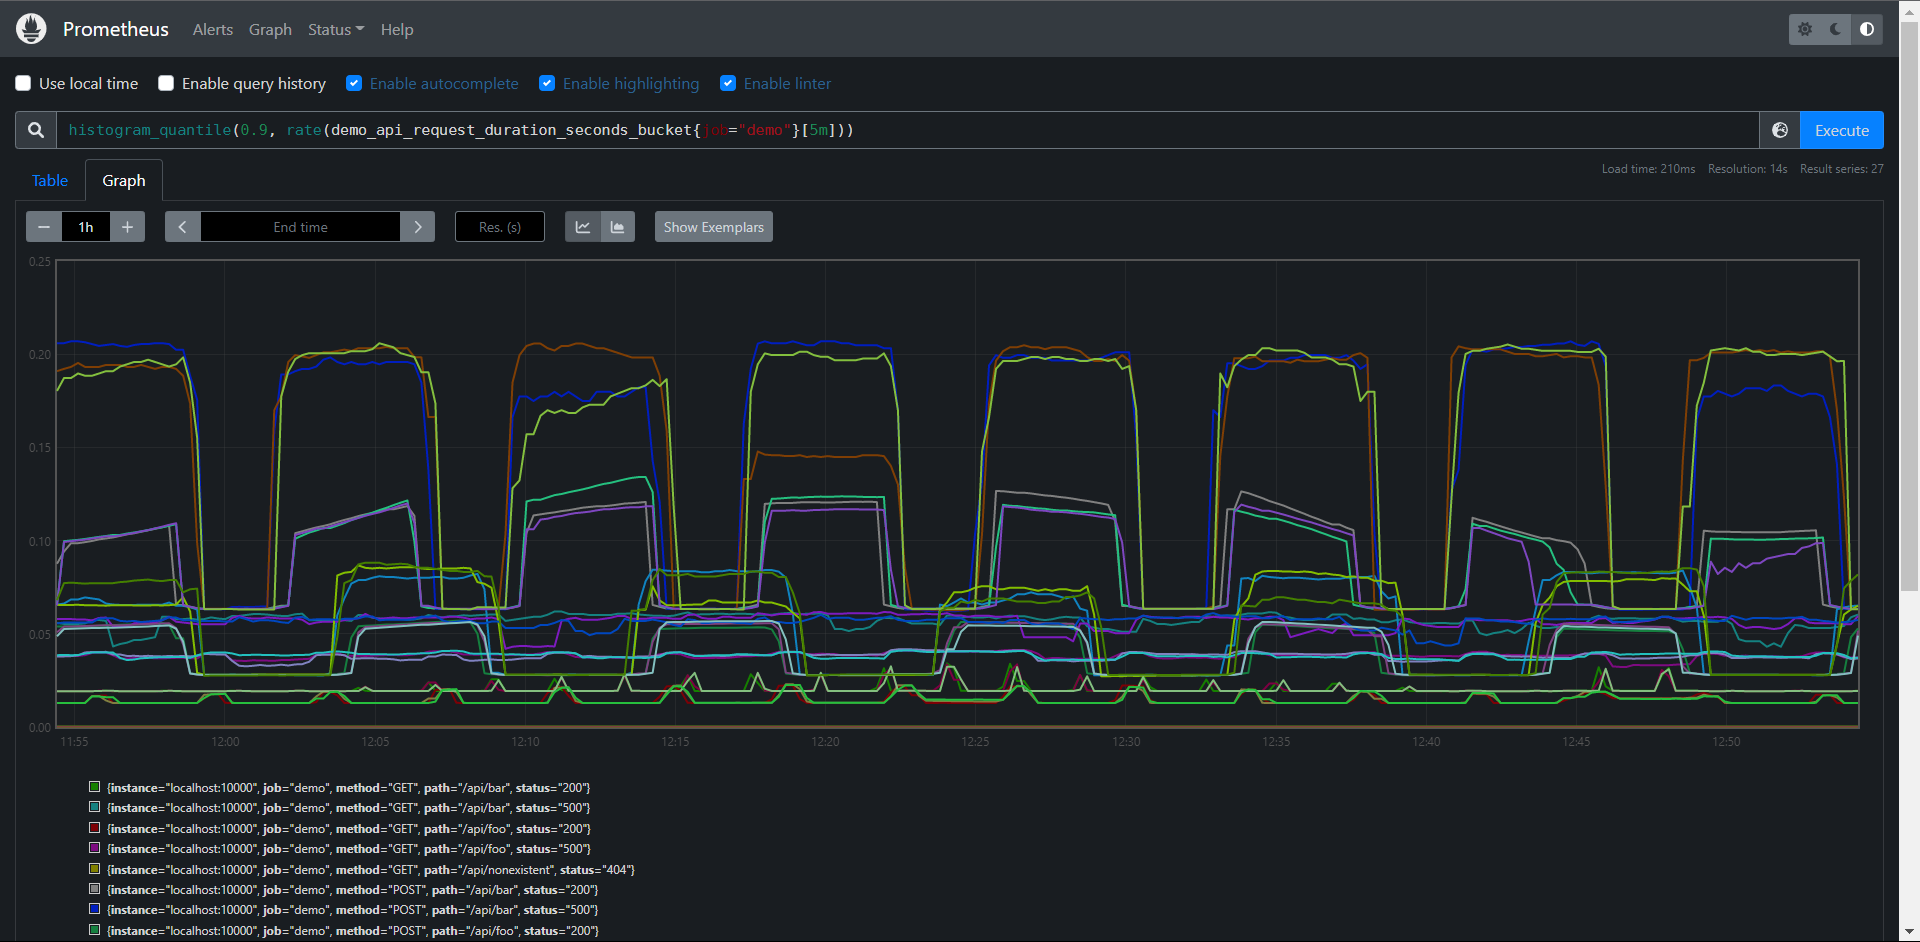
这样查询就好多了
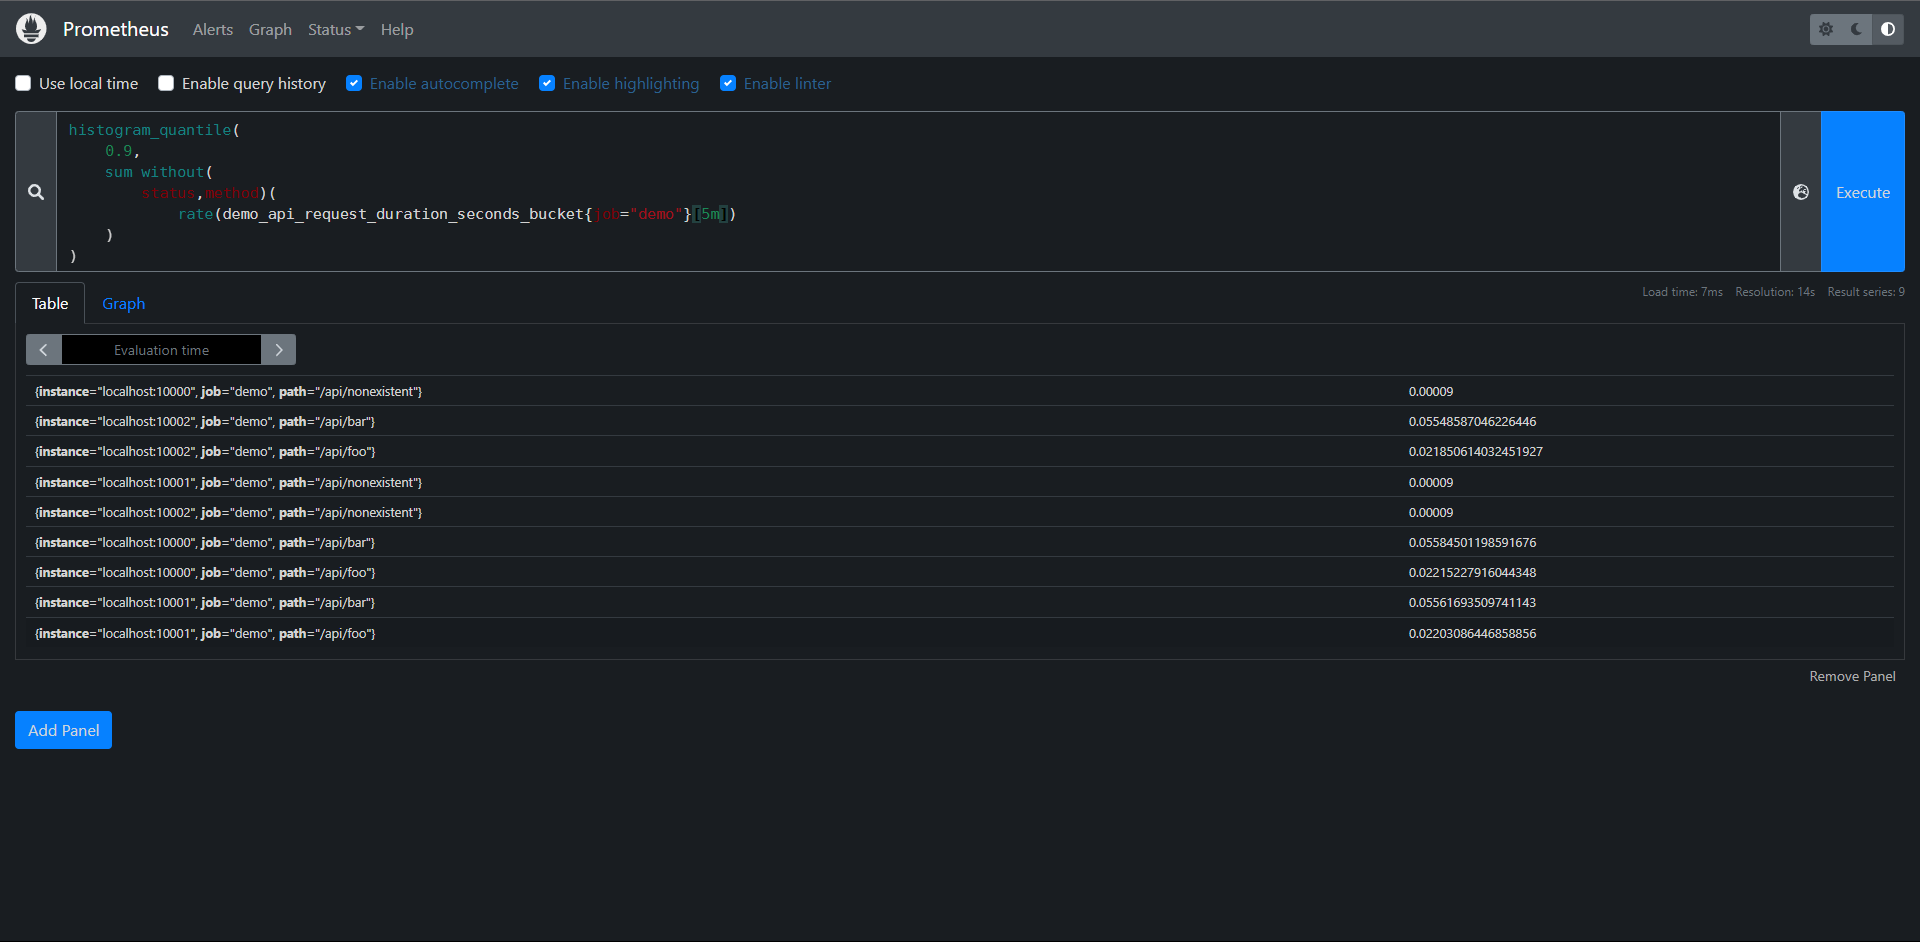
这个查询会显示每个维度(job,instance,path,method和status)的第90个百分点,但是我们可能对单独的这些维度不感兴趣,想把它们其中一些指标聚合起来,这个时候我们可以在使用Prometheus的sum运算符sum运算符与histogram_quantile()函数结合起来,计算出聚合的百分位,假设我们想要聚合的维度之间,直方图桶的配置方式相同(痛的数量,上限相同),我们可以将不同维度之间具有相同le标签值的桶加在一起,得到一个聚合直方图,然后我们可以使用该聚合直方图作为histogram_quantile()函数的输入:
注意:这是假设直方图的桶在你要聚合的所有维度之间的配置是相同的,桶的配置也应该是相对静态的配置的,不会一直变化,因为会破坏你使用histogram_quantile()查看的时间范围内的结果。
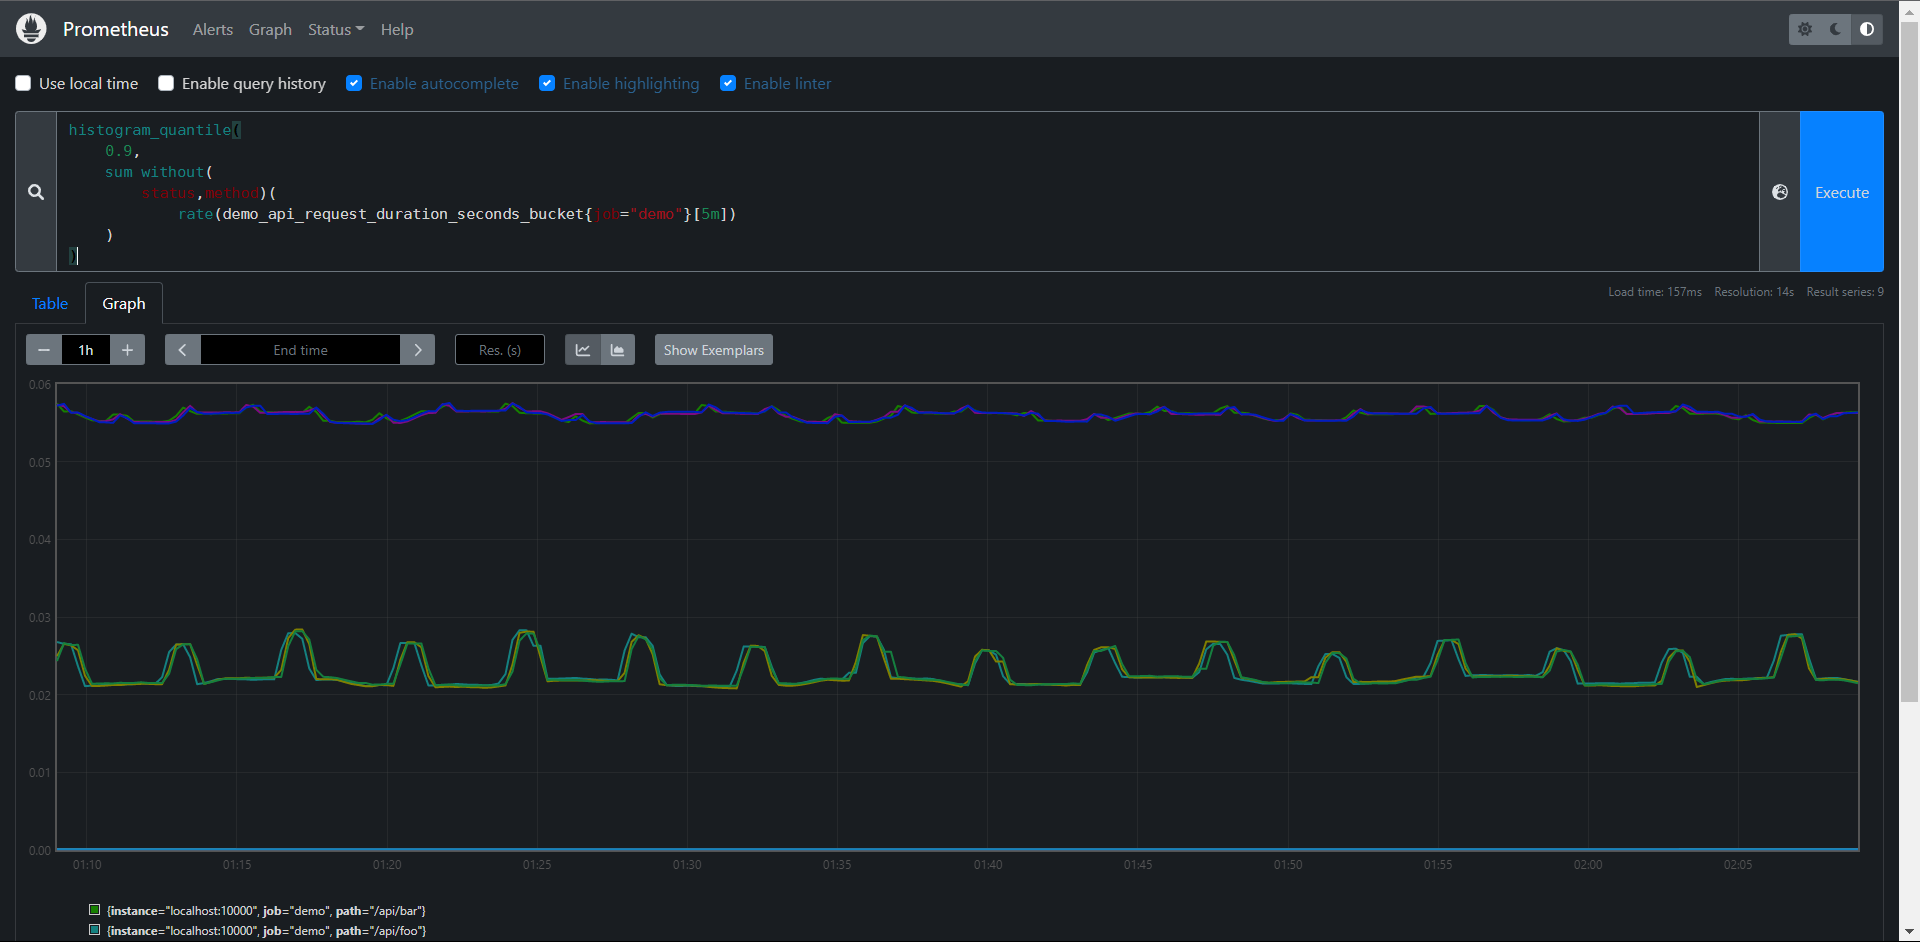
下面查询计算第90个百分位的延迟,但按job,instance和path维度进行聚合:
PromQL:
histogram_quantile(
0.9,
sum without(
status,method)(
rate(demo_api_request_duration_seconds_bucket{job="demo"}[5m])
)
)
练习:
1:构建一个查询,计算在0.0001秒内全程的demo服务API请求的百分比,与过去5分钟内所有请求总数值的平均值
PromQL1:
sum(
    rate(demo_api_request_duration_seconds_bucket{le="0.0001"}[5m])
) /
sum(
    rate(demo_api_request_duration_seconds_bucket{le="+Inf"}[5m])
) * 100
PromQL2:
sum(
    rate(demo_api_request_duration_seconds_bucket{le="0.0001"}[5m])
) /
sum(
    rate(demo_api_request_duration_seconds_count[5m])
) * 100

2:构建一个查询,计算demo服务API请求的第50个百分位延迟,按status code和method进行划分,在过去一分钟的平均值
PromQL:
histogram_quantile(
    0.5,
    sum by(status,method,le)(
        rate(demo_api_request_duration_seconds_bucket[1m])
    )
)
11.12:检测
接下来我们来学习如何检测我们实例数据抓取健康情况
11.12.1:检查抓取实例
当每个Prometheus抓取一个目标时,它都会存储一个合成的样本,其中包含指标名称up和被抓去实例的job和instance标签,如果抓取成功,则样本的值被设置为1,如果抓取失败,则设置为0,所以我们可以通过如下所示的查询来获取当前哪儿些实例处于正常或者异常状态

PromQL:up{job="demo"}
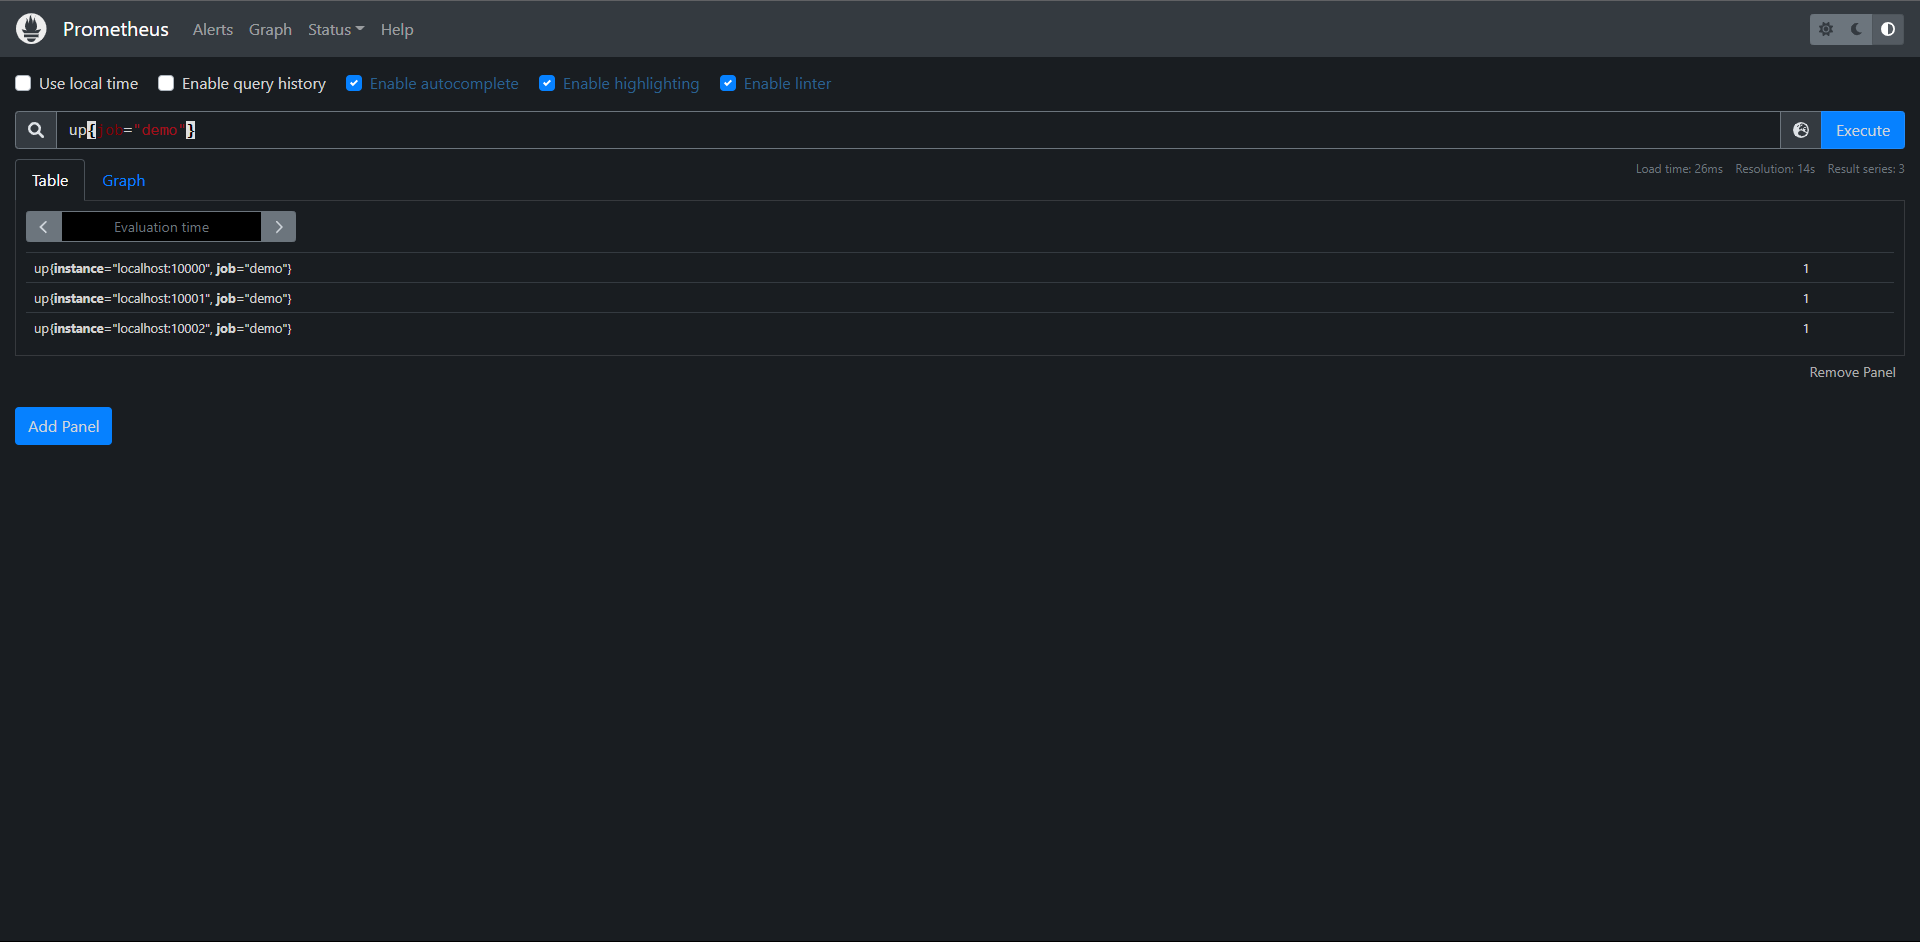
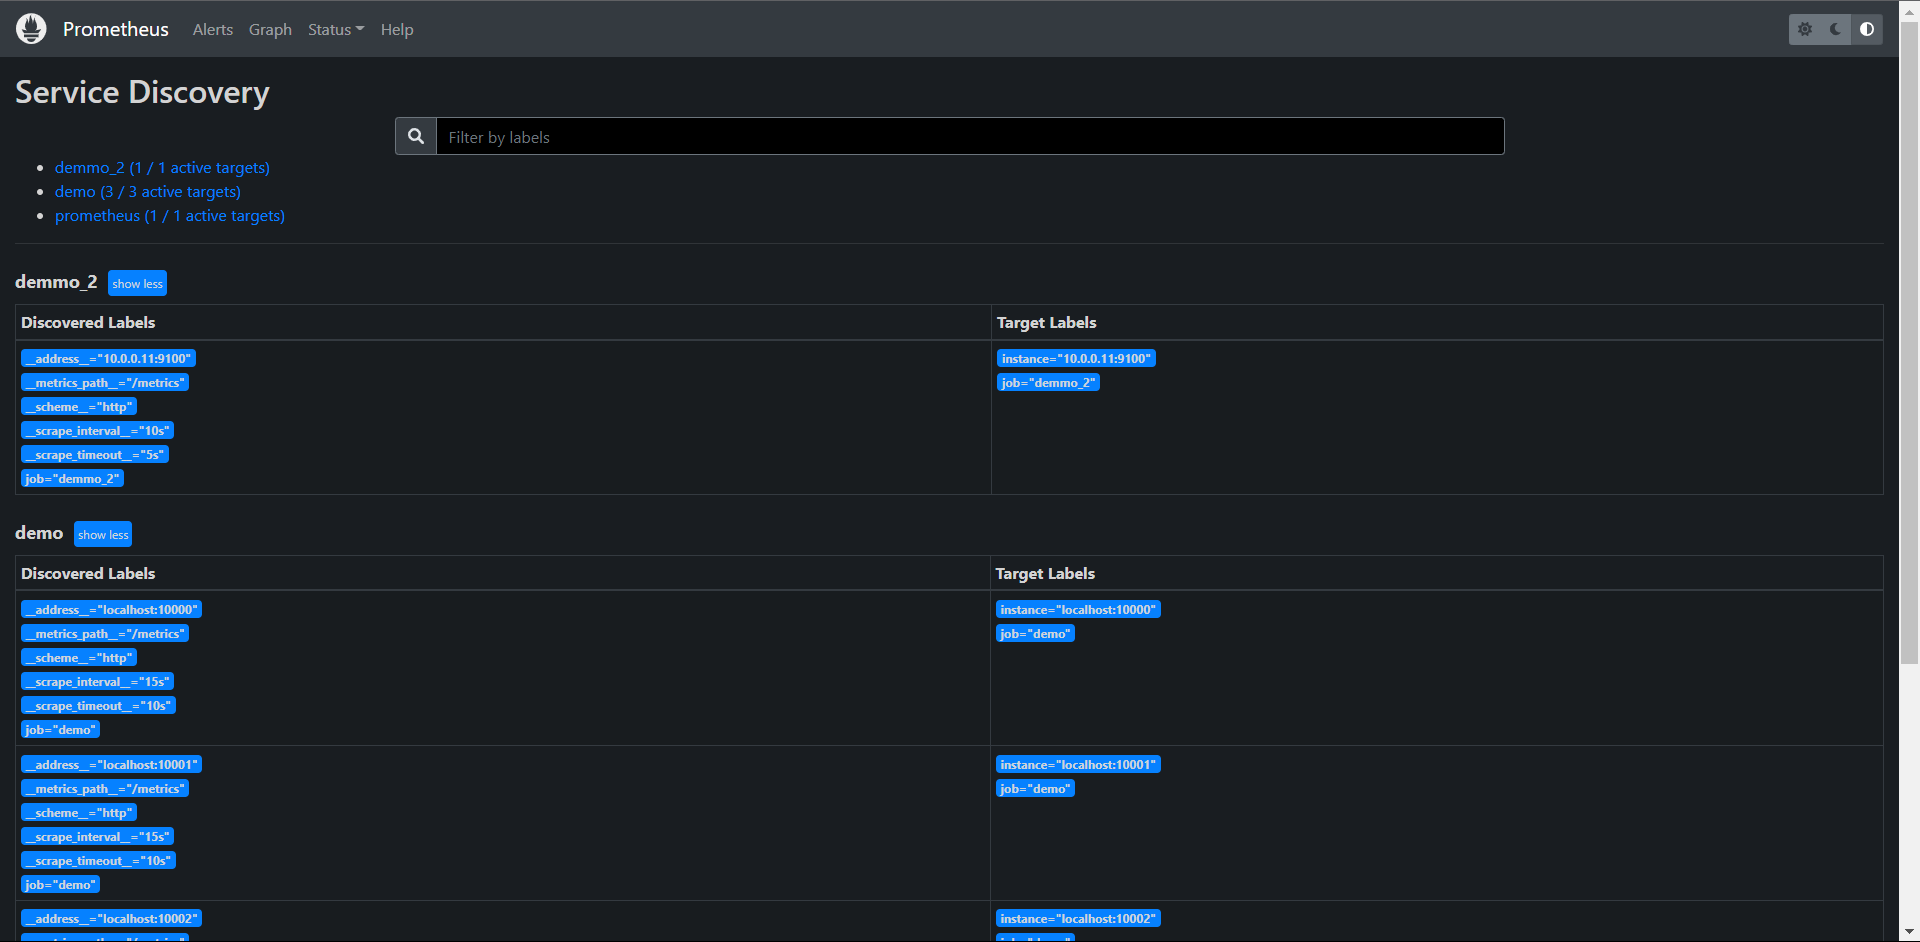
因为我们启动了三个job名为demo的实例,所以检测到了三个,因为目前三个都正常,所以值都为1,我们去给Prometheus配置一个不存在的数据源
---
  - job_name: "demmo_2"
    scrape_interval: 10s
    scrape_timeout: 5s
    static_configs:
      - targets: ["10.0.0.11:9100"]
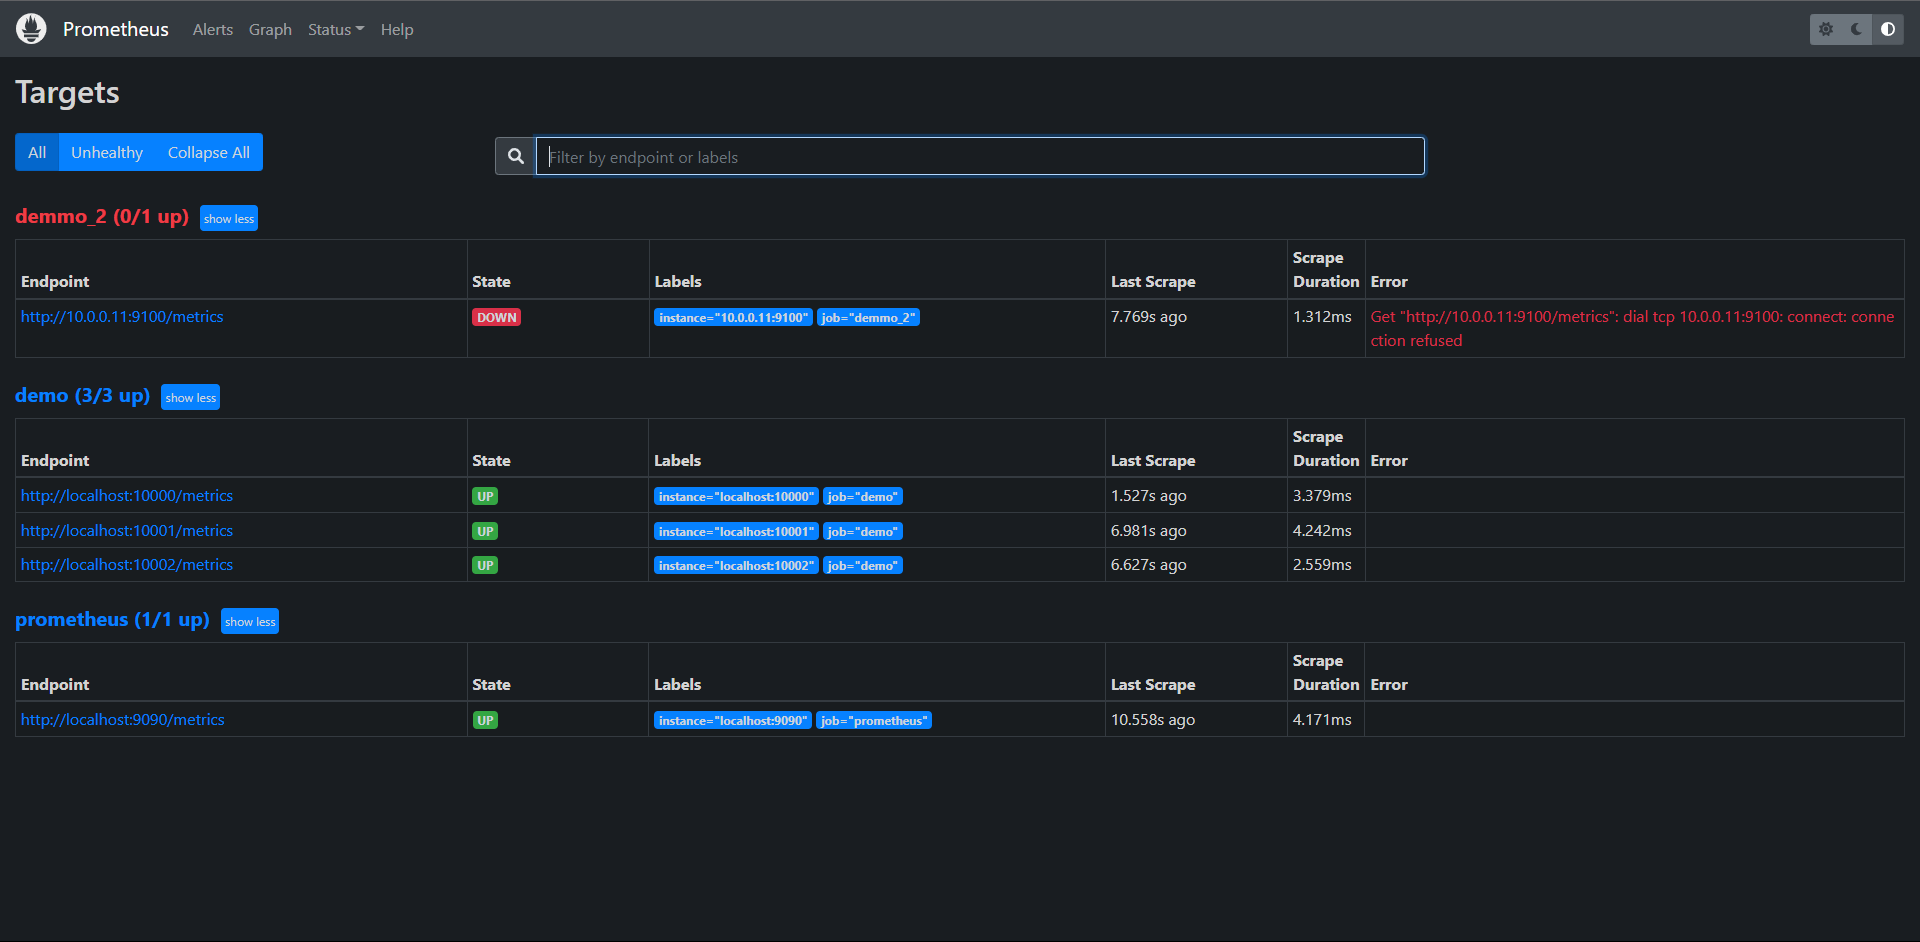
再来查一下

PromQL:up{job="demmo_2"}
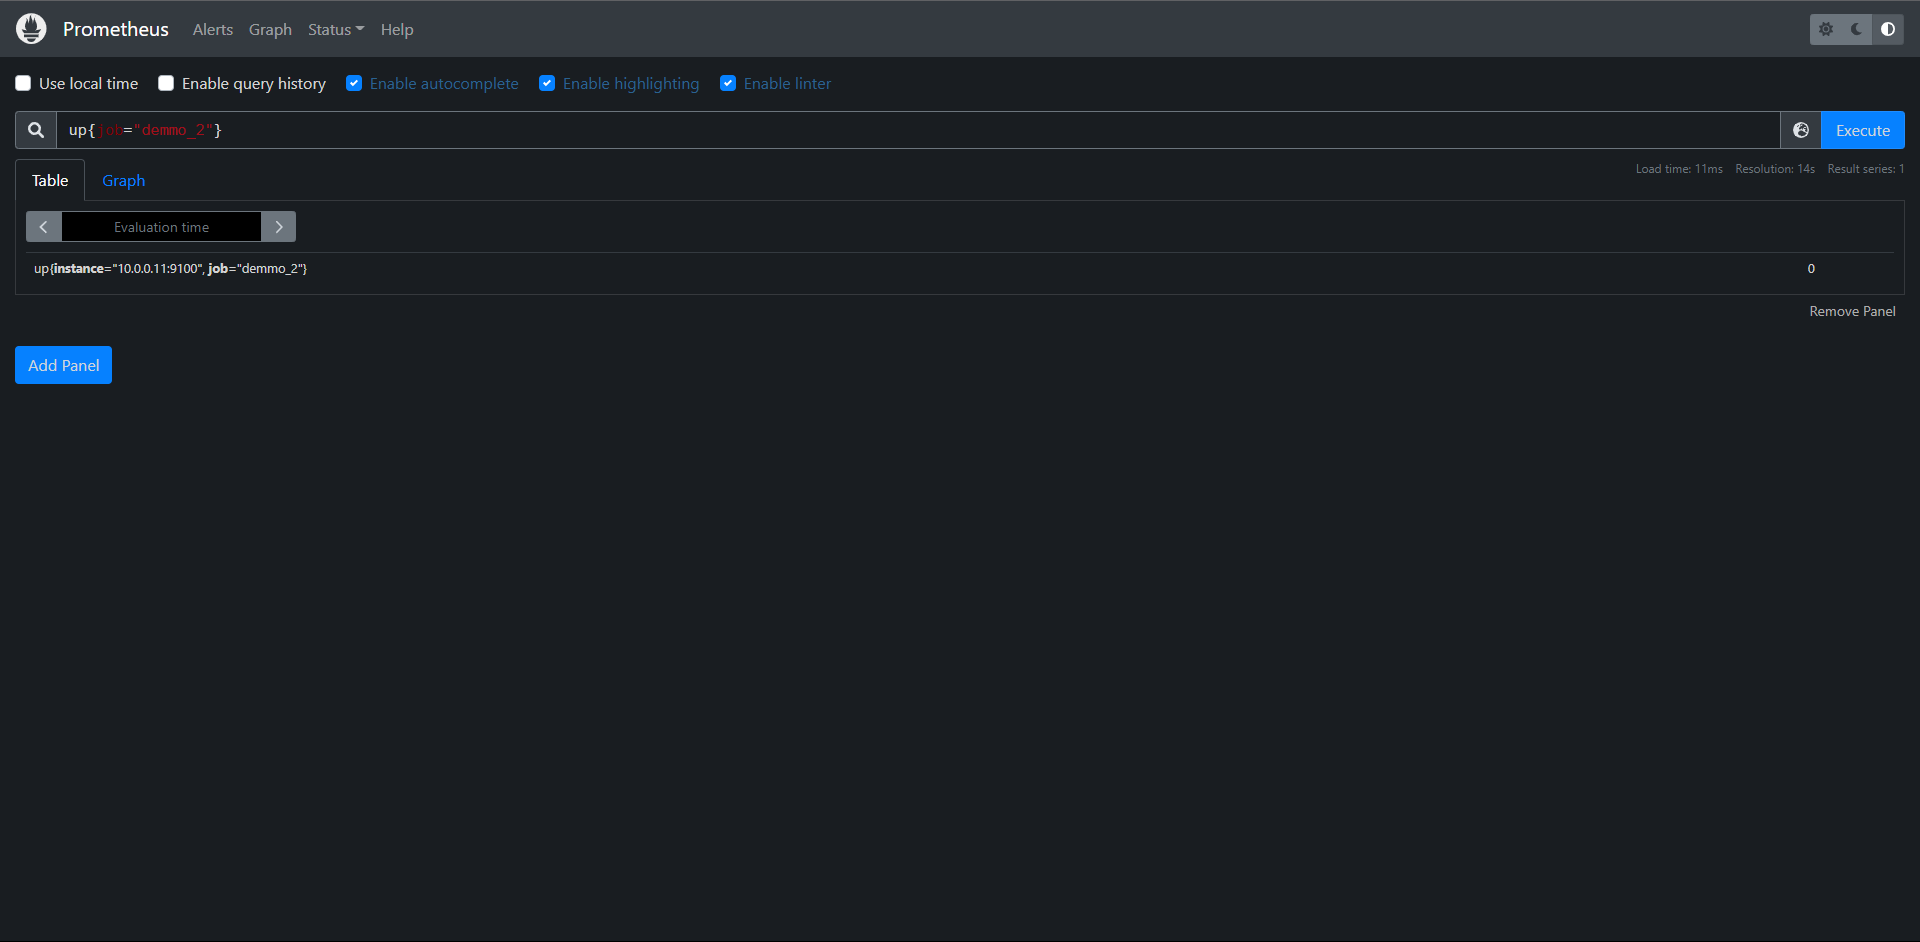
发现为0了,证明数据没有抓到了
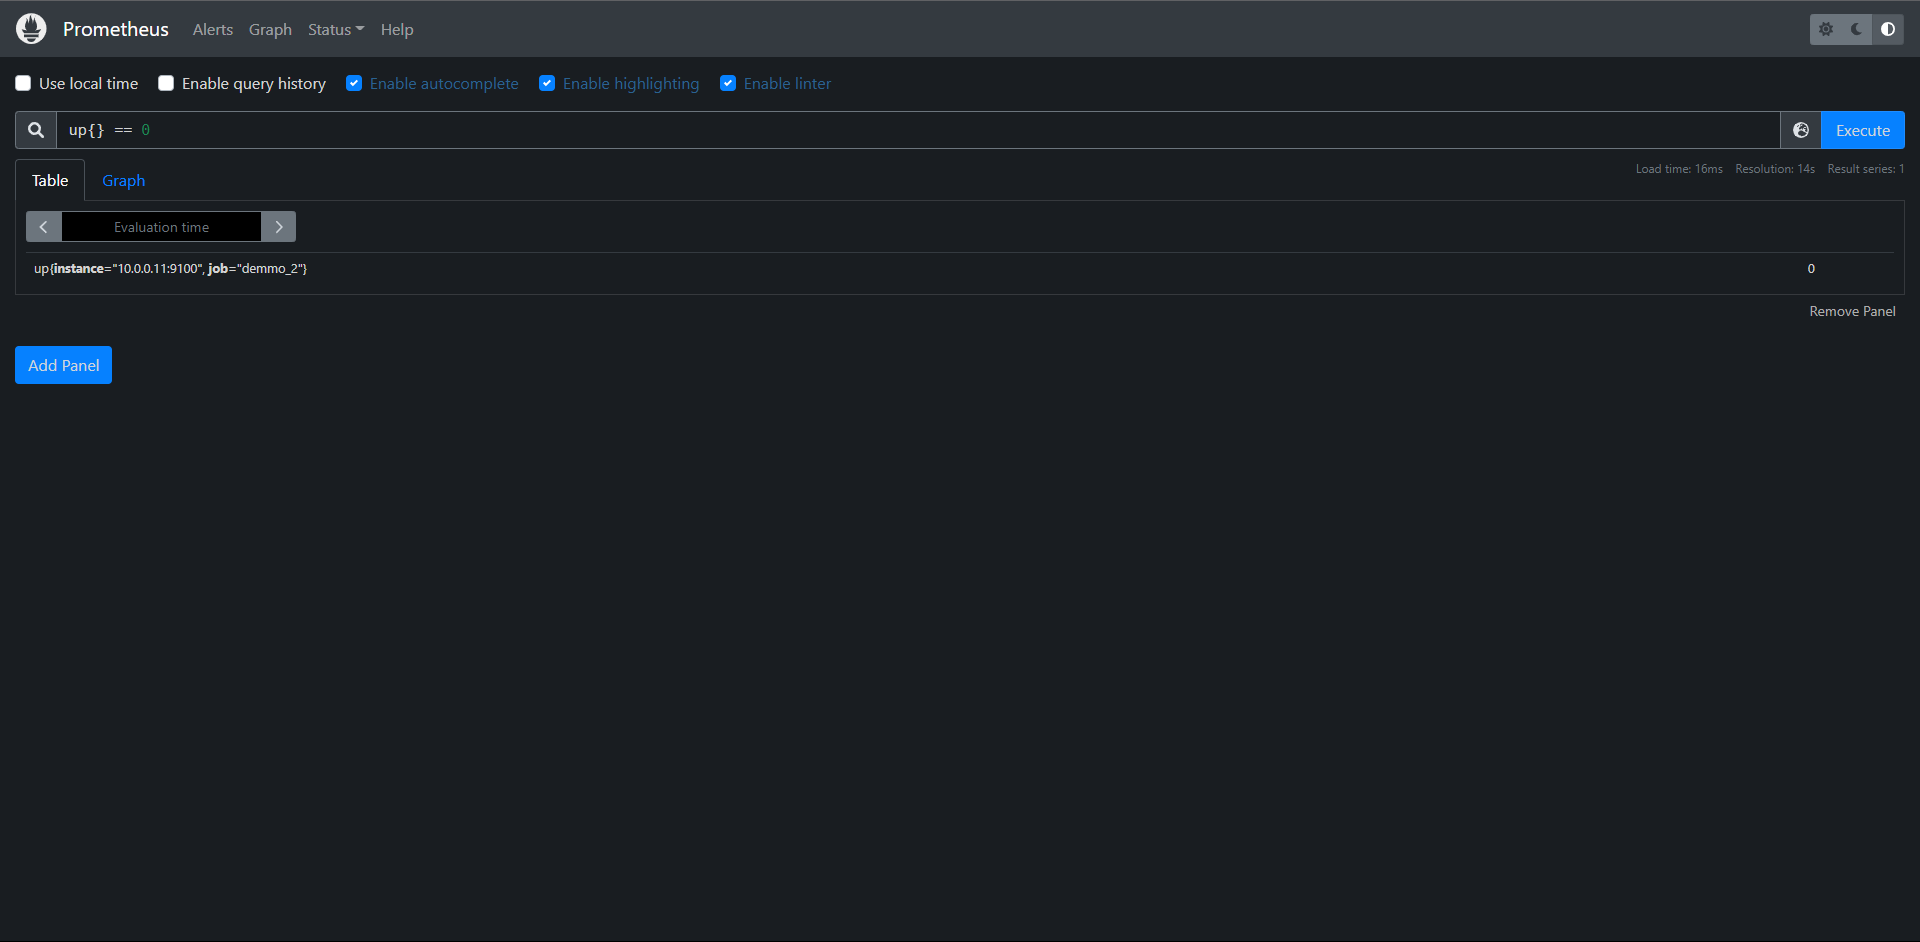
当然从所有数据源过滤结果为0的也是可以的:
PromQL:up{} == 0
Count计算:

PromQL:count by(job)(up{job="demo"} == 1 )

这种情况适用于指标抓取健康状态报警

# 注意:因为count()是一个聚合运算符,它期望有一组维度的时间序列作为其输入,并且可以根据by 或 without 子句将输出进行分组,任何输出组只能基于现有的输入序列,如果根本没有输入序列,就不会产生输出!
11.12.2:检查序列输出
在某些情况下,只查看序列的样本值是不够的,有时还需要检测是否在某些序列,上面我们用了up{} == 1 语句来查询所有可以抓取到数据的演示服务实例,但是也只有呗抓到的目标才会被加上up指标,如果Prometheus都没有抓取到任何的演示服务目标该怎么办呢?比如配置出问题了,服务发现返回为空,或者由于Prometheus自身出了某些问题。

在这种情况下,absent()函数就非常有用了,absent()将一个瞬时向量作为其输入,当输入包含序列时,将返回一个空结果,不包含时将返回单个输出序列,而且样本值为1

例如:查询语句PromQL:absent(up{job="demo"}) 将得到一个空的输出结果,如果测试一个没有被抓取得job是否存在时:
PromQL:absent(up{job="Test"})
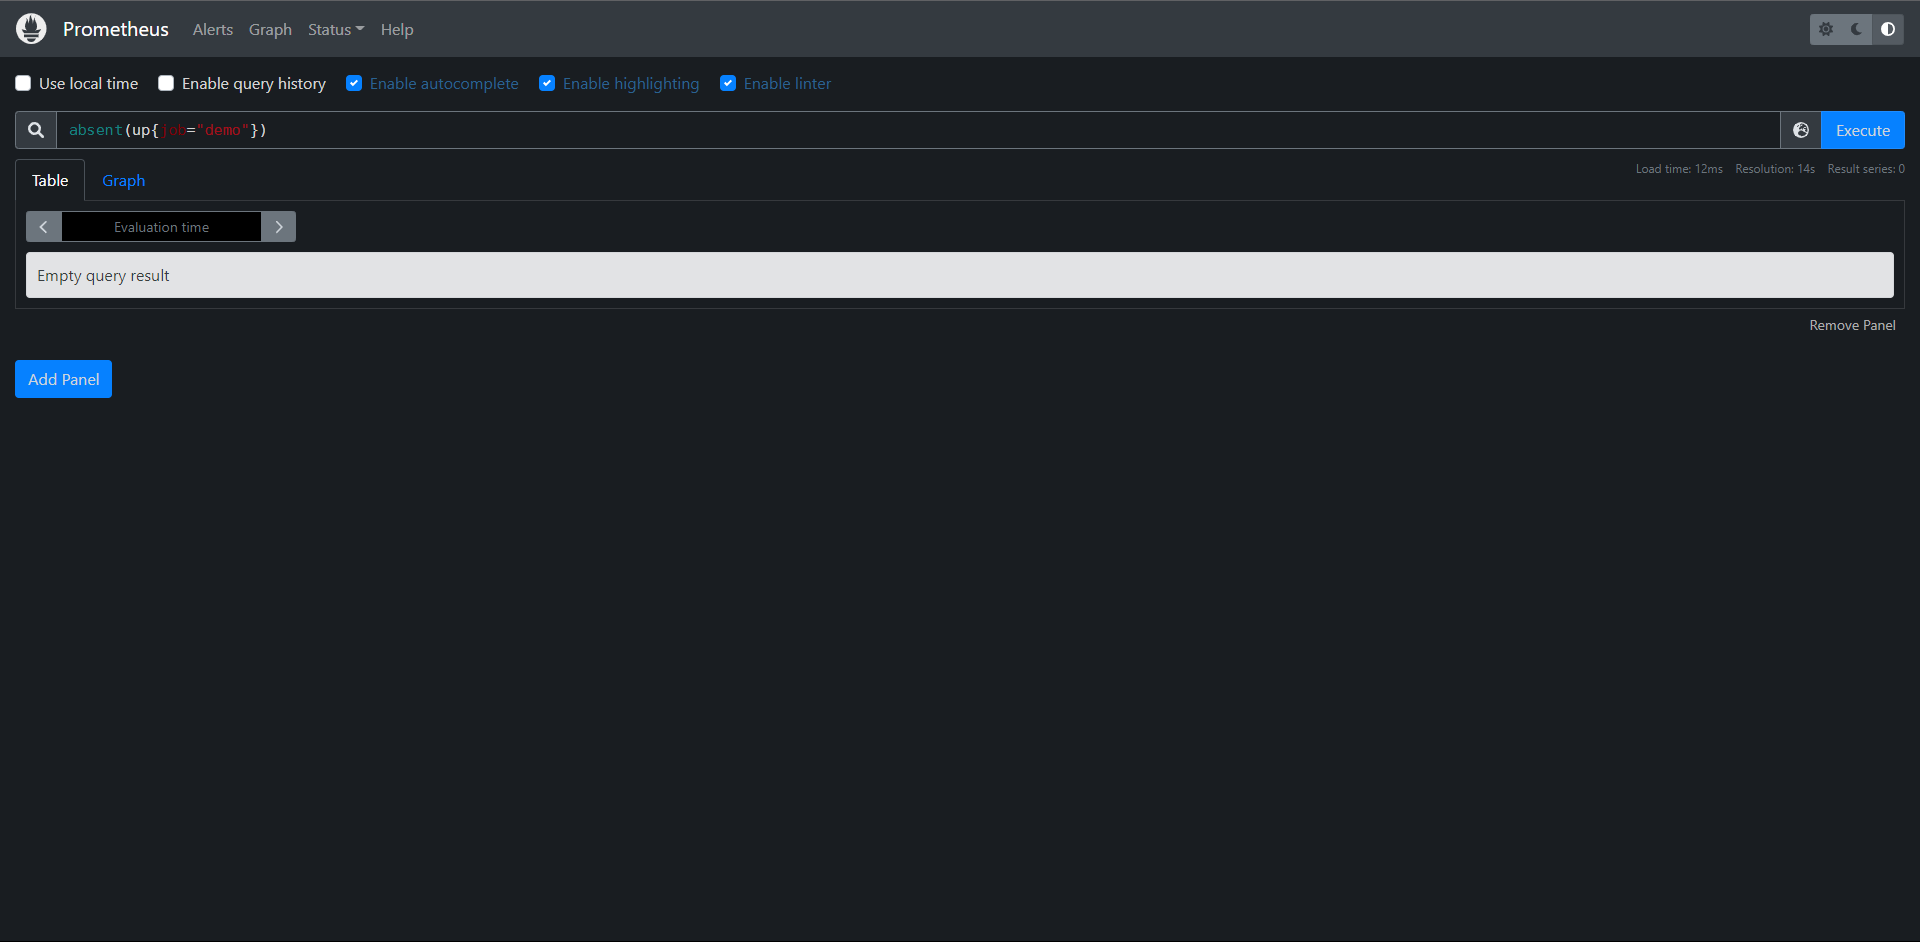
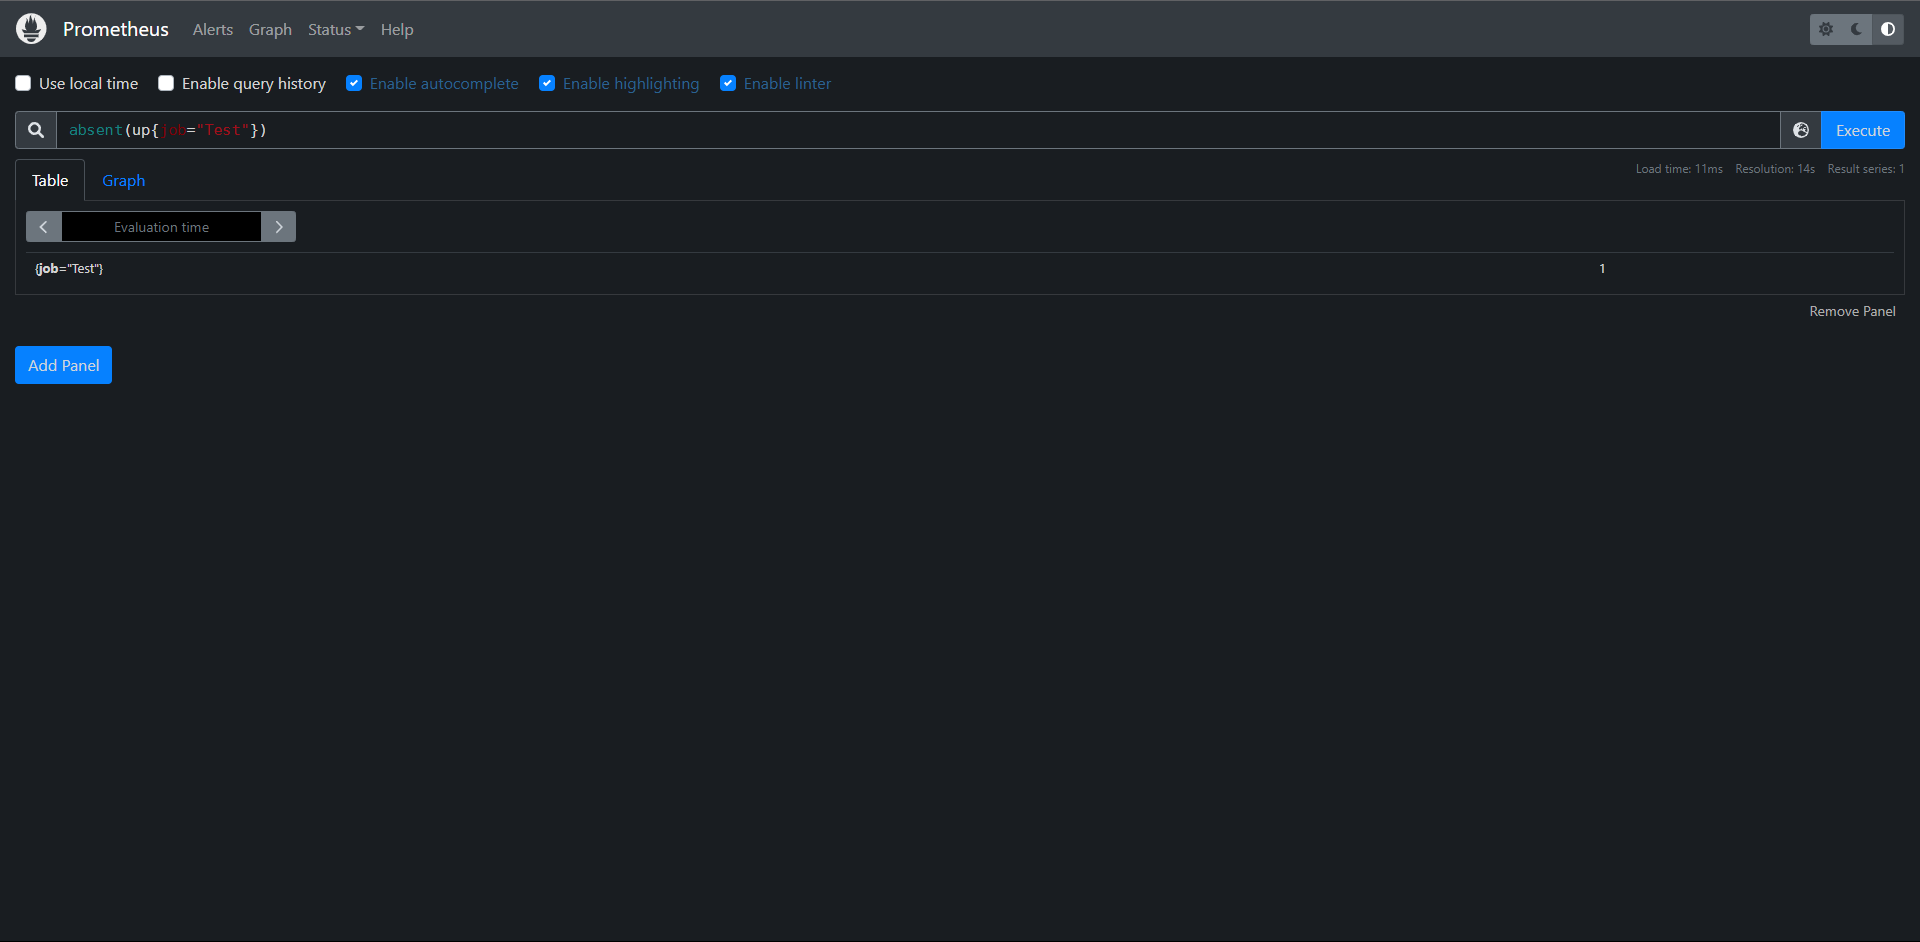
不存在得话则样本值为1

这可以帮助我们检测序列是否存在得情况,此外还有一个absent()得变种,叫做absent_over_time(),它接收一个区间向量,告诉你该输入区间向量范围内是否有样本


练习:

1:构建一个查询,检测指标demo_api_request_duration_seconds_count是否具有PUT得method标签序列。
PromQL:absent(demo_api_request_duration_seconds_count{method="PUT"})
2:构建一个查询,当过去一小时内任务non-existent没有记录up指标时,该查询输出一个序列
PromQL:absent_over_time(up{job="non-existent"}[1h])
12:服务发现
12.1:Relabeling重新标记
Relabeling重新标记用于配置Prometheus元信息得方式,它是转换和过滤Prometheus中Label标签对象得核心,接下来我们学习Relabeling规则得工作原理,并能将它适用于不同得场景中。
12.1.1:概述
Prometheus发现,抓取和处理不同类型得Lebal标签对象,根据标签值操作或过滤这些对象非常有用,比如:
1:只监视具有特定服务发现注解的某些服务,通常在服务发现中使用
2:向目标抓取请求添加HTTP查询参数
3:仅存储从制定目标中提取出样本的子集
4:将抓取序列的两个标签值合并为一个标签

此操作配置在 yaml配置中
地址:https://prometheus.io/docs/prometheus/latest/configuration/configuration/

Relabeling是作为一系列转换步骤实现的,我们可以在Prometheus配置文件中应用这些步骤来过滤或修改标记对象,我们可以针对以下类型应用Relabeling操作:

1:发现的抓取目标 (relabel_configs)
2:抓取的单个样本 (metric_relabel_configs)
3:发送给Alertmanager的报警 (alert_relabel_configs)
4:写到远程存储的样本 (write_relabel_configs)

平时在配置监控目标的时候我们更多的会使用 relabel_configs与metric_relabel_configs两个配置,采集数据之前,通过relabel_configs,采集数据之后,写入存储之前,通过metric_relabel_configs进行配置。
所有的这些 relabeling配置块都是相同类型的relabel_config,每个配置块都由一个规则列表组成,这些规则一次应用于每个标记的对象。


例如:一个relabeling规则可以根据正则表达式来匹配保留或丢弃一个对象,可以修改其标签,也可以将一整组标签映射到另一个组,一旦一个relabeling步骤决定放弃一个有标签的对象,就不会对这个对象执行进一步的relabeling步骤,它将从输出列表中删除。
12.1.2:隐藏的标签与数据
双下划线__开头的标签属于特殊标签,它们在重新标记后会被删除,标记对象的来源最初可以附加这些隐藏标签,以提供关于标记对象的额外元数据,这些特殊的标签可以在relabeling阶段被用来对对象的标签进行修改。

对于抓取指标,其中包含一些隐藏的标签。可以用来控制目标如何被抓取。

1:__address__:包含应该被抓取目标的地址,它最初默认为服务发现机制提供的<host>:<port>,如果在此之前没有明确的将实例标签instance设置为其他值,那么在relabeling之后,Prometheus会将instance标签设置为__address__的值。
2:__scheme__:抓取目标的请求格式,包括http和https,默认为http
3:__metrics_path__:表示用于采集指标的http路径,默认为/metrics。
4:__param_<name>:包含HTTP查询参数名称和它的值。

地址在:http://prometheus—server/service-discovery?search=
可以在这里查看标签的映射关系

上面的这些标签都可以使用relabeling规则来设置或覆盖,这样就可以为抓取目标进行自定义抓取行为。
此外,服务发现机制也可以提供一组以__meta__开头的标签,包含关于目标的特定发现元数据,例如:当发现Kubernetes中的Pod时,Kubernetes服务发现引擎将为每个Pod目标提供一个__meta_kubernetes_pod_name的标签,包含被发现的Pod的名字,以及一个__meta_kubernetes_pod_ready标签,表明这个Pod属于就绪状态,关于服务发现生成的元标签可以查看官方文档:
https://prometheus.io/docs/prometheus/latest/configuration/configuration/#kubernetes_sd_config
了解更多

如果一个relabeling步骤需要将一个值保存到一个临时标签中(以便在随后的步骤中处理),那么我们可以使用__tmp标签名称前缀进行标记,以__tmp开通的标签是不会被Prometheus本身使用的。
12.2:规则
Relabeling规则主要由以下的一些配置属性组成,但是对于每种类型的操作,只使用这些字段的一个子集。
1:action:执行的relabeling动作,可选值包括(replace,keep,hashmod,labelmap,labeldrop)或者labelkeep,默认为replace。
2:separator:分隔符,一个字符串,用于在连接源标签source_labels时分隔它们,默认为;
3:source_labels:源标签,使用配置的分隔符串联的标签名称列表,并与提供的正则表达式进行匹配。
4:target_label:目标标签,当使用replace或者hashmod动作时,应该被覆盖的标签名。
5:regex:正则表达式,用于匹配串联的源标签,默认为(.*),匹配任何标签源。
6:modules:模数,串联的源标签的哈希值的模,主要用于Prometheus水平分片。
7:replacement:replacement字符串,写在目标标签上,用于替换relabeling动作,它可以参与由regex捕获的正则表达式捕获组。
12.2.1:设置或替换标签值
Relabeling的一个常见操作就是设置或覆盖一个标签的值,我们可以通过replace这个操作来完成,如果没有指定aciton,则默认是replace。

一个replace动作的规则配置方式如下

action: replace
source_labels: [<source label name list>]
separator: <source labels separator>  # 默认为";"
regex: <regular expression> # 默认为"(.*)"(匹配任何值)
replacement: <replacement string> # 默认为"$1"(使用第一个捕获作为replacement)
target_label: <target_label>

该操作是按顺序执行以下步骤:

1:使用提供的separator分割符将source_labels中的标签列表值连接起来。
2:测试regex中的正则表达式是否与上一步连接的字符串匹配,如果不匹配,就跳到下一个ralebeling规则,不替换任何东西。
3:如果正则匹配,就提取正则表达式捕获组中的值,并发replacement字符串对这些组的引用($1,$2,...)用它们的值替换
4:把经过正则表达式替换replacement字符串作为target_label标签的新增存储起来。

下面我们来简单看一看replace操作的示例。
12.2.2:设置一个固定的标签值
最简单的replace例子就是将一个标签设置为一个固定的值,比如你可以把env标签设置为production:

action: replace
replacement: production
target_label: env

这里我们并没有设置规则的大部分属性,这是因为大部分的默认值已经可以满足这里的需求了,这里会将替换的字符串production作为target_label标签env的新值存储起来,也就是将env标签的值设置为了production
12.2.3:替换抓取任务端口
另一个稍微复杂的示例是重写一个被抓取任务示例的端口,我们可以用一个固定的80端口来替换__address__标签的端口:

action: replace
source_labels: [__address__]
regex: ([^:]+)(?::\d+)  # 第一个捕获组匹配的是host 第二个匹配的是port端口
replacement: "$1:80"
target_label: __address__

这里我们要替换的源标签为__address__,然后通过正则表达式([^:]+)(?::\d+)进行匹配,这里有两个捕获组,第一个匹配的是host($1),第二个匹配的是端口($2),所以在replacement字符串中我们保留第一个捕获组的$1,然后将端口更改为80,这样就可以将__address__的实例端口更改为80了,然后重新写会__address__这个目标标签。
12.2.4:保留或丢弃对象
Relabeling另一个常见的用例就是过滤有标签的对象,keep或drop这两个动作可以来完成,使用这两个操作,可以帮助我们完成如下操作:

1:来自服务发现的哪儿些目标应该被抓取
2:从目标中抓取哪儿些指定的序列样本,或将其发送到远程存储
3:哪儿些报警规则发送到Alertmanager

一个keep动作的配置规则如下:

action: keep
source_labels: [<source label name list>]
separator: <source labels separator> # 默认值为";"
regex: <regex expression> # 默认为'(.*)'(匹配任何值)

keep操作同样按顺序执行如下操作:

1:使用separator分隔符将source_labels中列出的标签值连接起来
2:使用regex中的正则表达式是否与上一步的连接字符串匹配
3:如果不匹配,该对象将从最终输出列表中删除
4:如果匹配,则保留该 对象

drop动作和keep类似,只是它是删除一个对象而不保留,
同样接下来看一看keep和drop的示例:

# 只抓取具有注解的目标

在服务发现的时候,我们可能只想抓取那些具有特定元数据标签的目标,例如:下面配置让我们只抓取Kubernetes中具有example.io/should_be_scraped=true这个annotation的目标

action: keep
source_labels:
  [__meta_kubernetes_service_annotation_example_io_should_be_scraped]
regex: true

kubernetes服务发现机制下会将labels标签与Prometheus作为元信息输出到Prometheus,这些元数据信息都包含__meta前缀,这里我们的配置就是保留具有example.io/should_be_scraped这个annotation值为true的目标
12.2.5:只存储特定的指标
当使用metric_relabel_configs来控制目标的抓取方式时,我们可以使用下面的规则来只存储指定名称以api_或http_开头的指标。

action: keep
source_labels: [__name__]
regex: "(api_|http_)"
12.2.6:标签集映射
有时我们可能想把源标签的值映射到一组新的标签中去,这个时候我们可以使用labelmap这个动作,labelmap最常用的使用场景就是从服务中获取一组隐藏的或临时的元数据标签,并将它们映射到新的目标标签中去。

labelmap动作的配置规则如下:

action: labelmap
regex: <regular expression> # 默认为 "(.*)"
replacement: <replacement string> # 默认为 "$1"

和前面的一些action完全不同,labelmap是对标签而不是标签中的值进行重新匹配和操作,labelmap按时序执行以下步骤:

1:将regex中的正则表达式与所有标签签名进行匹配
2:将匹配到的标签名的任何匹配值复制到有replacement字符串决定的新的标签中

下面我们看一个使用labelmap映射Kubernetes Service标签的示例,当使用基于Kubernetres的服务发现来发现Pod端点时,我们可能希望每个端点的最终目标标签也包含Kubernetes Service标签,这样可以更好的区分端点数据。Kubernetes服务发现机制会将这些标签添加到Prometheus中去,标签名称格式为__meta_kubernetes_service_label_<labelname>,我们可以提取这些元数据标签中的<labelname>部分,并将相应的标签值映射到一组k8s_为前缀的新标名称上:

action: labelmap
regex: __meta_kubernetes_service_label_(.+)
replacement: "k8s_$1"

通过上面的labelmap操作,regex正则表达式中匹配标签名,然后将标签名对应的值复制到k8s_$1的新标签中,$1其实就是匹配的标签名这个捕获组。
12.2.7:保留或删除标签
有的时候我们也与保留或者删除标签的一些需求,比如有的目标在时间序列上提供了许多额外的标签,这些标签用途不大,这个时候我们就可以使用labelkeep和labeldrop这两个操作,使用这两个操作可以有选择地保留或删除一些标签:

labelkeep的配置规则如下:

action: labelkeep
regex: <regular expression> # 默认为 '(.*)'

一样labelkeep按顺序执行下面步骤:

1:首先将regex中的正则表达式与所有标签名称进行匹配
2:它只保留那些匹配的标签

labeldrop与labelkeep类似,只是它是删除那些匹配正则表达式的标签而不是保留、
下面我们来看一个例子:

# 从报警中删除高可用的副本标签
当运行两个相同的Prometheus作为高可用的时候,通常两个服务都做配置为一个外部标签(通过全局配置选项external_labels),表明它们代表哪儿个副本,例如:replica: A和replica: B,从个副本向同一个Alertmanager实例发送告警之前,Prometheus需要删除这个副本标签,这样Alertmanager就不会把收到的报警看成不同的报警了,否则我们会收到两个相同的报警通知,这个时候我们就可以使用labeldrop来实现这个操作:

action: labeldrop
regex: repliac

这条配置规则很简单,就是匹配replica这个标签,然后执行labeldrop删除标签的操作即可


# 删除指标中不需要的标签
有的时候我们抓取的指标在每个时间序列都附加了一些额外的标签,这些标签对于我们来说用处不大,还会增加Prometheus的存储压力,所以我们可以想办法删除这些不需要的额外标签

比如我们想要删除以info_开头的标签,我们可以使用下面的配置规则来实现:

action: labeldrop
regex: info_.*

同样也只是配置一个要删除的目标标签的正则表达式即可,只要匹配了标签都会执行labeldrop操作将该标签进行删除。

# 标签值哈希和分片
在一些场景下我们可能需要运行多个几乎相同的Prometheus副本来横向扩展,每个副本只抓取部分目标,这样可以降低Prometheus的压力,在这种情况下hashmod操作有助于我们对目标进行分片操作。

hashmod的配置规则如下:

action: hashmod
source_labels: [<source label name list>]
modulus: <modulus value>
target_label: <target_label>

该操作按顺序执行下面步骤:

1:首先部分分隔符将源标签集source_labels的值连接起来
2:计算连接后字符串的哈希值
3:将modulus中提供的模数应用于哈希值,以将哈希值限制在0和modulus-1之间
4:将上一步的模板数值存储在target_label目标标签中

使用hashmod的主要场景是将一个服务的整体目标进行分片,用于水平扩展Prometheus,通过首先根据每个目标的一个或者多个标签计算基于哈希的模数来实现的,然后只保留有特定输出模数值得目标,比如为了根据instance标签对目标进行分片,只保留分片2得实例,我们可以把hashmod和keep得操作结合起来:

- action: hashmod
  source_labels: [instance]
  modulus: 10
  target_label: __tmp_hashmod
- action: keep
  source_labels: [__tmp_hashmod]
  regex: 2

首先通过hashmod操作对instance标签进去哈希操作,将取模后得值存储在临时标签__tmp_hashmod中。然后通过第二个keep操作,只保留分片数为2的指标,这样就达到了分片的目的了

到这儿我们基本上就了解了relabeling的使用了,接下来我们可以来了解下服务发现在Prometheus中的使用、
12.3:基于Consul的服务发现
接下来我们要介绍的是Prometheus中如何使用服务发现来查找和抓取目标。我们知道Prometheus配置文件中可以通过statuc_configs来配置静态的抓取任务,但是云环境下,特别是容器环境下,抓取的目标地址是经常变动的,所以如果我们再用静态的配置的话就不满足这些场景了,所以我们需要监控系统能够动态感知这个变化,不可能每次变动都去手动重新配置的,为了应对复杂的的动态环境,Prometheus也提供了与基础设施中的服务发现集成的功能。

静态配置:

[root@prometheus ~]# cat /usr/local/prometheus/prometheus.yml
global:
  scrape_interval: 15s
  evaluation_interval: 15s


scrape_configs:
  - job_name: "prometheus"
    static_configs:
      - targets: ["localhost:9090"]

  - job_name: "demo"
    scrape_interval: 15s
    scrape_timeout: 10s
    static_configs:
      - targets: ["localhost:10000","localhost:10001","localhost:10002"]
  - job_name: "demmo_2"
    scrape_interval: 10s
    scrape_timeout: 5s
    static_configs:
      - targets: ["10.0.0.11:9100"]
Prometheus已经支持多种内置的服务发现机制:

1:发现云厂商的VM虚拟机
2:Kubernetes上的自动发现
3:通用的服务查找,例如DNS,Consul,Zookeeper或者自定义自动发现规则

我们都可以通过Prometheus配置文件中的scrape_config部分进行配置,Prometheus会不断的更新动态的抓取目标列表,自动亭子抓取旧的实例,开始抓取新的实例,Prometheus特别适合进行于Kubernetes集群下面,可以自动发现监控目标。

此外大部分服务发现机制还会提供目标的一些元数据,通常都是带有__的前缀,比如标签,注解,服务吗等等,可以在relabeling阶段使用这些元数据来过滤修改目标,这些元数据信息标签在重新标记节点被删除。
Consul是由HashiCorp开发的一个支持多数据中心的分布式服务发现和键值对存储服务的开源软件,是一个通用的服务发现和注册中心工具,被大量应用于基于微服务的软件架构中。
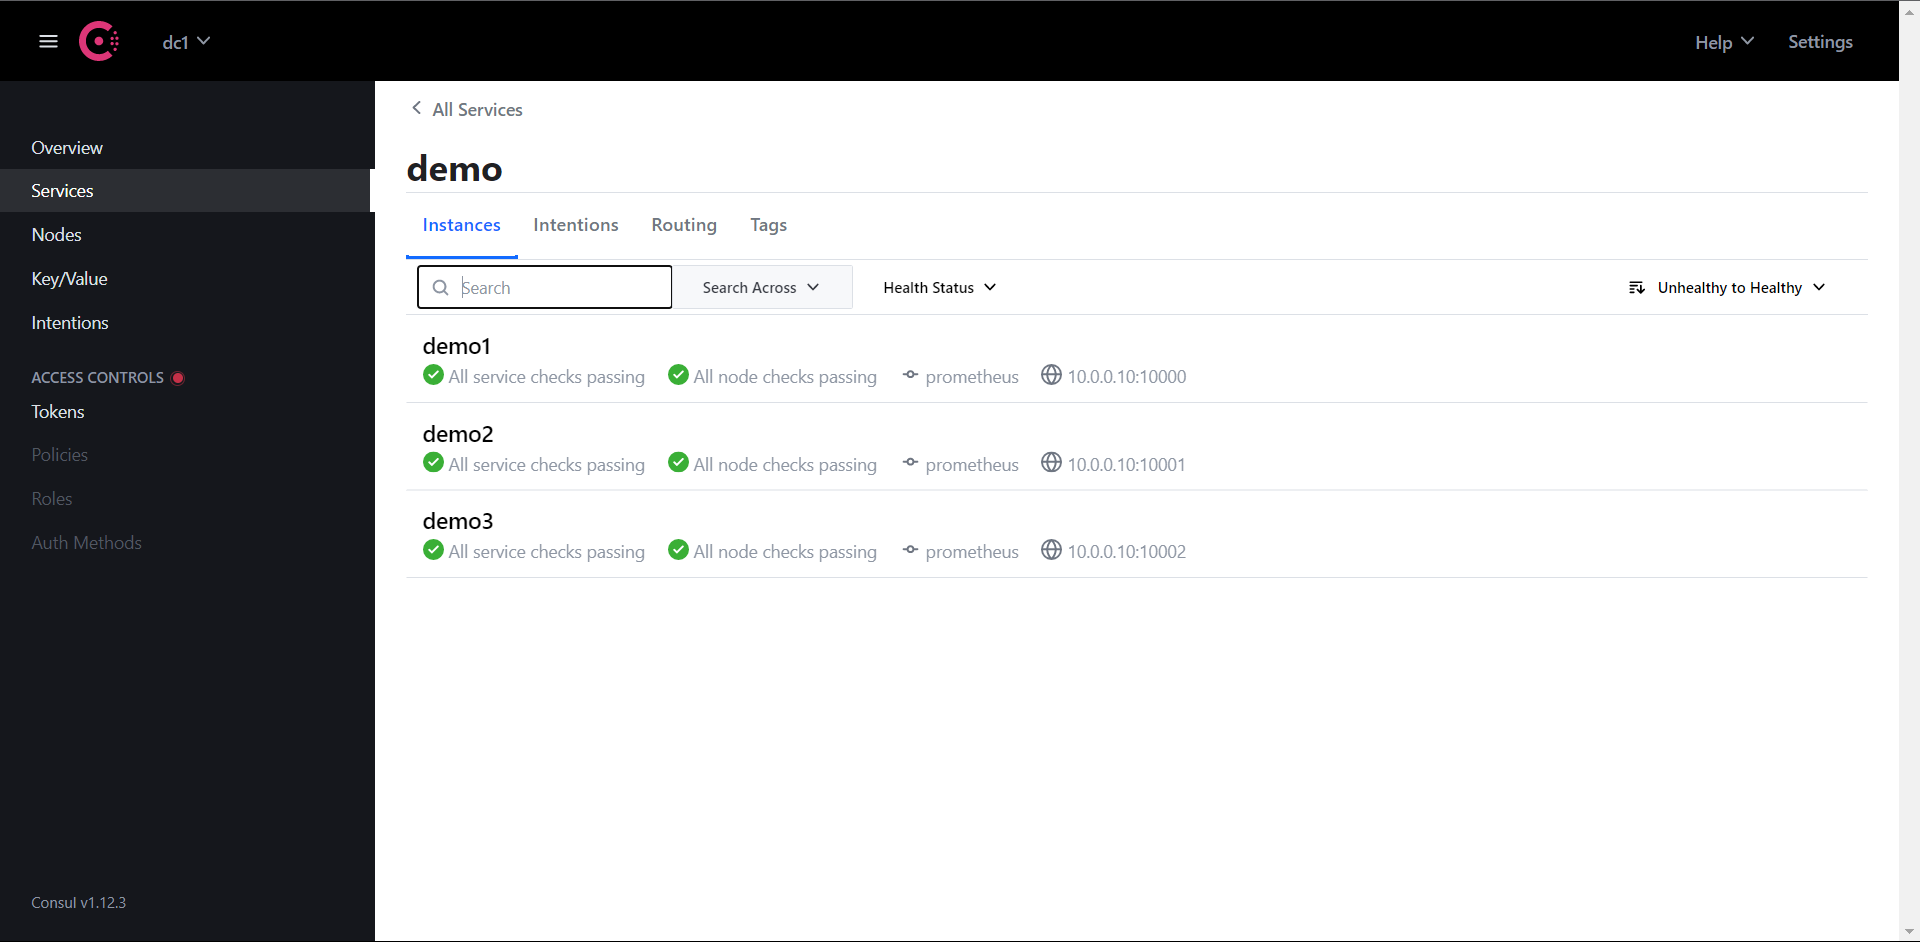
接下来我们尝试使用Prometheus基于Consul的服务发现来监控前面的三个demo服务
10.0.0.10:10000
10.0.0.10:10001
10.0.0.10:10002
我们将demo服务注册到Consul,然后配置Prometheus从Consul中发现演示服务实例,并使用Relabeling操作来过滤调整目标标签。关于Consul本身使用可以查看官方文档:https://learn.hashicorp.com/consul了解更多。
12.3.1:安装Consul并配置
在页面https://www.consul.io/downloads下载符合自己系统的安装文件,(我这里是Linux)
# 下载并解压Consul
wget https://releases.hashicorp.com/consul/1.12.3/consul_1.12.3_linux_amd64.zip
unzip consul_1.12.3_linux_amd64.zip

# 移动Consul到/usr/local/bin下并查看版本
mv consul /usr/local/bin/
# consul version
Consul v1.12.3
Revision 2308c75e
Protocol 2 spoken by default, understands 2 to 3 (agent will automatically use protocol >2 when speaking to compatible agents)

当Consul命令正常之后证明已经安装完成了,接着我们创建一个用于注册demo服务的consul配置文件demo-service.json

cat demo-service.json
{
  "services": [
    {
      "id": "demo1",
      "name": "demo",
      "address": "10.0.0.10",
      "port": 10000,
      "meta": {
        "env": "production"
      }
    },
    {
      "id": "demo2",
      "name": "demo",
      "address": "10.0.0.10",
      "port": 10001,
      "meta": {
        "env": "production"
      }
    },
    {
      "id": "demo3",
      "name": "demo",
      "address": "10.0.0.10",
      "port": 10002,
      "meta": {
        "env": "staging"
      }
    }
  ]
}

当然了一般情况下我们也是在Consul中进行动态注册服务的,但是我们这里只是简单的演示Prometheus基于Consul的服务发现,这里就使用了Consul的静态配置注册服务,Consul允许使用JSON中的meta属性将key:value元数据与每个注册服务实例相关联,比如我们在这里配置了env属性和部署环境production或staging进行关联,后面我们可以通过使用过Prometheus里面的Relabeling操作提取该字段并将其映射到每个抓取实例的标签中去。

为了查看更多的日志信息,我们可以在dev模式下运行Consul:

consul agent -dev -config-file=demo-service.json -client 0.0.0.0
==> Starting Consul agent...
           Version: '1.12.3'
           Node ID: 'ccca0938-ee0f-e9b4-41db-215d8a8f0c00'
         Node name: 'prometheus'
        Datacenter: 'dc1' (Segment: '<all>')
            Server: true (Bootstrap: false)
       Client Addr: [0.0.0.0] (HTTP: 8500, HTTPS: -1, gRPC: 8502, DNS: 8600)
      Cluster Addr: 127.0.0.1 (LAN: 8301, WAN: 8302)
           Encrypt: Gossip: false, TLS-Outgoing: false, TLS-Incoming: false, Auto-Encrypt-TLS: false

==> Log data will now stream in as it occurs:

web访问:http://10.0.0.10:8500
12.3.2:配置Prometeheus
地址:https://prometheus.io/docs/prometheus/latest/configuration/configuration/#consul_sd_config
简单配置一下,这里没有过多的配置Consul的东西,比如认证一类的
[root@prometheus prometheus]# cat prometheus.yml
global:
scrape_interval: 15s
evaluation_interval: 15s
scrape_configs:
- job_name: "prometheus"
static_configs:
- targets: ["localhost:9090"]
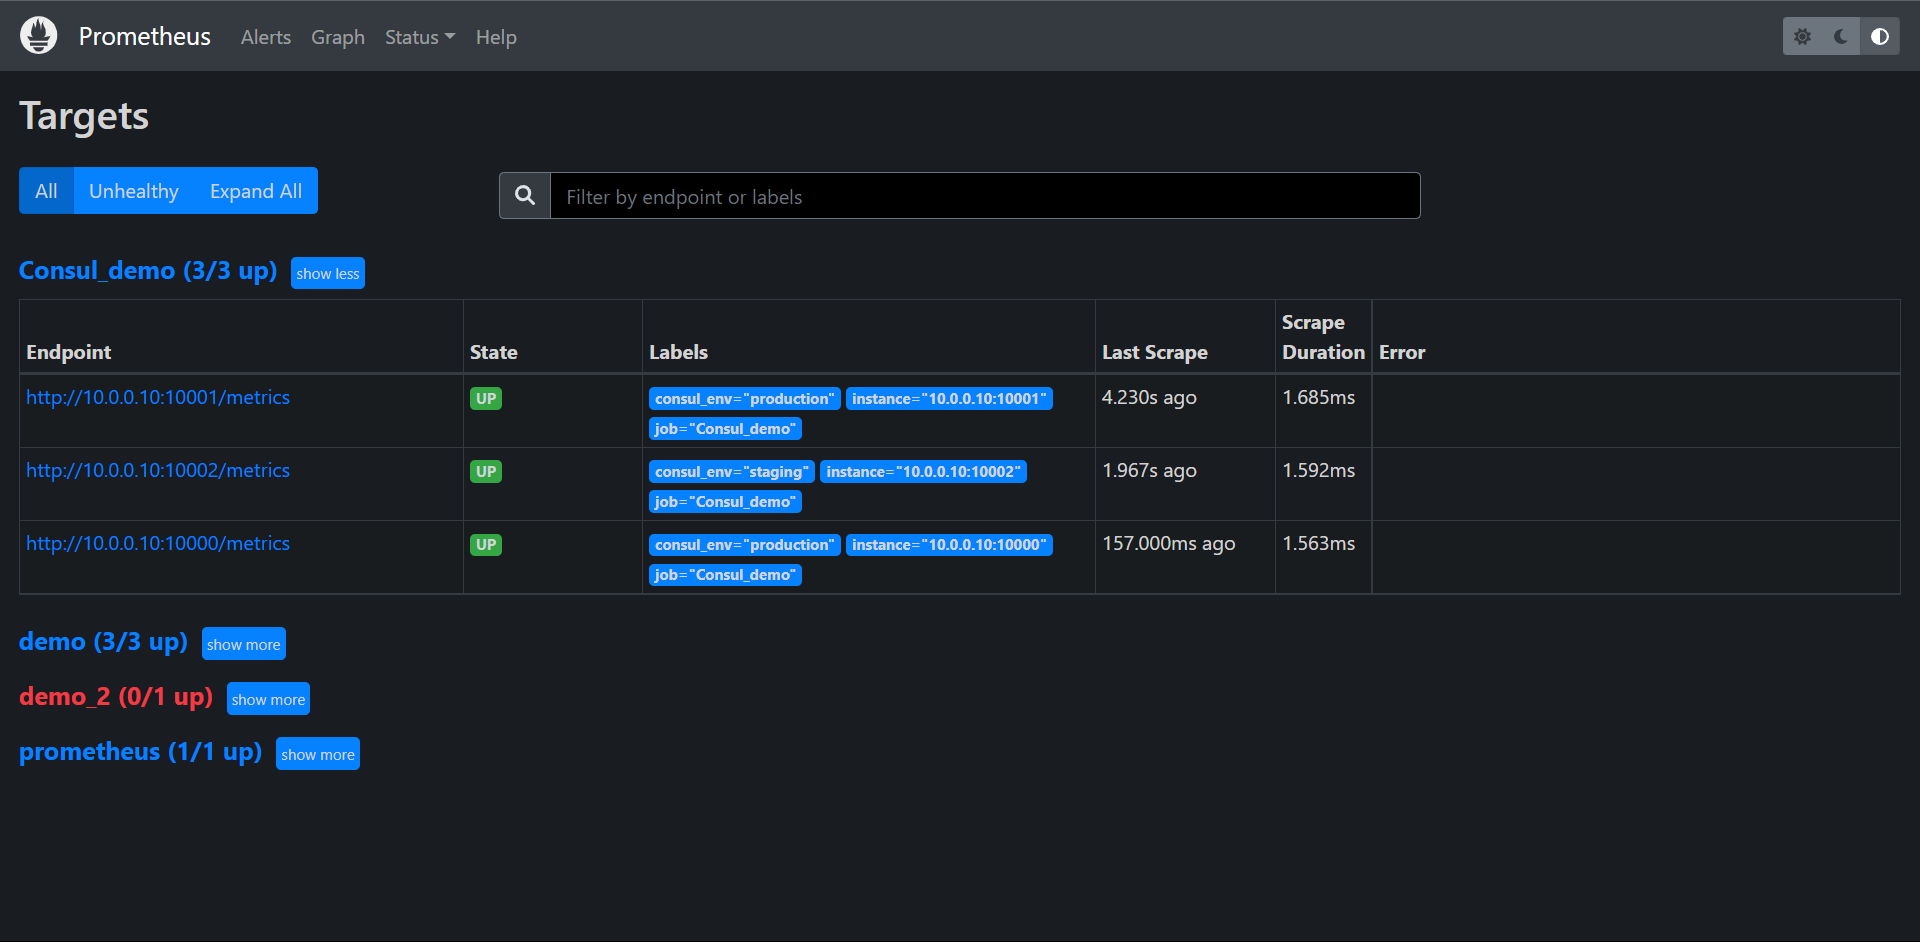
- job_name: "Consul_demo"
consul_sd_configs:
- server: "localhost:8500"
启动Prometehus
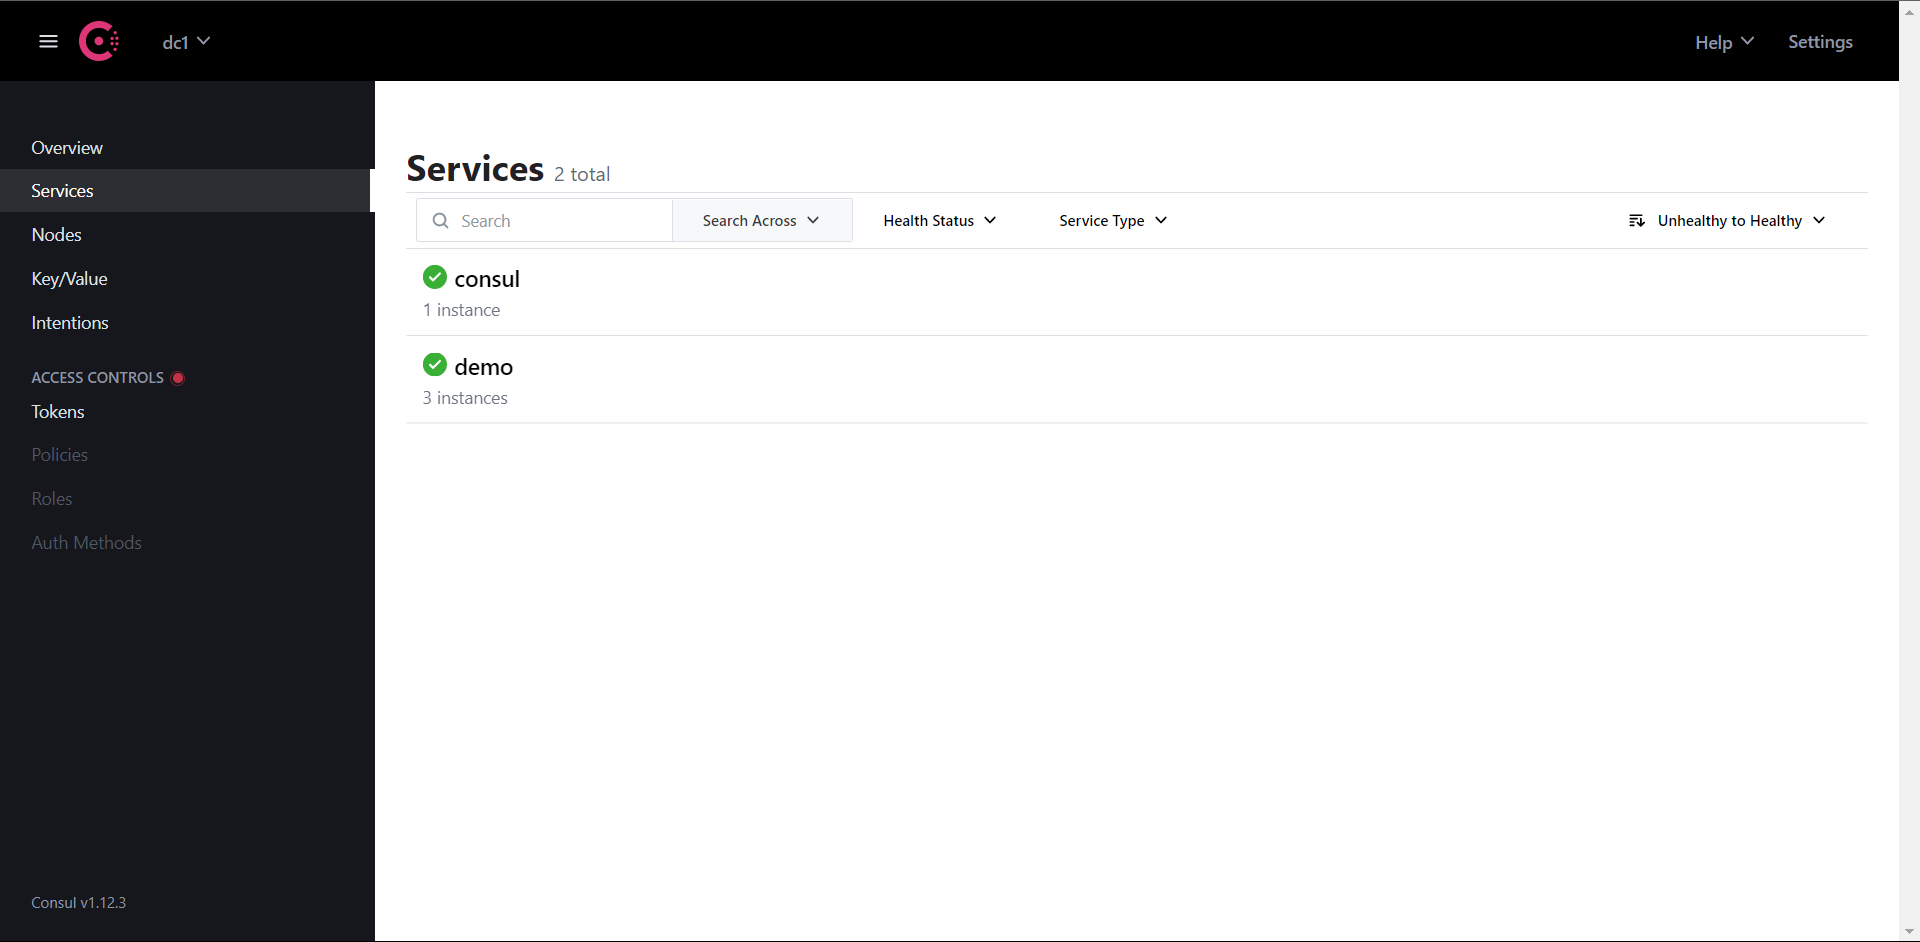
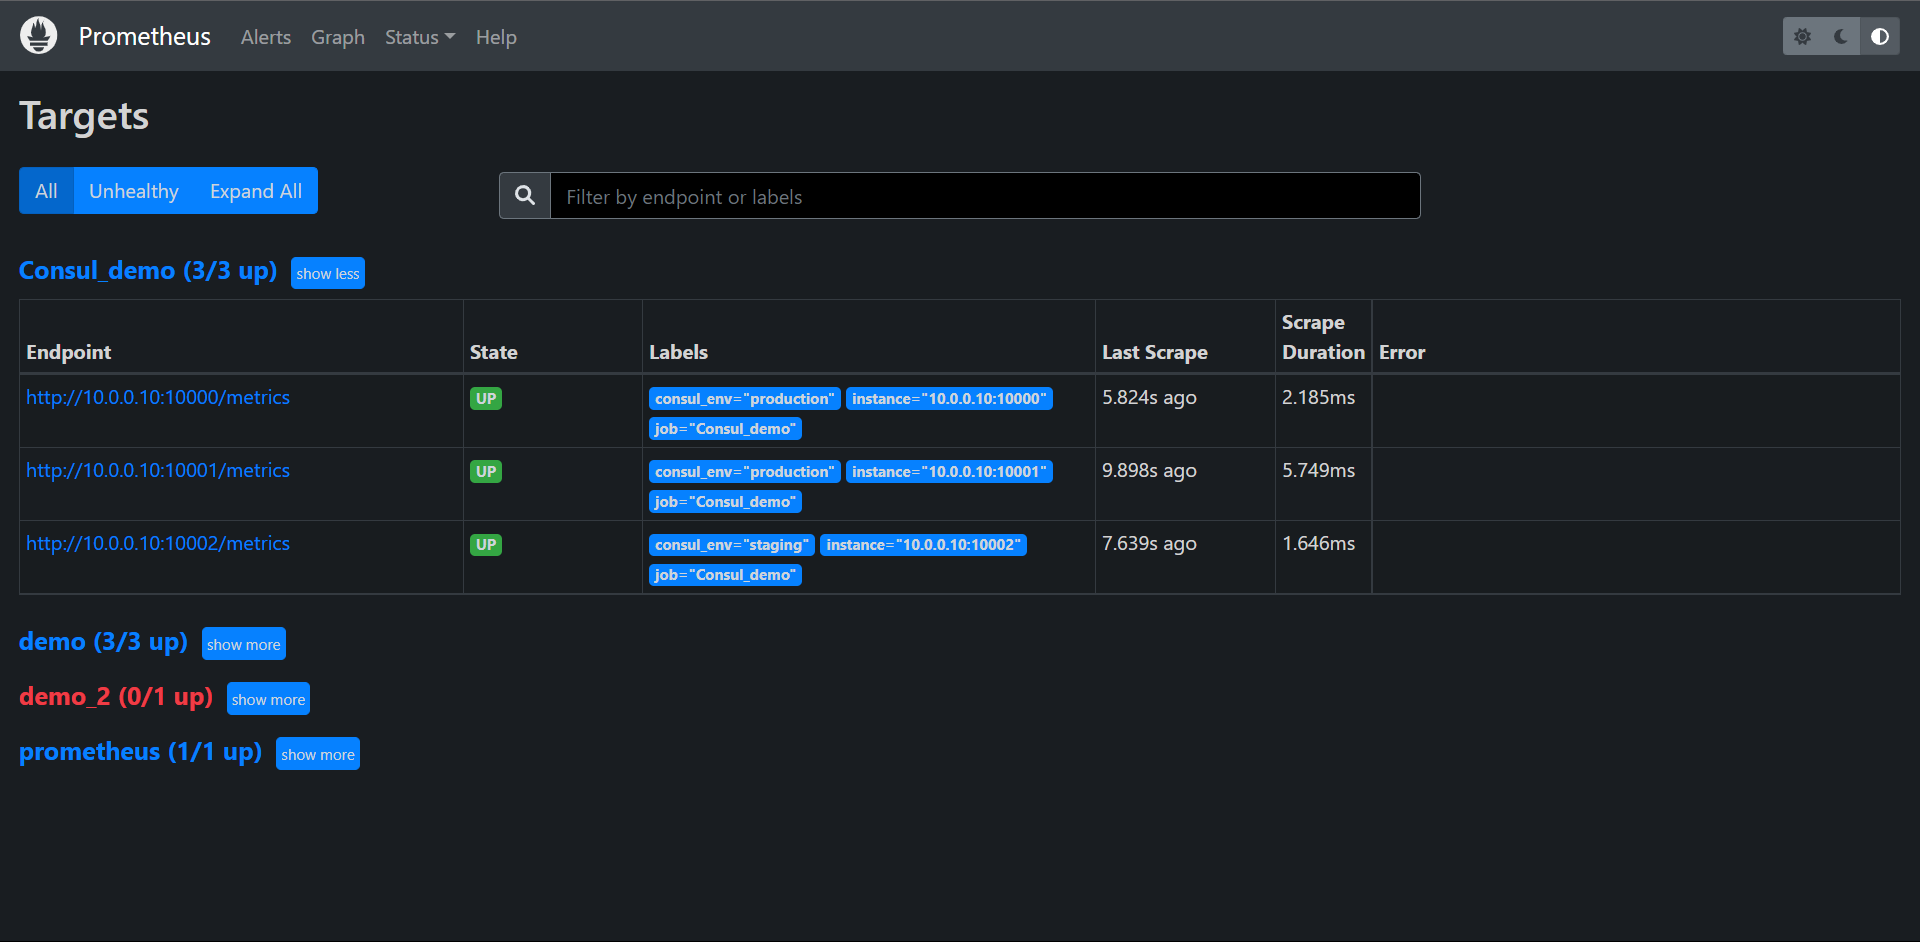
我们可以看到Consul的服务已经在Prometheus中被发现了,但是我们发现它有一个是无法获取的,这是因为Consul的本身的服务没有/metrics这个路径,所以我们可以利用relabeling这个操作来把它过滤掉:

我们观察这里的一个标签__meta_consul_service="demo",consul自带的服务是__meta_consul_service="consul",我们直接使用drop操作把它删掉就OK了
在Prometheus的配置文件内添加

global:
  scrape_interval: 15s
  evaluation_interval: 15s


scrape_configs:
  - job_name: "prometheus"
    static_configs:
      - targets: ["localhost:9090"]
  - job_name: "Consul_demo"
    consul_sd_configs:
     - server: "localhost:8500"
    relabel_configs:
     - action: drop
       source_labels: [__meta_consul_service]
       regex: consul

再次启动Prometheus,发现刚刚那个匹配标签的服务就没有了。
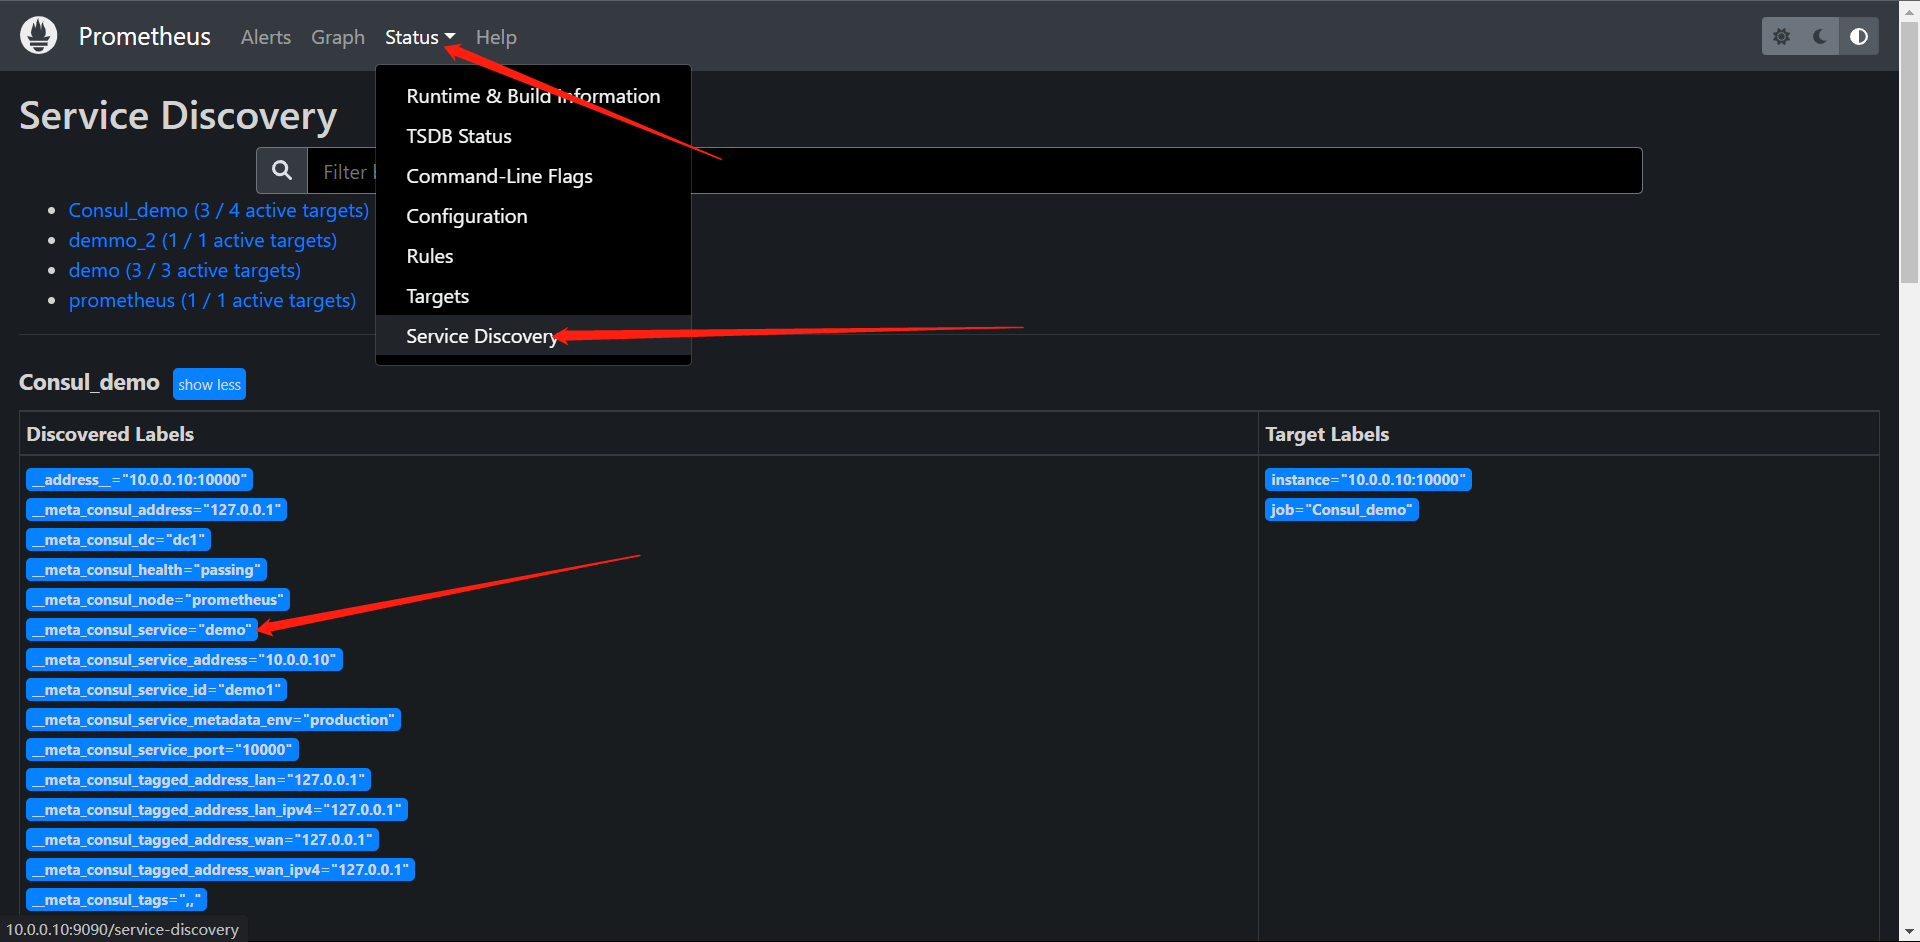
接下来我们需要看的是我们刚在启动Consul的配置文件中给demo服务添加个meta的标签
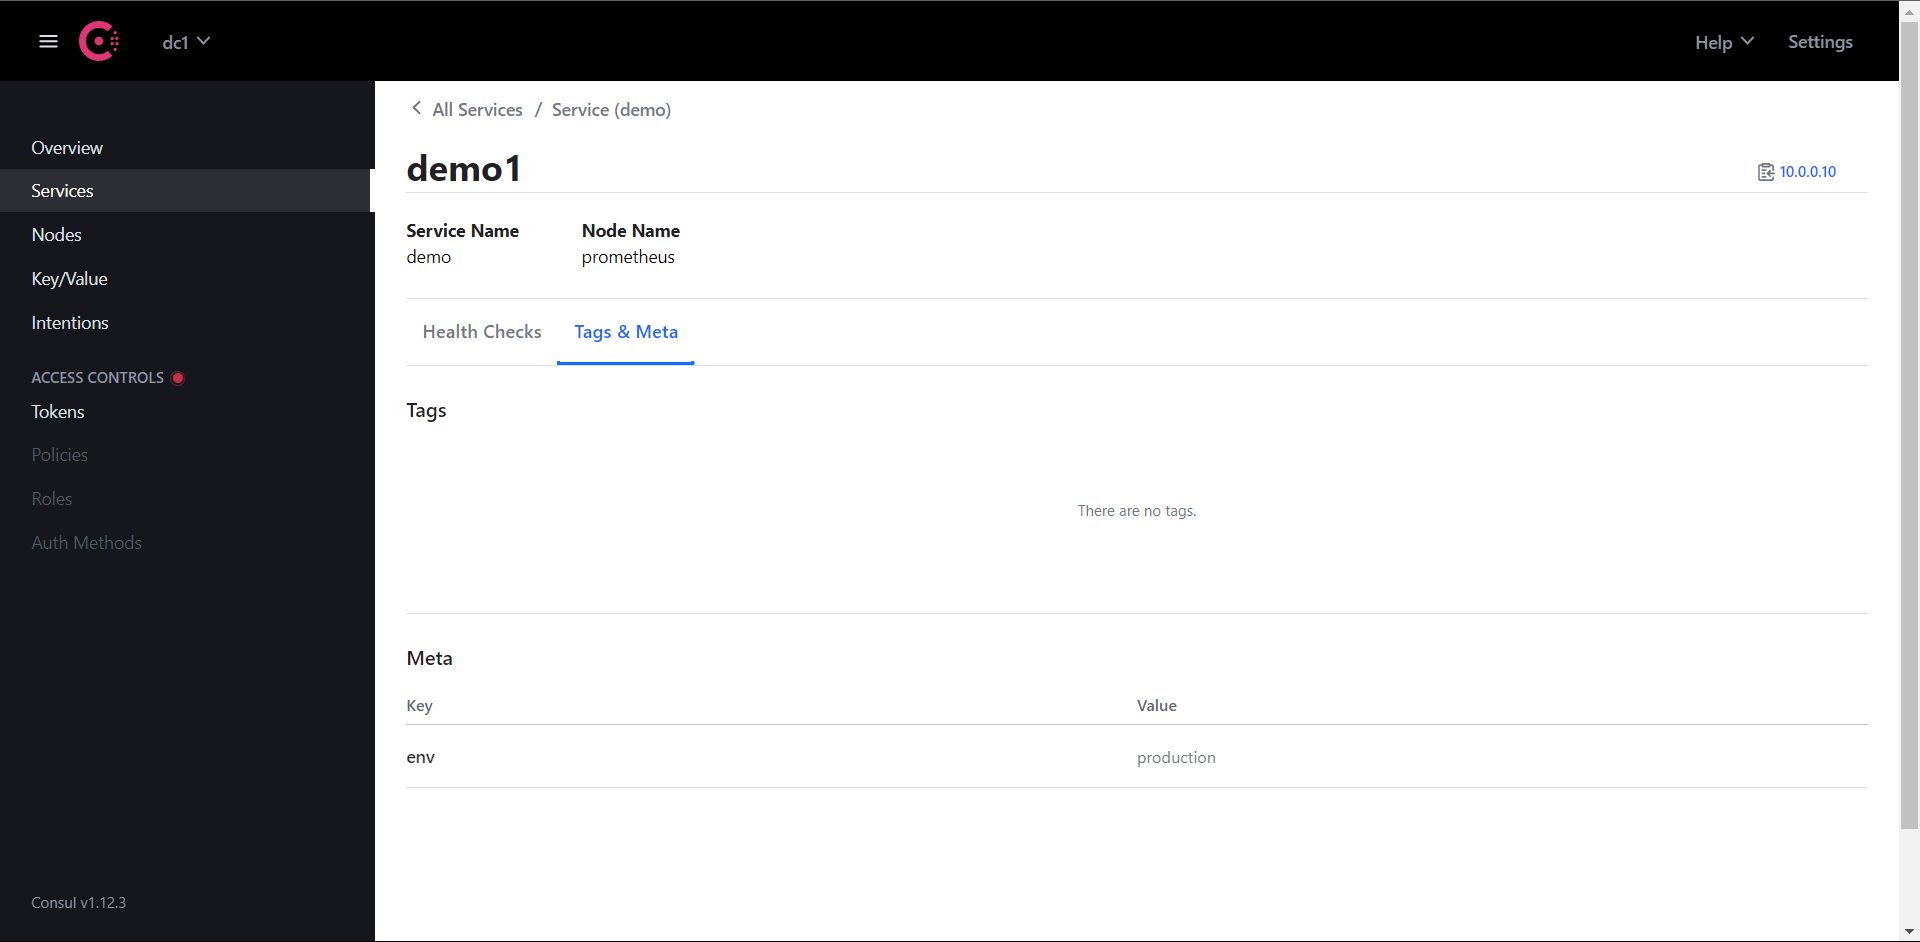
那么,我们如何把这个标签添加给Prometheus抓取后的标签中呢?方便PromQL查询的时候可以很好的过滤环境

我们注意到上面的标签貌似都是以__meta_consul_service_metadata_env作为标签的,我们只需要映射成标签就行了

cat prometheus.yml
global:
  scrape_interval: 15s
  evaluation_interval: 15s


scrape_configs:
  - job_name: "prometheus"
    static_configs:
      - targets: ["localhost:9090"]
  - job_name: "Consul_demo"
    consul_sd_configs:
     - server: "localhost:8500"
    relabel_configs:
     - action: drop
       source_labels: [__meta_consul_service]
       regex: consul
     - action: labelmap
       regex: __meta_consul_service_metadata_env_(.*)
       replacement: consul_$1

重新Prometheus

这里我们可以清楚的看到多了一个标签,这个时候我们就可以根据这个标签来过滤环境和数据了
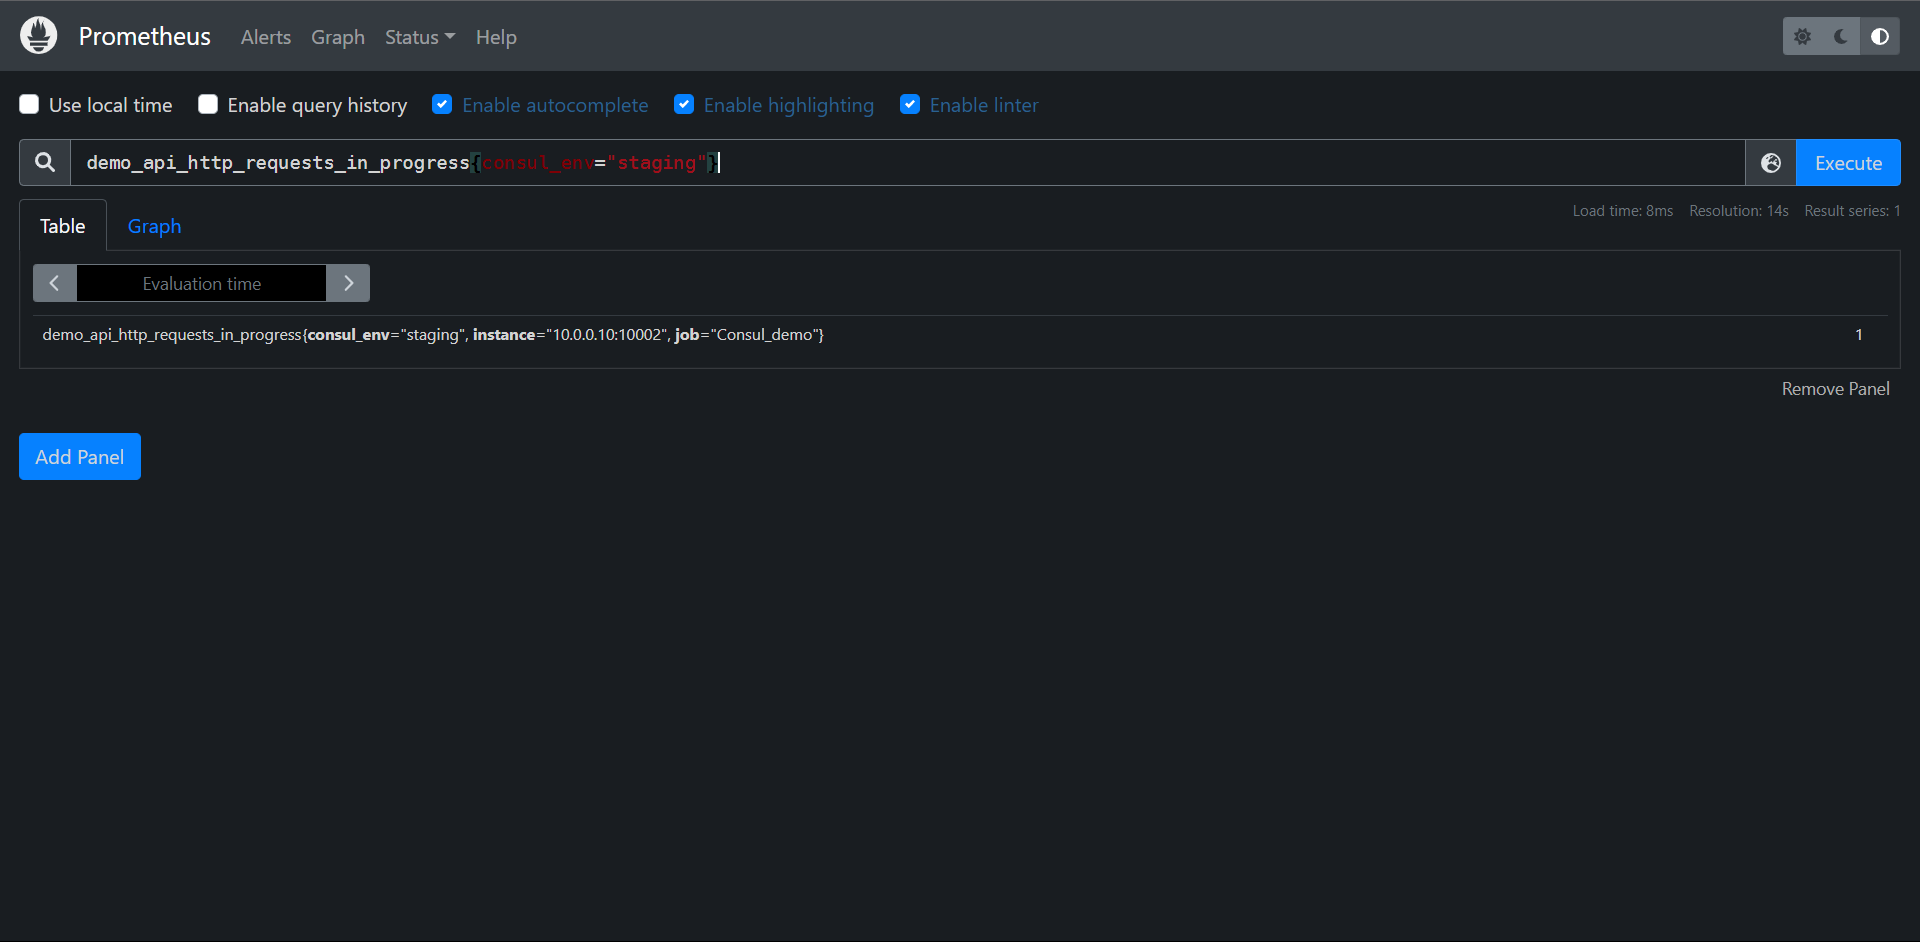
PromQL:demo_api_http_requests_in_progress{consul_env="production"}
PromQL:demo_api_http_requests_in_progress{consul_env="staging"}

那么我们杀掉一个自动发现的服务会怎么样呢?实战一下.
ps -ef | grep prometheus
root 17659 17609 1 Jul18 pts/1 01:27:54 ./prometheus_demo_service --listen-address=:10000
root 17663 17609 1 Jul18 pts/1 01:27:46 ./prometheus_demo_service --listen-address=:10001
root 17667 17609 1 Jul18 pts/1 01:28:04 ./prometheus_demo_service --listen-address=:10002
root 21024 17609 0 11:43 pts/1 00:00:01 ./prometheus
root 21036 20809 0 11:55 pts/0 00:00:00 grep --color=auto prometheus
kill -9 17659
ps -ef | grep prometheus
root 17663 17609 1 Jul18 pts/1 01:27:46 ./prometheus_demo_service --listen-address=:10001
root 17667 17609 1 Jul18 pts/1 01:28:05 ./prometheus_demo_service --listen-address=:10002
root 21024 17609 0 11:43 pts/1 00:00:01 ./prometheus
root 21038 20809 0 11:55 pts/0 00:00:00 grep --color=auto prometheus
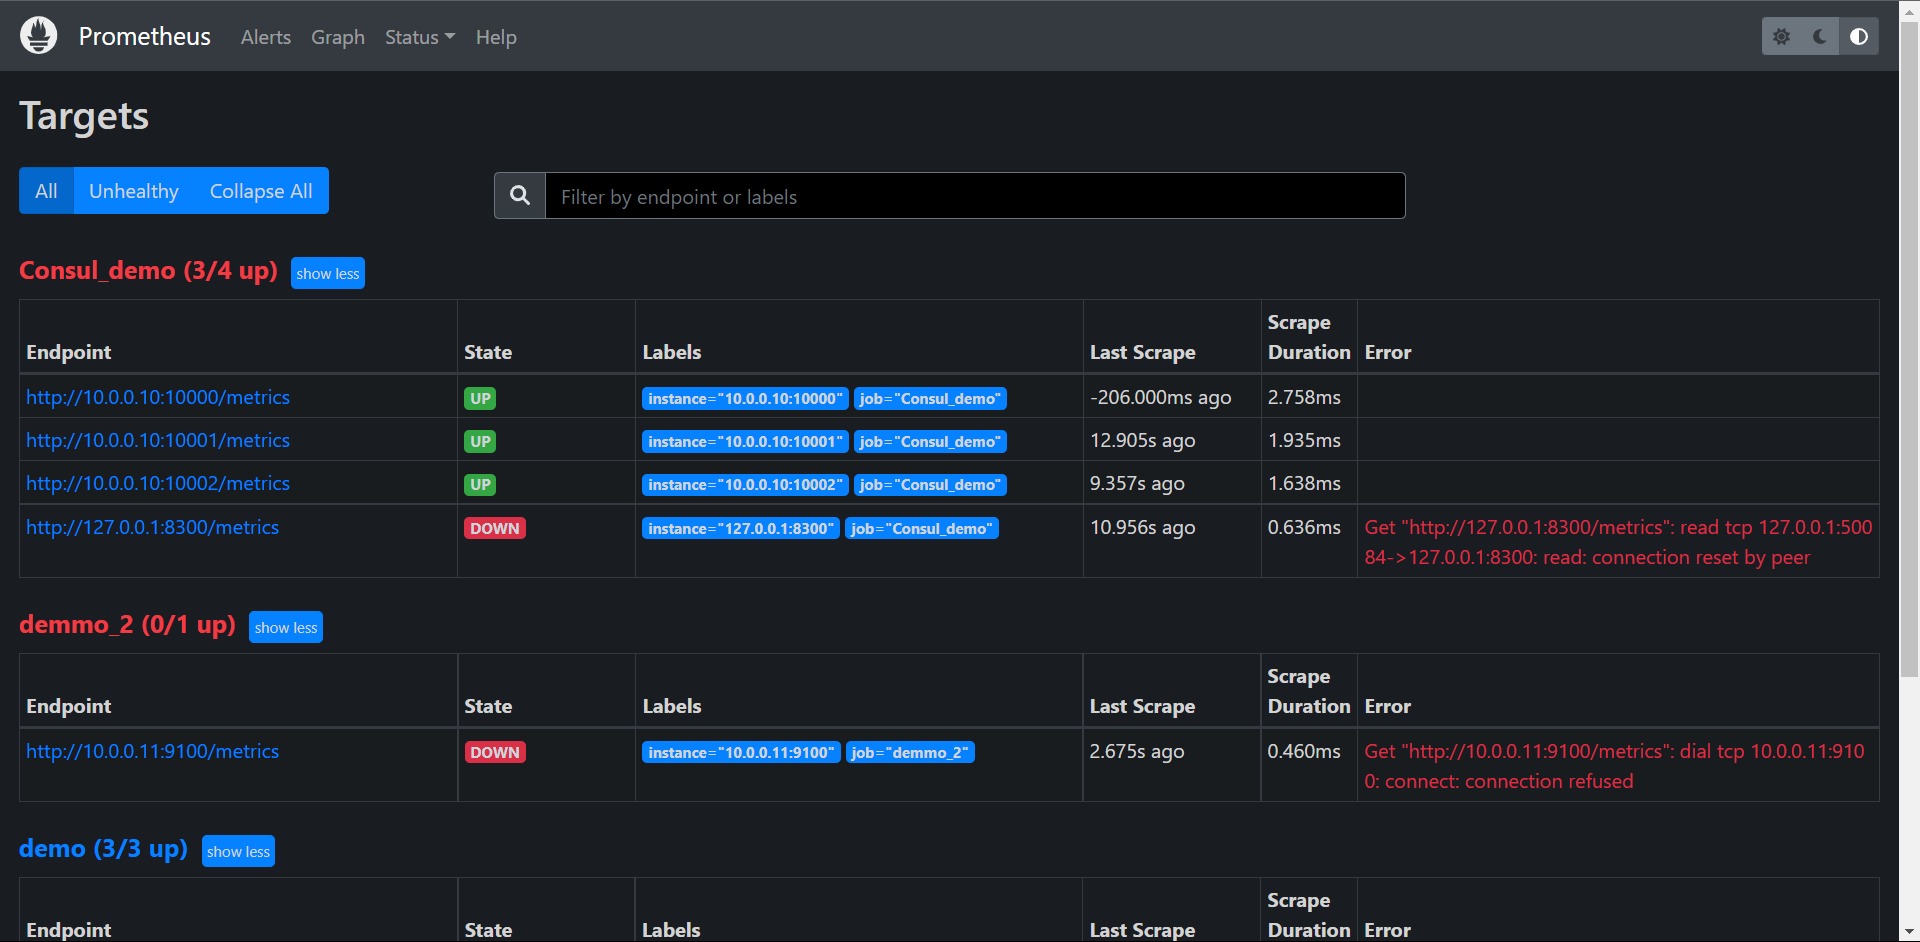
检查Consul和Prometheus
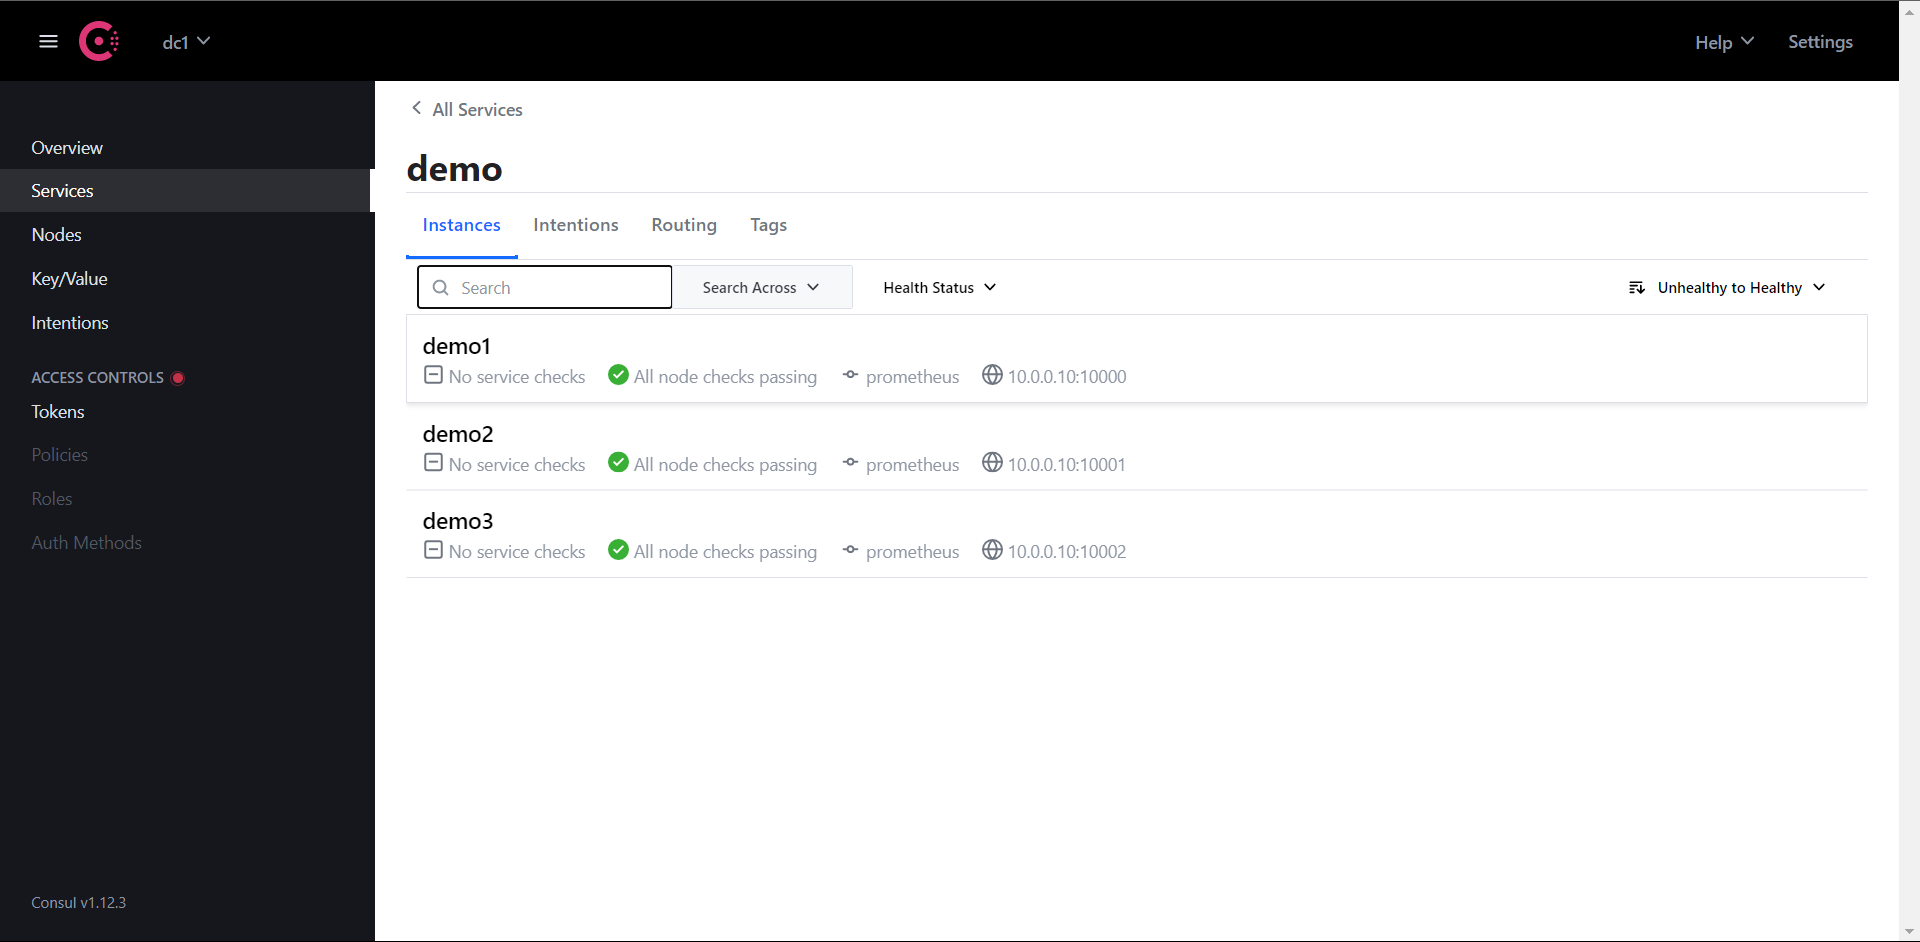
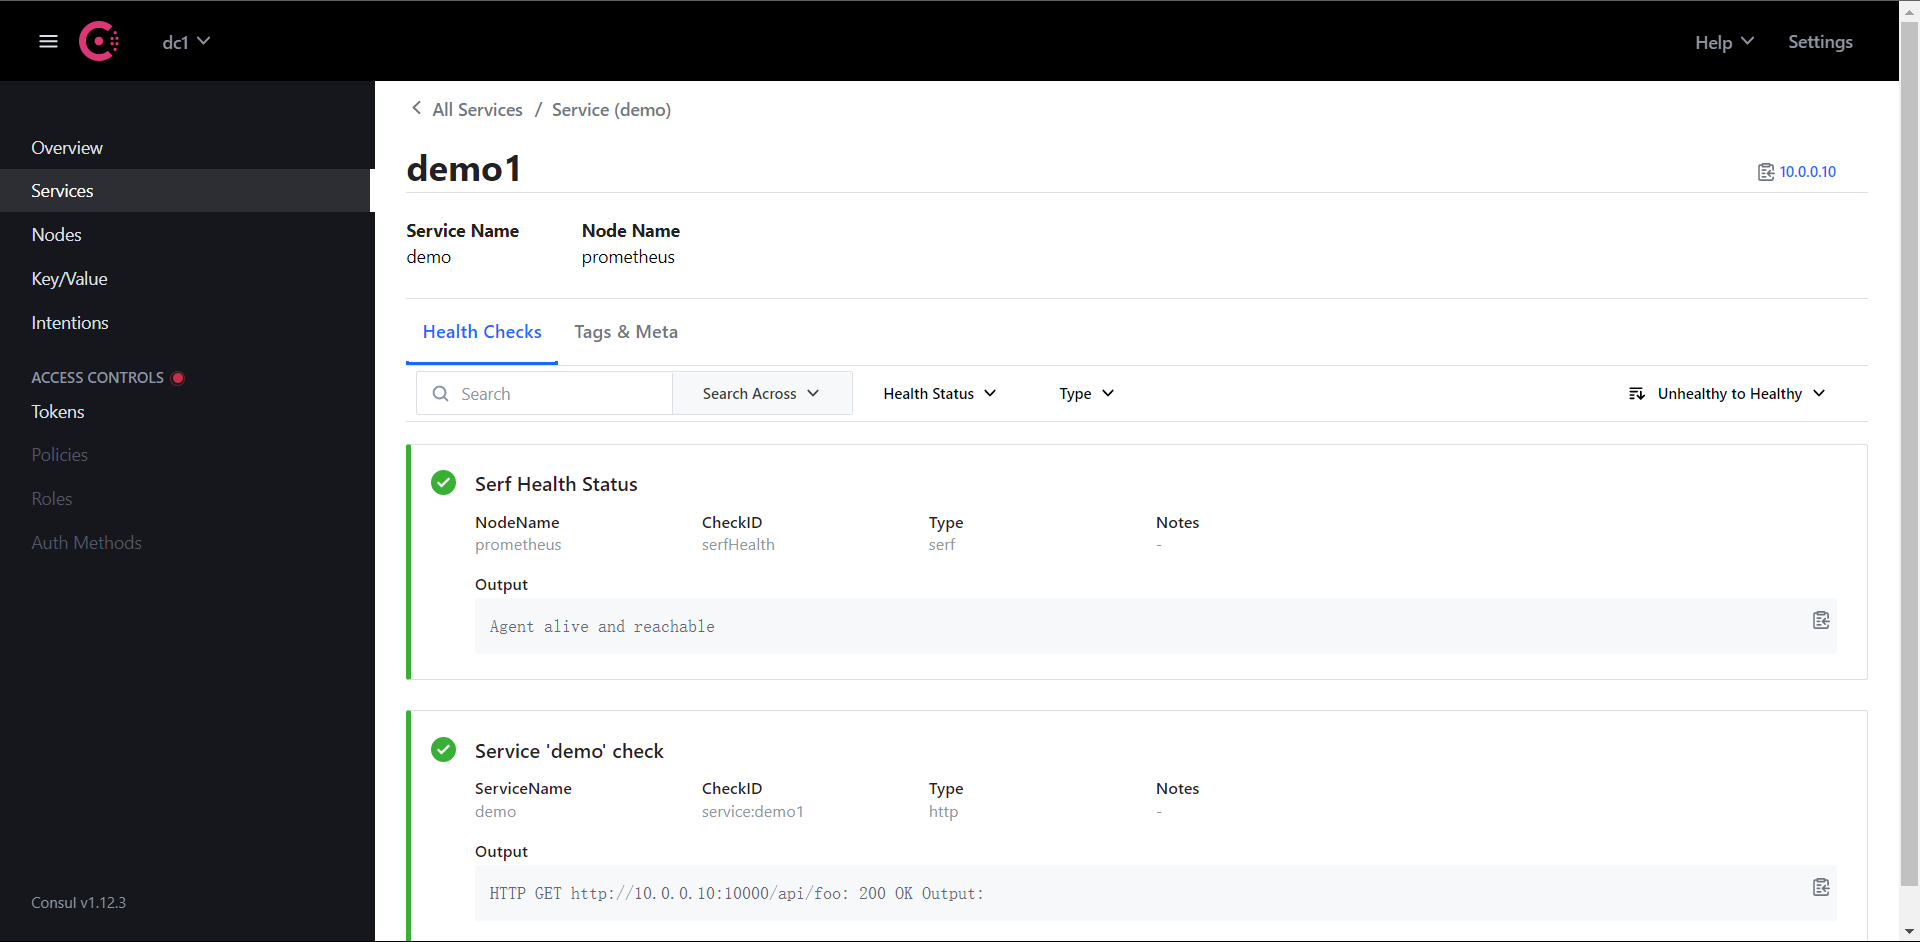
注意,这个时候Consul没检测出服务down掉是因为我们并没有配置Check让Consul去检测我们的服务,所以才会提示健康

但是我们在Prometheus中已经发现服务已经抓取不到数据down掉了。我们实际生产中是否想看到这个down掉的实例完全是看我们的需求,正常来说,如果出现这种问题我们应该让Prometheus推送告警到Altermanager进行告警的,当然了,也有为了其他原因而不想看到Down掉的服务,那么我们怎么处理呢?

接下来我们还是去看配置:
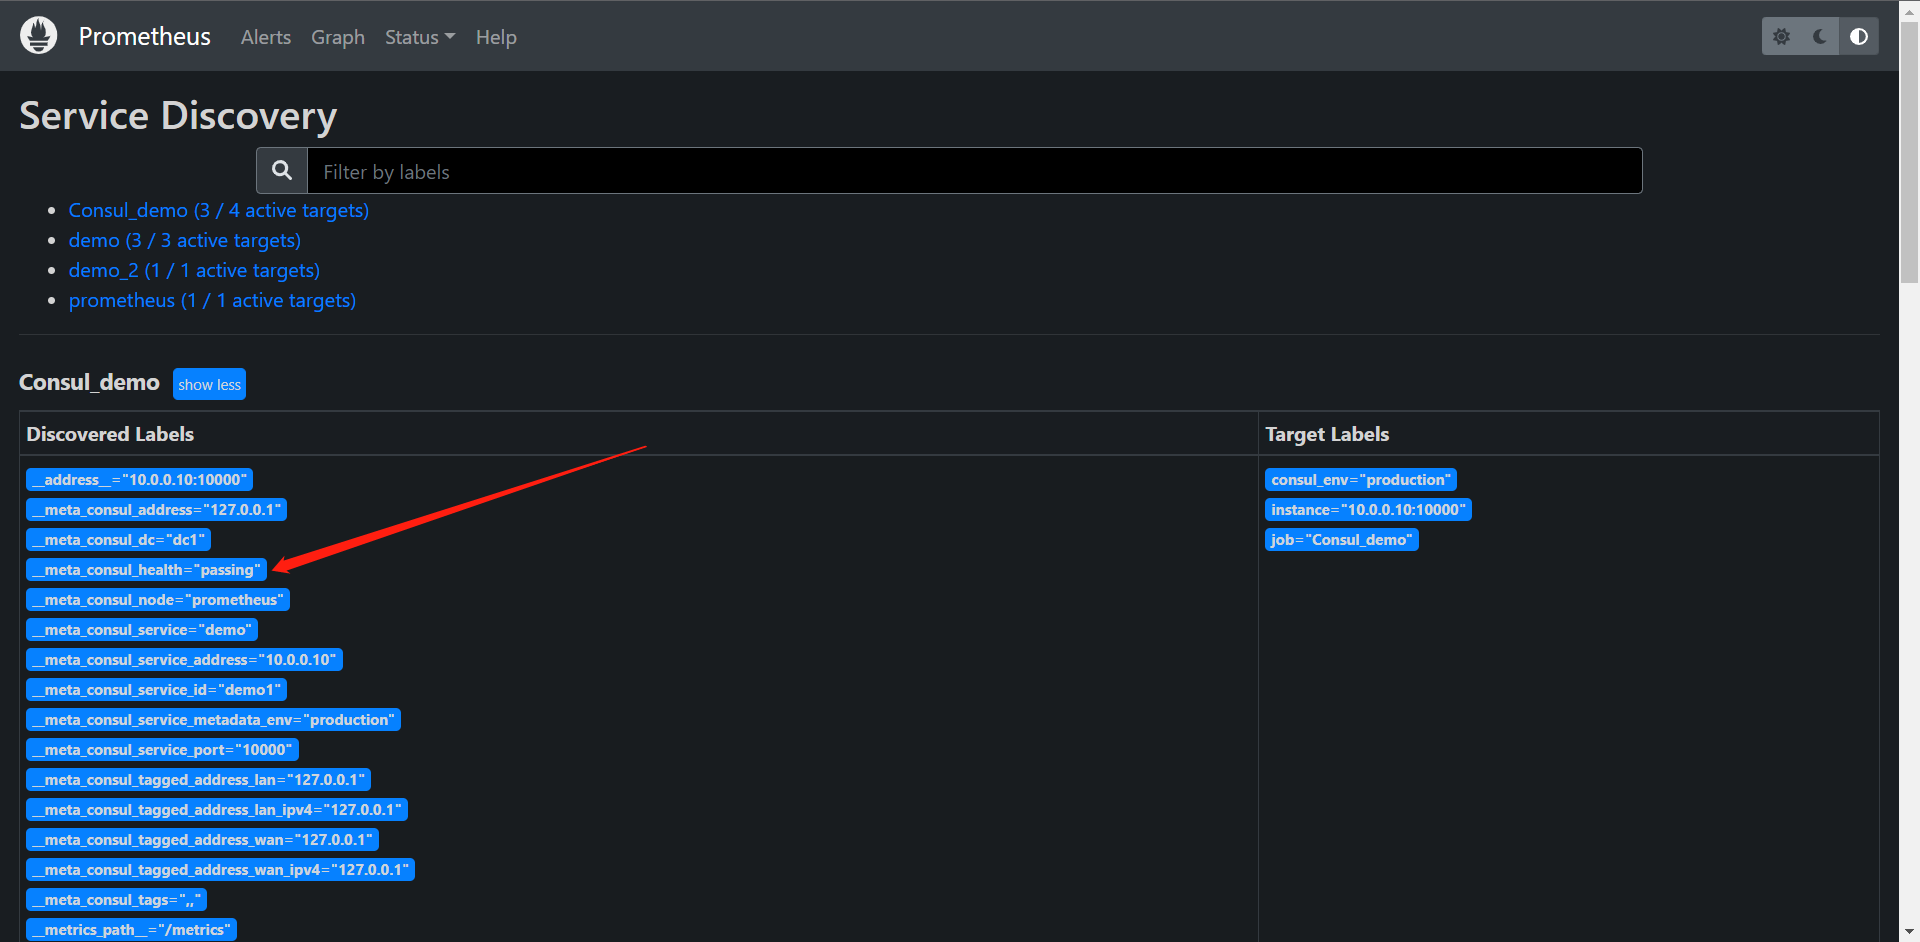
我们可以看到这里 __meta_consul_health="passing",我们可以给它配置一个Service的检查,那么这个健康检查在哪儿呢?我们可以配置在Consul内
{
"services": [
{
"id": "demo1",
"name": "demo",
"address": "10.0.0.10",
"port": 10000,
"meta": {
"env": "production"
},
"checks": [
{
"http": "http://10.0.0.10:10000/api/foo",
"interval": "1s"
}
]
},
{
"id": "demo2",
"name": "demo",
"address": "10.0.0.10",
"port": 10001,
"meta": {
"env": "production"
},
"checks": [
{
"http": "http://10.0.0.10:10001/api/foo",
"interval": "1s"
}
]
},
{
"id": "demo3",
"name": "demo",
"address": "10.0.0.10",
"port": 10002,
"meta": {
"env": "staging"
},
"checks": [
{
"http": "http://10.0.0.10:10002/api/foo",
"interval": "1s"
}
]
}
]
}
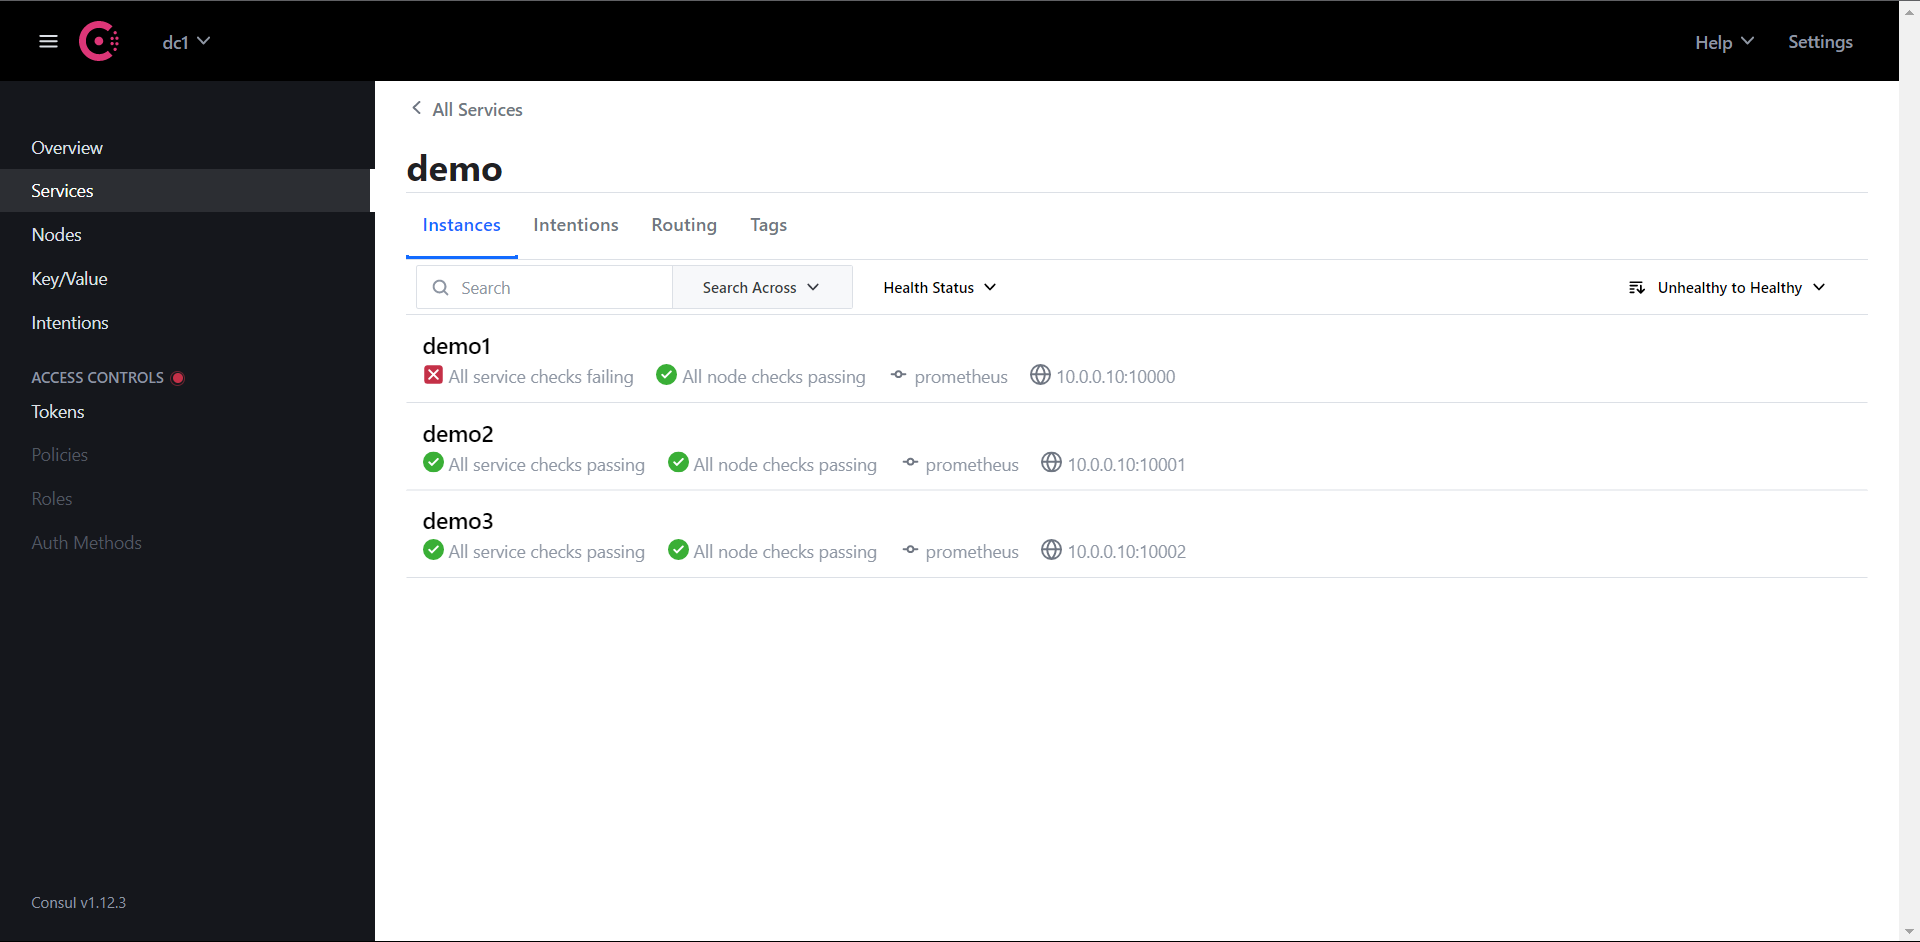
配置完Consul再次查看一下

我们可以看到我们配置的检测机制了,那么这个时候我们就该去配置Prometheus让它去过滤 __meta_consul_health 这个标签了
global:
scrape_interval: 15s
evaluation_interval: 15s
scrape_configs:
- job_name: "prometheus"
static_configs:
- targets: ["localhost:9090"]
- job_name: "Consul_demo"
consul_sd_configs:
- server: "localhost:8500"
relabel_configs:
- action: drop
source_labels: [__meta_consul_service]
regex: consul
- action: labelmap
regex: __meta_consul_service_metadata_(.*)
replacement: consul_$1
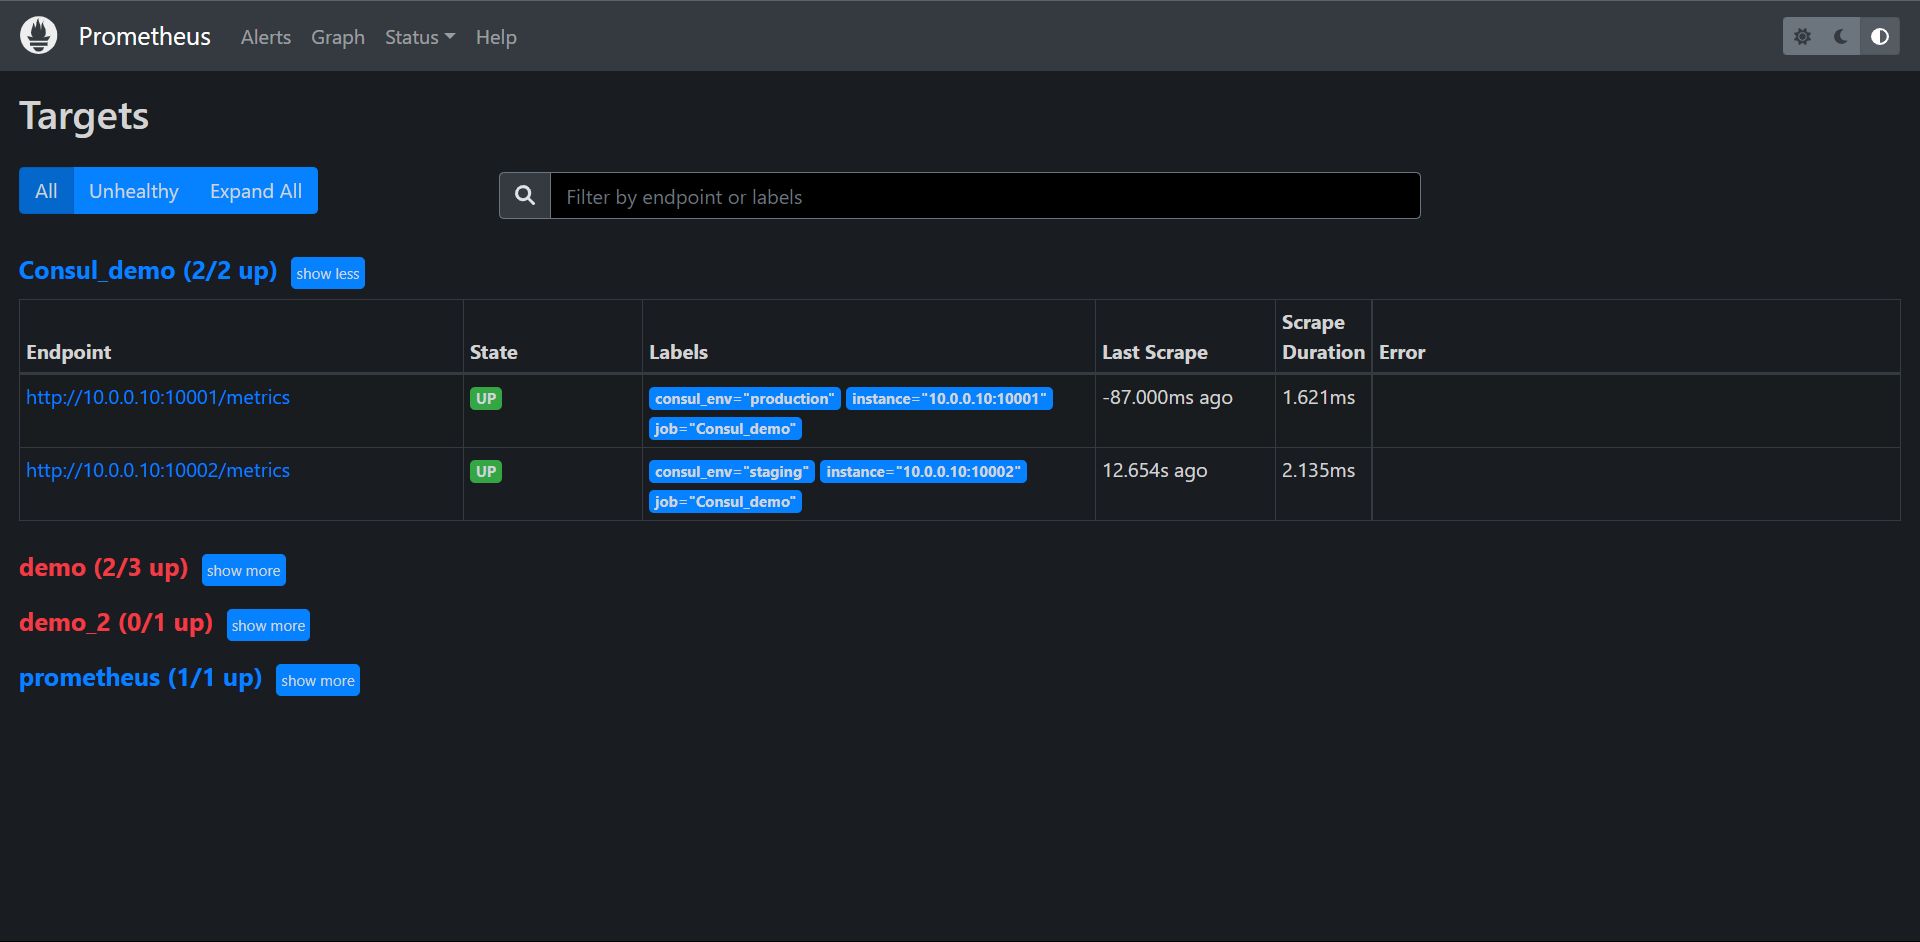
- action: keep
source_labels: [__meta_consul_health]
regex: passing
......
启动Prometheus然后我们down掉10000端口的demo测试
ps -ef | grep prometheus
root 17663 17609 1 Jul18 pts/1 01:45:59 ./prometheus_demo_service --listen-address=:10001
root 17667 17609 1 Jul18 pts/1 01:46:18 ./prometheus_demo_service --listen-address=:10002
root 21724 17609 1 05:56 pts/1 00:00:01 ./prometheus
root 21736 20809 0 05:58 pts/0 00:00:00 grep --color=auto prometheus
[1]+ Killed ./prometheus_demo_service --listen-address=:10000
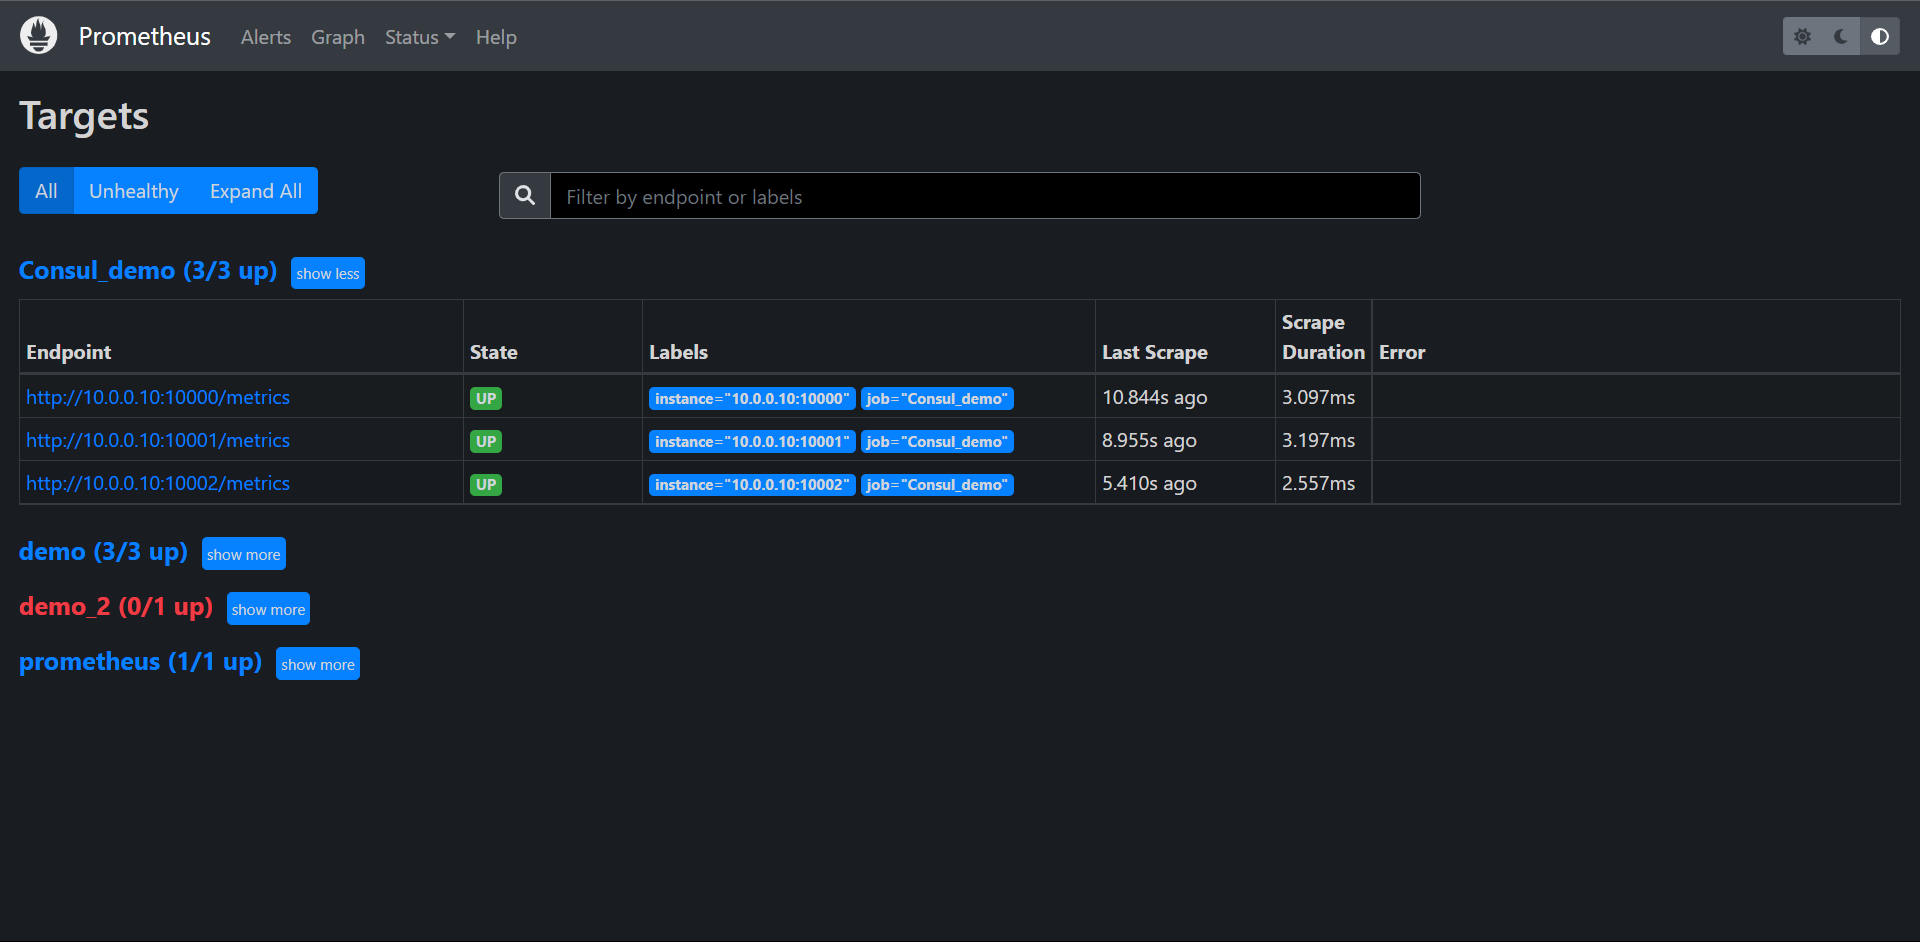
检查Consul和Prometheus
再次启动demo1的服务看一下Prometheus是否会自动加回来

./prometheus_demo_service --listen-address=:10000 &
[1] 21738

ps -ef | grep prometheus
root      17663  17609  1 Jul18 pts/1    01:46:02 ./prometheus_demo_service --listen-address=:10001
root      17667  17609  1 Jul18 pts/1    01:46:20 ./prometheus_demo_service --listen-address=:10002
root      21724  17609  0 05:56 pts/1    00:00:01 ./prometheus
root      21738  20809  1 06:00 pts/0    00:00:00 ./prometheus_demo_service --listen-address=:10000

检查Consul和Prometheus
我们发现它会自动加回来的,这个时候我们就解决了我们不想看到错误的问题了,但是这个问题其实一般生产不会这么用的,因为出现问题肯定是要及时报警而不是眼不见为净,所以这个一般是我们做Demo的时候可能会用到的需要。
12.4:基于文件的服务发现
除了基于Consul的服务发现之外,Prometheus也允许我们进行自定义的发现集成,可以通过watch一组本地文件来抓取目标以及标签信息,也就是我们常说的基于文件的自动发现方式。

基于文件的服务发现提供了一种更通用的方式来配置静态目标,并作为一个接口插入自定义服务发现机制。

它读取一组包含零个或多个<static_config>列表文件,对所有定义的文件的变更通过磁盘监视被检测到立即应用,文件可以以yaml或者json格式提供,文件必须包含一个静态配置列表:

JSON:
[
  {
    "target": [ "<host>", ...],
    "labels": {
      "<labelname>": "<labelvalue>", ...
    }
  },
  ...
]

YAML:
---
- target:
  - "<host>"
  labels:
    "<labelname>": "<labelvalue>"

文件内容也会在指定的刷新间隔时间内定期重新读取

那么它是怎么配置在Prometheus内的呢?我们来看一下!

地址:https://prometheus.io/docs/prometheus/latest/configuration/configuration/#file_sd_config

# Patterns for files from which target groups are extracted.
files:
  [ - <filename_pattern> ... ]

# Refresh interval to re-read the files.
[ refresh_interval: <duration> | default = 5m ]

其中<filename_pattern>可以是一个以.json .yml或者.yaml结尾的路径,最后一个路径段可以包含一个匹配任何字段序列的*,例如:/usr/local/prometheus/config/kubernetes_*.yaml
12.4.1:创建文件
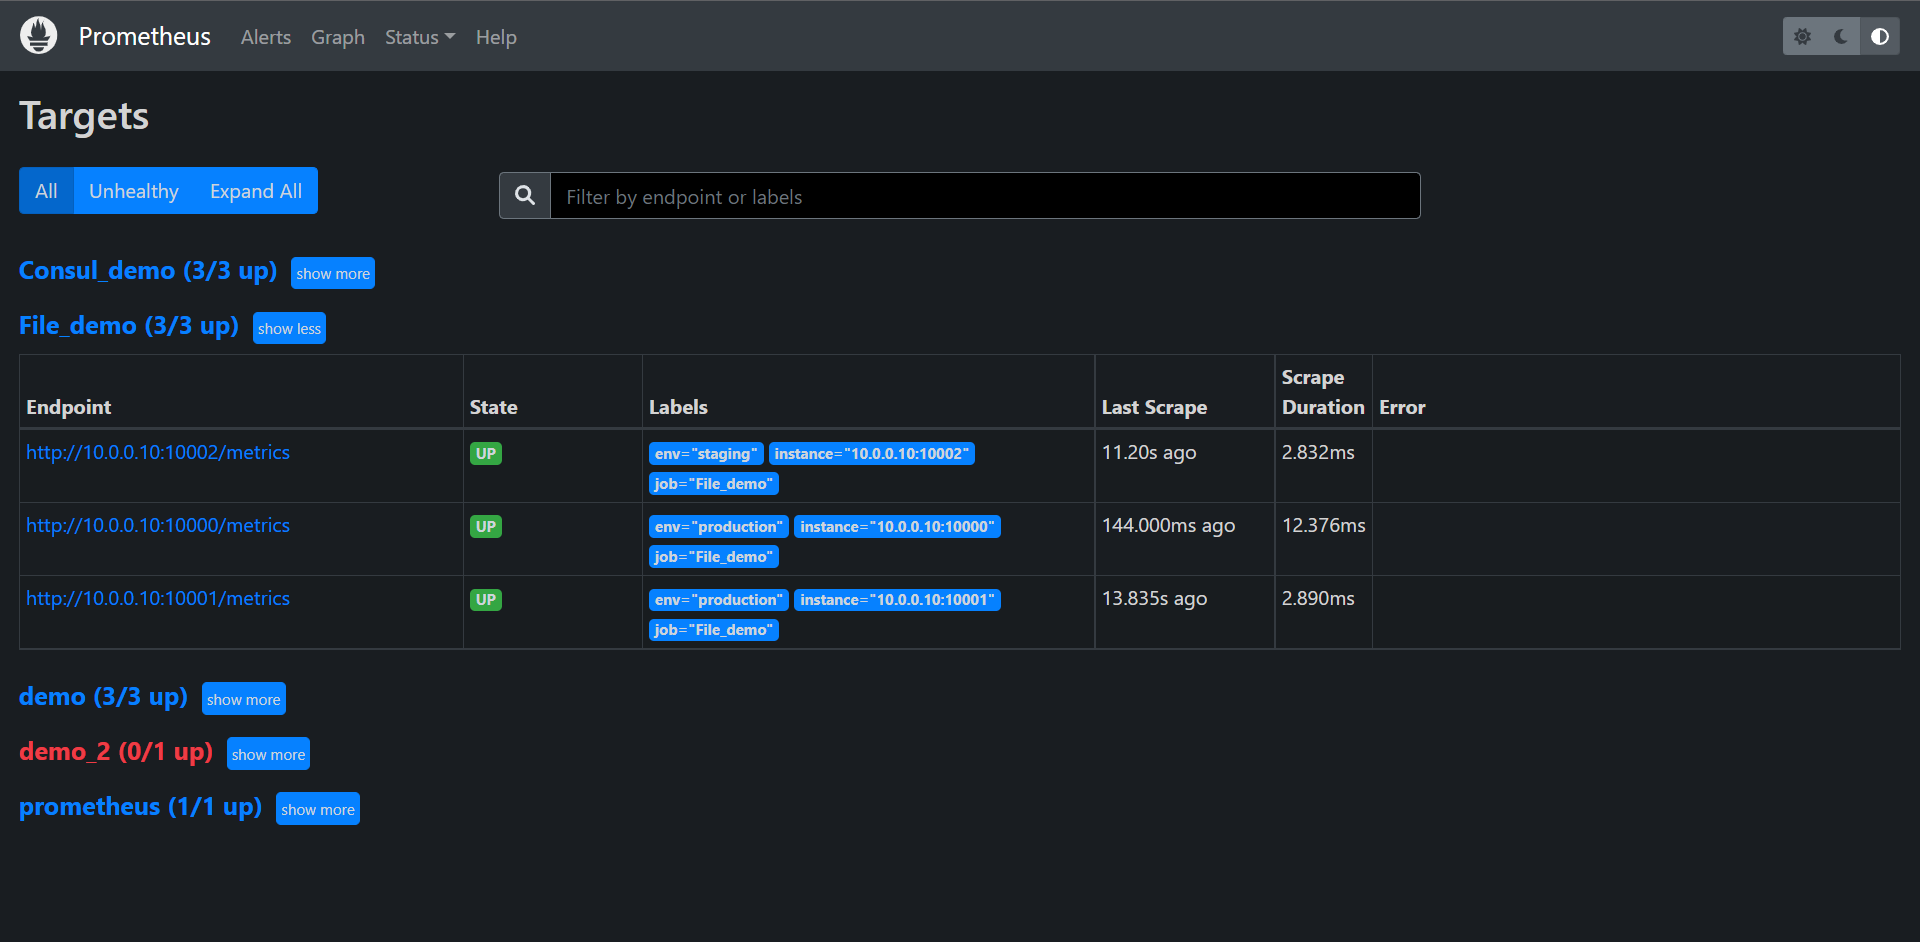
我们来创建一个用于服务发现的目标文件,在与prometheus.yml同目录下创建一个targets.yml的文件,内容如下:

cat targets.yml
- targets:
    - "10.0.0.10:10000"
    - "10.0.0.10:10001"
  labels:
    env: production
- targets:
    - "10.0.0.10:10002"
  labels:
    env: staging

这里我们还是用那三个demo来举例子,给前面两个实例加了env=production的标签,后面一个加上了env=staging的标签,当然了我们也可以用json配置:

[
  {
    "targets": [
      "10.0.0.10:10000",
      "10.0.0.10:10001"
    ],
    "labels": {
      "env": "production"
    }
  },
  {
    "targets": [
      "10.0.0.10:10002"
    ],
    "labels": {
      "env": "staging"
    }
  }
]

推荐一个转换的网站:https://www.bejson.com/json/json2yaml/
12.4.2:配置文件服务发现
用于发现的目标创建完成后,要让Prometheus能够从上面的targets.yml文件内自动读取抓取目标,需要在Prometheus的配置文件内配置一下:

[root@prometheus prometheus]# cat prometheus.yml
global:
  scrape_interval: 15s
  evaluation_interval: 15s


scrape_configs:
  - job_name: "prometheus"
    static_configs:
      - targets: ["localhost:9090"]
  - job_name: "Consul_demo"
    consul_sd_configs:
     - server: "localhost:8500"
    relabel_configs:
     - action: drop
       source_labels: [__meta_consul_service]
       regex: consul
     - action: labelmap
       regex: __meta_consul_service_metadata_(.*)
       replacement: consul_$1
     - action: keep
       source_labels: [__meta_consul_health]
       regex: passing
  - job_name: "File_demo"
    file_sd_configs:
      - files: ["targets.yml"]
......

重启Prometheus
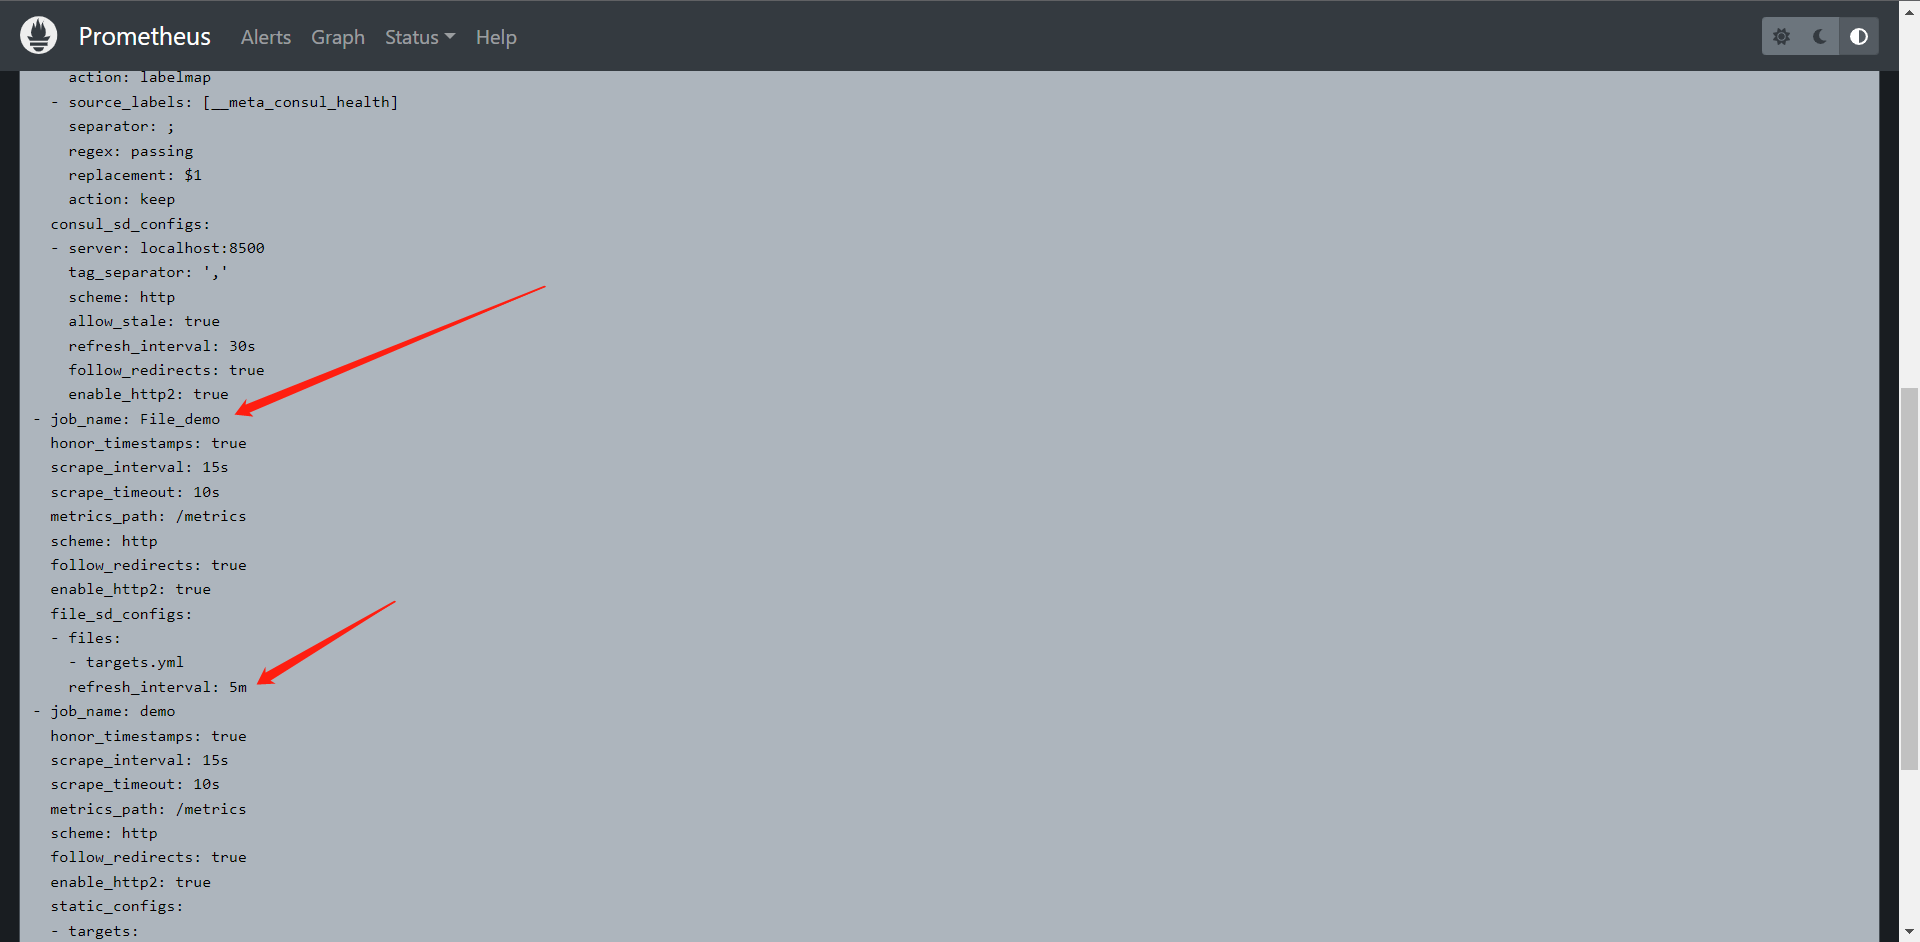
我们可以看到这里它默认帮我们配置了一些东西:

- job_name: File_demo
  honor_timestamps: true
  scrape_interval: 15s
  scrape_timeout: 10s
  metrics_path: /metrics
  scheme: http
  follow_redirects: true
  enable_http2: true
  file_sd_configs:
  - files:
    - targets.yml
    refresh_interval: 5m


这里我们发现它已经读到了我们的文件了并且抓取到监控信息了,那么我们去变更一下targets.yml的配置再来看一下

我们个第二个targets添加一个新的标签:

- targets:
    - "10.0.0.10:10000"
    - "10.0.0.10:10001"
  labels:
    env: production
- targets:
    - "10.0.0.10:10002"
  labels:
    env: staging
    role: sd
我们发现Prometheus立刻就发现了文件的改动就立即同步生效了。这里就对应了我们前面所说的它会watch我们的配置文件。

这样子它能非常的方便的去提供我们动态的随时修改配置而不需要去重启Prometheus就可以生效我们的配置了。

后面我们会讲Kubernetes服务发现,目前我们就讲 Consul和文件的服务发现就到这里了。
13:Exporter
13.1:Exporter介绍
前面我们讲了通过Metrics接口为Prometheus提供监控指标,最好的方式就是直接在目标应用中集成该接口,但是有些应用并没有内置支持metrics接口,比如Linux系统,MySQL,Redis,Kafka等应用,这种情况下我们就可以单独开发一个应用来专门提供metrics服务,这就是我们本节要讲的Exporter,广义上讲所有可以向Prometheus提供监控样数据的程序都可以被称为Exporter,Exporter的一个实例就是我们要监控的Target。
Prometheus社区提供了非常的丰富的Exporter,涵盖了基础设施,中间件以及网络等各个方面的监控实现,当然了社区也会出现很多的其他的Exporter,如果有必要,我们也可以完全g根据自己的需求开发一个Exporter,但是最好以官方的Exporter为最佳实践,我们在后续的内容中也会开发一个合格的Exporter,官方主要提供的Exporter如下:

下载地址:https://prometheus.io/download/
1:数据库:Consul Exporter,Memcached Exporter,MySQL Exporter
2:硬件相关:Node/system metrics exporter
3:HTTP:Haproxy Exporter
4:其他监控系统:AWS CloudWatch Exporter,Colletcd Exporter,Graphite Exporter,InfluxDB Exporter,JMX Exporter,SNMP Exporter,StatsD Exporter,Blackbox Exporter......

由于Exporter是提供监控指标的独立服务,所以我们需要单独的部署该服务来提供指标服务,比如:Node Exporter就需要在操作系统上独立运行来收集系统相关监控数据转换为Prometheus能够识别的metrics接口,接下来主要是给大家介绍几个比较常见的Exporter的使用
13.1.1:Node Exporte
Node Exporter是用于暴露主机指标的Exporter,比如采集CPU,内存,磁盘等信息,因为是采用Go语言编写,不存在第三方依赖问题,所以只需要下载解压即可运行。
13.1.1.1:安装配置
由于Node Exporter是一个独立的二进制程序,可以直接从Prometheus官网下载解压。
# 官方下载
wget https://hub.fastgit.xyz/prometheus/node_exporter/releases/download/v1.3.1/node_exporter-1.3.1.linux-amd64.tar.gz
# 国内加速
wget https://download.fastgit.org/prometheus/node_exporter/releases/download/v1.3.1/node_exporter-1.3.1.linux-amd64.tar.gz
[root@exporter ~]# tar xf node_exporter-1.3.1.linux-amd64.tar.gz
[root@exporter ~]# ls
anaconda-ks.cfg node_exporter-1.3.1.linux-amd64 node_exporter-1.3.1.linux-amd64.tar.gz
[root@exporter ~]# ls node_exporter-1.3.1.linux-amd64
LICENSE node_exporter NOTICE
[root@exporter node_exporter-1.3.1.linux-amd64]# ./node_exporter --version
node_exporter, version 1.3.1 (branch: HEAD, revision: a2321e7b940ddcff26873612bccdf7cd4c42b6b6)
build user: root@243aafa5525c
build date: 20211205-11:09:49
go version: go1.17.3
platform: linux/amd64
它和Prometheus一样可以直接启动。
[root@exporter node_exporter-1.3.1.linux-amd64]# ./node_exporter
ts=2022-07-25T01:47:20.530Z caller=node_exporter.go:182 level=info msg="Starting node_exporter" version="(version=1.3.1, branch=HEAD, revision=a2321e7b940ddcff26873612bccdf7cd4c42b6b6)"
ts=2022-07-25T01:47:20.530Z caller=node_exporter.go:183 level=info msg="Build context" build_context="(go=go1.17.3, user=root@243aafa5525c, date=20211205-11:09:49)"
ts=2022-07-25T01:47:20.530Z caller=node_exporter.go:185 level=warn msg="Node Exporter is running as root user. This exporter is designed to run as unpriviledged user, root is not required."
ts=2022-07-25T01:47:20.535Z caller=filesystem_common.go:111 level=info collector=filesystem msg="Parsed flag --collector.filesystem.mount-points-exclude" flag=^/(dev|proc|run/credentials/.+|sys|var/lib/docker/.+)($|/)
ts=2022-07-25T01:47:20.536Z caller=filesystem_common.go:113 level=info collector=filesystem msg="Parsed flag --collector.filesystem.fs-types-exclude" flag=^(autofs|binfmt_misc|bpf|cgroup2?|configfs|debugfs|devpts|devtmpfs|fusectl|hugetlbfs|iso9660|mqueue|nsfs|overlay|proc|procfs|pstore|rpc_pipefs|securityfs|selinuxfs|squashfs|sysfs|tracefs)$
ts=2022-07-25T01:47:20.536Z caller=node_exporter.go:108 level=info msg="Enabled collectors"
ts=2022-07-25T01:47:20.536Z caller=node_exporter.go:115 level=info collector=arp
ts=2022-07-25T01:47:20.536Z caller=node_exporter.go:115 level=info collector=bcache
ts=2022-07-25T01:47:20.536Z caller=node_exporter.go:115 level=info collector=bonding
ts=2022-07-25T01:47:20.536Z caller=node_exporter.go:115 level=info collector=btrfs
ts=2022-07-25T01:47:20.536Z caller=node_exporter.go:115 level=info collector=conntrack
ts=2022-07-25T01:47:20.536Z caller=node_exporter.go:115 level=info collector=cpu
ts=2022-07-25T01:47:20.536Z caller=node_exporter.go:115 level=info collector=cpufreq
ts=2022-07-25T01:47:20.536Z caller=node_exporter.go:115 level=info collector=diskstats
ts=2022-07-25T01:47:20.536Z caller=node_exporter.go:115 level=info collector=dmi
ts=2022-07-25T01:47:20.536Z caller=node_exporter.go:115 level=info collector=edac
ts=2022-07-25T01:47:20.536Z caller=node_exporter.go:115 level=info collector=entropy
ts=2022-07-25T01:47:20.536Z caller=node_exporter.go:115 level=info collector=fibrechannel
ts=2022-07-25T01:47:20.536Z caller=node_exporter.go:115 level=info collector=filefd
ts=2022-07-25T01:47:20.536Z caller=node_exporter.go:115 level=info collector=filesystem
ts=2022-07-25T01:47:20.536Z caller=node_exporter.go:115 level=info collector=hwmon
ts=2022-07-25T01:47:20.536Z caller=node_exporter.go:115 level=info collector=infiniband
ts=2022-07-25T01:47:20.536Z caller=node_exporter.go:115 level=info collector=ipvs
ts=2022-07-25T01:47:20.536Z caller=node_exporter.go:115 level=info collector=loadavg
ts=2022-07-25T01:47:20.536Z caller=node_exporter.go:115 level=info collector=mdadm
ts=2022-07-25T01:47:20.536Z caller=node_exporter.go:115 level=info collector=meminfo
ts=2022-07-25T01:47:20.536Z caller=node_exporter.go:115 level=info collector=netclass
ts=2022-07-25T01:47:20.536Z caller=node_exporter.go:115 level=info collector=netdev
ts=2022-07-25T01:47:20.536Z caller=node_exporter.go:115 level=info collector=netstat
ts=2022-07-25T01:47:20.536Z caller=node_exporter.go:115 level=info collector=nfs
ts=2022-07-25T01:47:20.536Z caller=node_exporter.go:115 level=info collector=nfsd
ts=2022-07-25T01:47:20.536Z caller=node_exporter.go:115 level=info collector=nvme
ts=2022-07-25T01:47:20.536Z caller=node_exporter.go:115 level=info collector=os
ts=2022-07-25T01:47:20.536Z caller=node_exporter.go:115 level=info collector=powersupplyclass
ts=2022-07-25T01:47:20.536Z caller=node_exporter.go:115 level=info collector=pressure
ts=2022-07-25T01:47:20.536Z caller=node_exporter.go:115 level=info collector=rapl
ts=2022-07-25T01:47:20.536Z caller=node_exporter.go:115 level=info collector=schedstat
ts=2022-07-25T01:47:20.536Z caller=node_exporter.go:115 level=info collector=sockstat
ts=2022-07-25T01:47:20.536Z caller=node_exporter.go:115 level=info collector=softnet
ts=2022-07-25T01:47:20.536Z caller=node_exporter.go:115 level=info collector=stat
ts=2022-07-25T01:47:20.536Z caller=node_exporter.go:115 level=info collector=tapestats
ts=2022-07-25T01:47:20.536Z caller=node_exporter.go:115 level=info collector=textfile
ts=2022-07-25T01:47:20.536Z caller=node_exporter.go:115 level=info collector=thermal_zone
ts=2022-07-25T01:47:20.536Z caller=node_exporter.go:115 level=info collector=time
ts=2022-07-25T01:47:20.536Z caller=node_exporter.go:115 level=info collector=timex
ts=2022-07-25T01:47:20.536Z caller=node_exporter.go:115 level=info collector=udp_queues
ts=2022-07-25T01:47:20.536Z caller=node_exporter.go:115 level=info collector=uname
ts=2022-07-25T01:47:20.536Z caller=node_exporter.go:115 level=info collector=vmstat
ts=2022-07-25T01:47:20.536Z caller=node_exporter.go:115 level=info collector=xfs
ts=2022-07-25T01:47:20.536Z caller=node_exporter.go:115 level=info collector=zfs
ts=2022-07-25T01:47:20.536Z caller=node_exporter.go:199 level=info msg="Listening on" address=:9100
ts=2022-07-25T01:47:20.538Z caller=tls_config.go:195 level=info msg="TLS is disabled." http2=false
可以看到运行起来我们可以看到启动了很多默认的采集器,包括最后的一个监听端口,然后我们测试访问一下
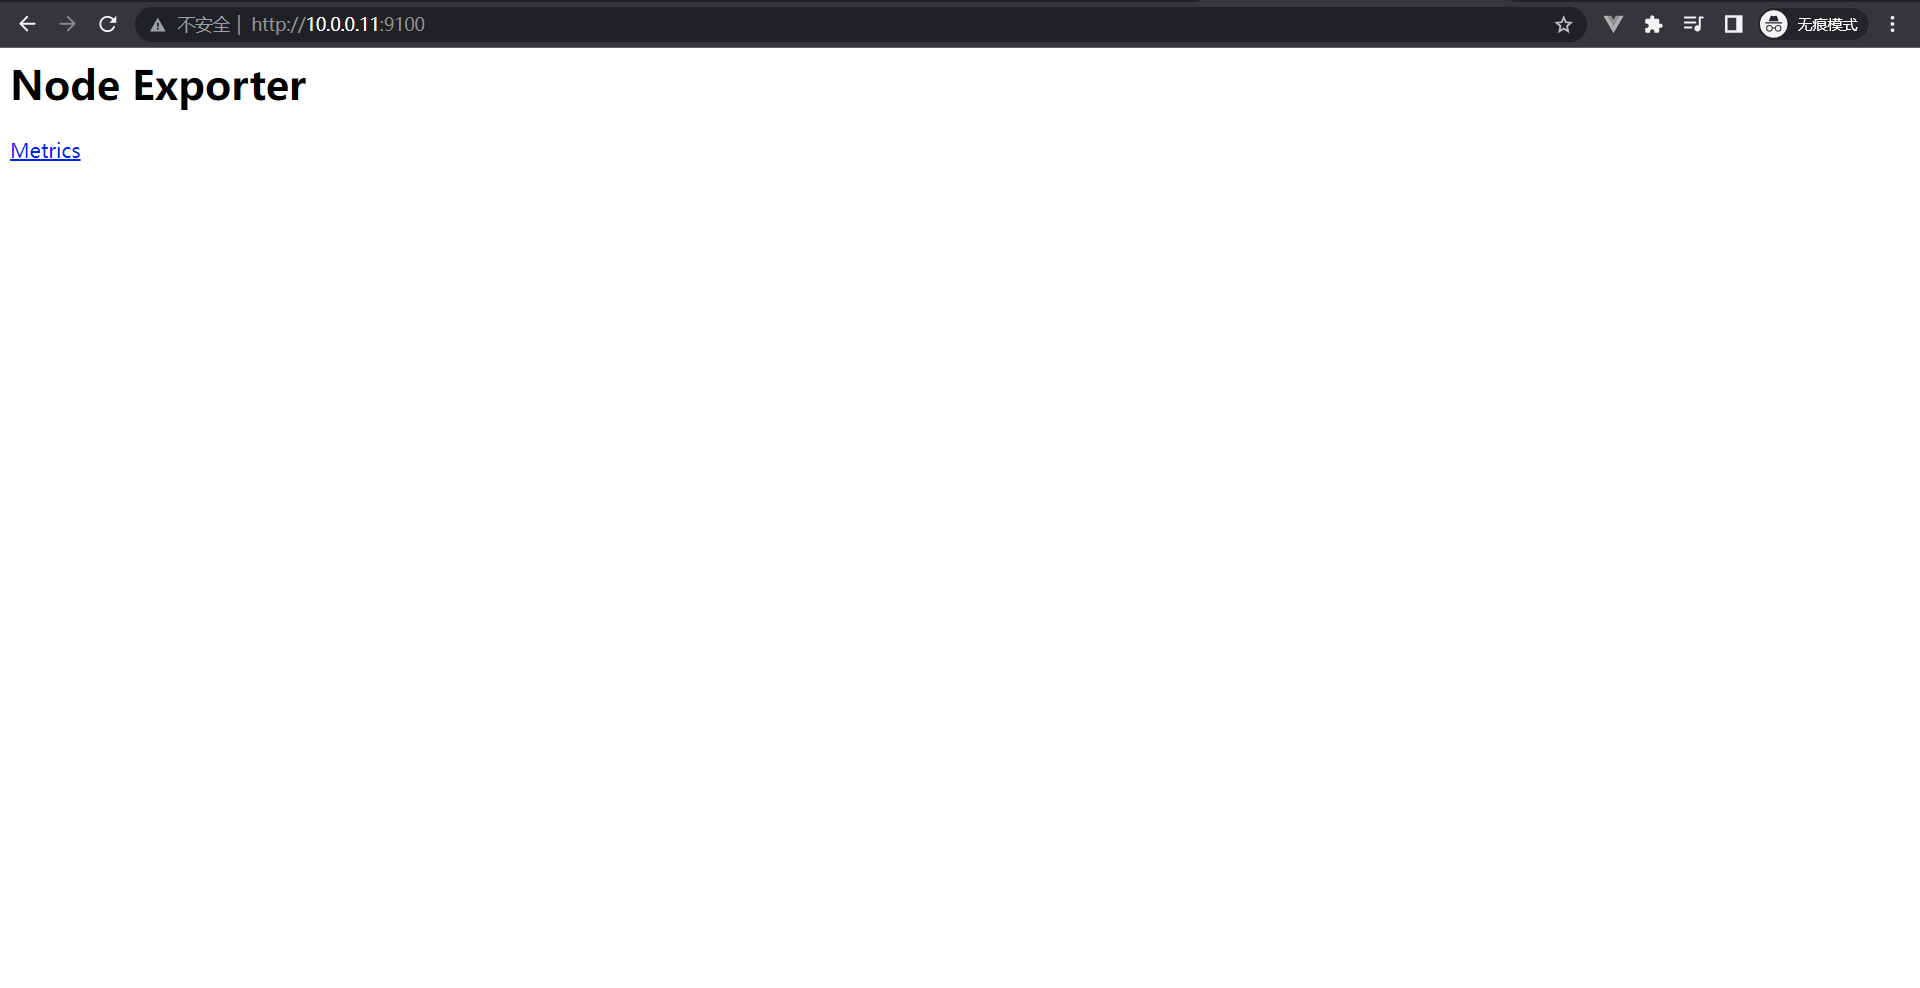
[root@prometheus prometheus]# curl 10.0.0.11:9100
<html>
<head><title>Node Exporter</title></head>
<body>
<h1>Node Exporter</h1>
<p><a href="/metrics">Metrics</a></p>
</body>
</html>
可以看到它告诉我们需要去访问/metrics路径才会有数据这里我就浏览器访问一下看看。
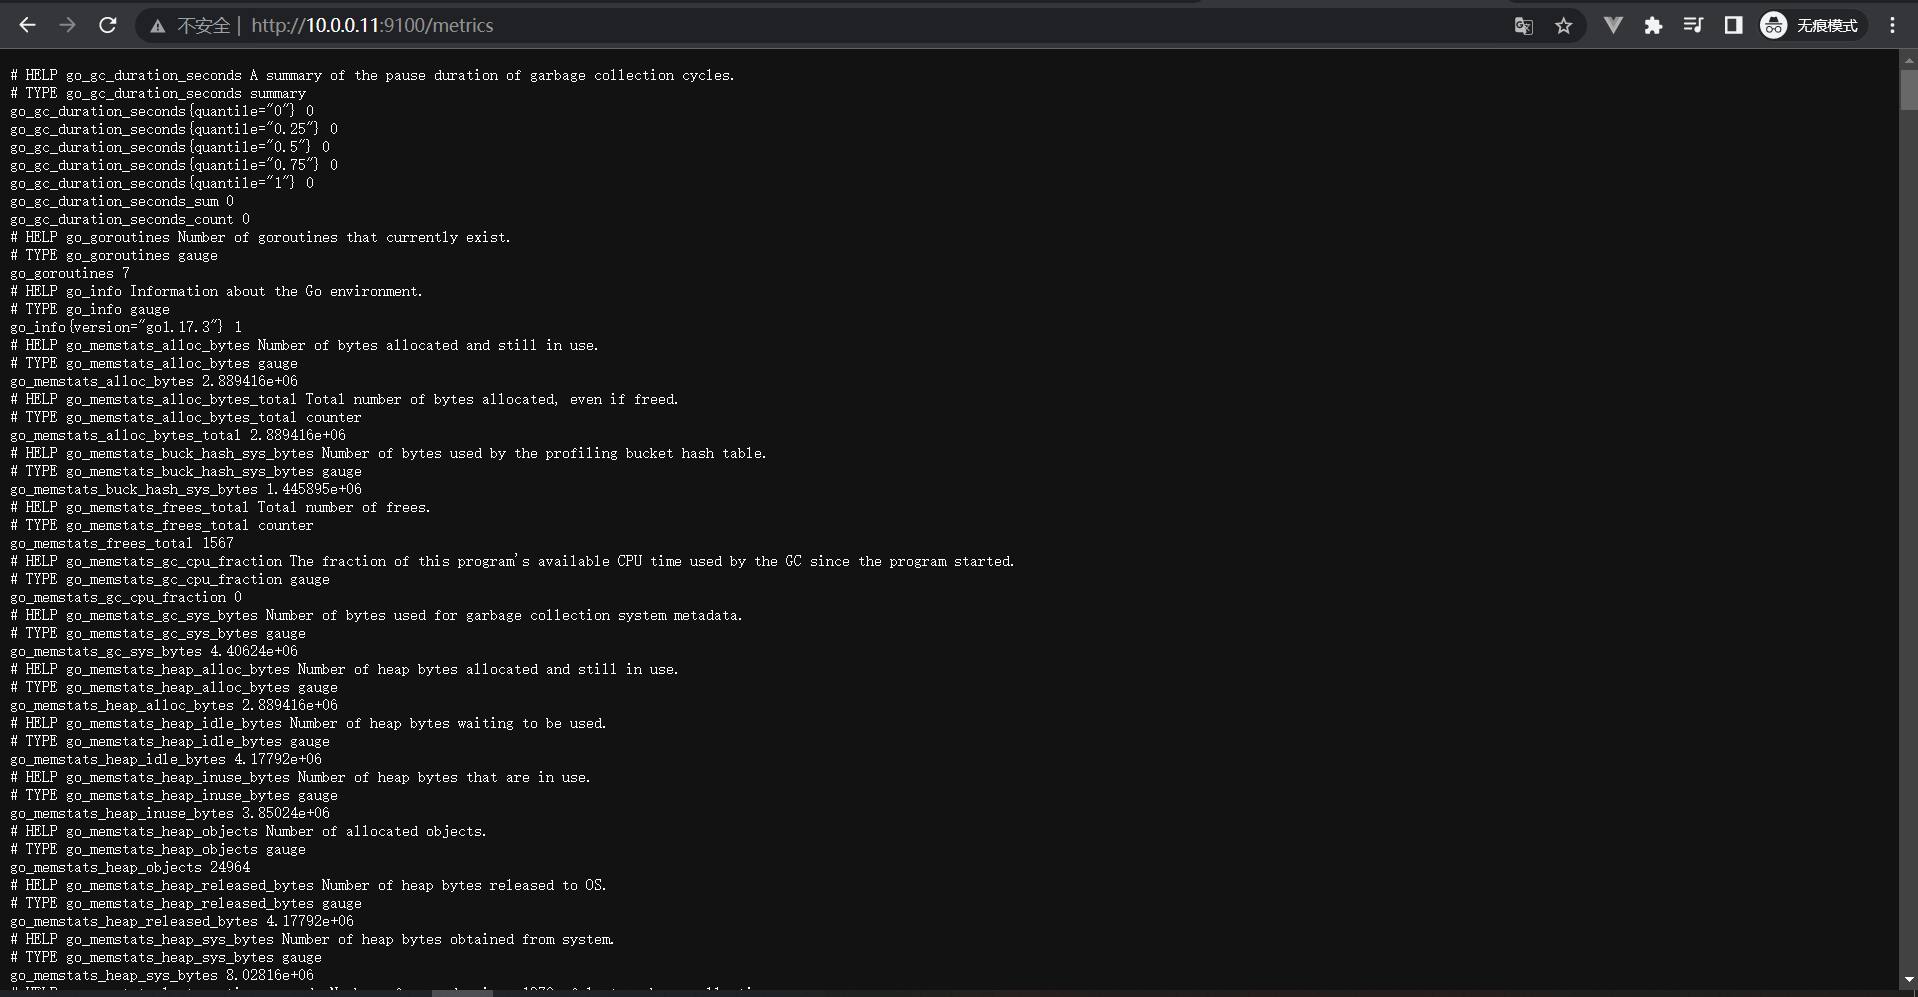
在这里我们就看到我们熟悉的数据啦,但是我们其实还有很多关于exporter有很多可配置的地方,我们可以-h来看一下

[root@exporter node_exporter-1.3.1.linux-amd64]# ./node_exporter -h
usage: node_exporter [<flags>]

Flags:
  -h, --help                     Show context-sensitive help (also try --help-long and --help-man).
      --collector.bcache.priorityStats
                                 Expose expensive priority stats.
      --collector.cpu.guest      Enables metric node_cpu_guest_seconds_total
      --collector.cpu.info       Enables metric cpu_info
      --collector.cpu.info.flags-include=COLLECTOR.CPU.INFO.FLAGS-INCLUDE
                                 Filter the `flags` field in cpuInfo with a value that must be a regular expression
      --collector.cpu.info.bugs-include=COLLECTOR.CPU.INFO.BUGS-INCLUDE
                                 Filter the `bugs` field in cpuInfo with a value that must be a regular expression
      --collector.diskstats.ignored-devices="^(ram|loop|fd|(h|s|v|xv)d[a-z]|nvme\\d+n\\d+p)\\d+$"
                                 Regexp of devices to ignore for diskstats.
      --collector.ethtool.device-include=COLLECTOR.ETHTOOL.DEVICE-INCLUDE
                                 Regexp of ethtool devices to include (mutually exclusive to device-exclude).
      --collector.ethtool.device-exclude=COLLECTOR.ETHTOOL.DEVICE-EXCLUDE
                                 Regexp of ethtool devices to exclude (mutually exclusive to device-include).
      --collector.ethtool.metrics-include=".*"
                                 Regexp of ethtool stats to include.
      --collector.filesystem.mount-points-exclude="^/(dev|proc|run/credentials/.+|sys|var/lib/docker/.+)($|/)"
                                 Regexp of mount points to exclude for filesystem collector.
      --collector.filesystem.fs-types-exclude="^(autofs|binfmt_misc|bpf|cgroup2?|configfs|debugfs|devpts|devtmpfs|fusectl|hugetlbfs|iso9660|mqueue|nsfs|overlay|proc|procfs|pstore|rpc_pipefs|securityfs|selinuxfs|squashfs|sysfs|tracefs)$"
                                 Regexp of filesystem types to exclude for filesystem collector.
      --collector.ipvs.backend-labels="local_address,local_port,remote_address,remote_port,proto,local_mark"
                                 Comma separated list for IPVS backend stats labels.
      --collector.netclass.ignored-devices="^$"
                                 Regexp of net devices to ignore for netclass collector.
      --collector.netclass.ignore-invalid-speed
                                 Ignore devices where the speed is invalid. This will be the default behavior in 2.x.
      --collector.netdev.device-include=COLLECTOR.NETDEV.DEVICE-INCLUDE
                                 Regexp of net devices to include (mutually exclusive to device-exclude).
      --collector.netdev.device-exclude=COLLECTOR.NETDEV.DEVICE-EXCLUDE
                                 Regexp of net devices to exclude (mutually exclusive to device-include).
      --collector.netdev.address-info
                                 Collect address-info for every device
      --collector.netstat.fields="^(.*_(InErrors|InErrs)|Ip_Forwarding|Ip(6|Ext)_(InOctets|OutOctets)|Icmp6?_(InMsgs|OutMsgs)|TcpExt_(Listen.*|Syncookies.*|TCPSynRetrans|TCPTimeouts)|Tcp_(ActiveOpens|InSegs|OutSegs|OutRsts|PassiveOpens|RetransSegs|CurrEstab)|Udp6?_(InDatagrams|OutDatagrams|NoPorts|RcvbufErrors|SndbufErrors))$"
                                 Regexp of fields to return for netstat collector.
      --collector.ntp.server="127.0.0.1"
                                 NTP server to use for ntp collector
      --collector.ntp.protocol-version=4
                                 NTP protocol version
      --collector.ntp.server-is-local
                                 Certify that collector.ntp.server address is not a public ntp server
      --collector.ntp.ip-ttl=1   IP TTL to use while sending NTP query
      --collector.ntp.max-distance=3.46608s
                                 Max accumulated distance to the root
      --collector.ntp.local-offset-tolerance=1ms
                                 Offset between local clock and local ntpd time to tolerate
      --path.procfs="/proc"      procfs mountpoint.
      --path.sysfs="/sys"        sysfs mountpoint.
      --path.rootfs="/"          rootfs mountpoint.
      --collector.perf.cpus=""   List of CPUs from which perf metrics should be collected
      --collector.perf.tracepoint=COLLECTOR.PERF.TRACEPOINT ...
                                 perf tracepoint that should be collected
      --collector.powersupply.ignored-supplies="^$"
                                 Regexp of power supplies to ignore for powersupplyclass collector.
      --collector.qdisc.fixtures=""
                                 test fixtures to use for qdisc collector end-to-end testing
      --collector.runit.servicedir="/etc/service"
                                 Path to runit service directory.
      --collector.supervisord.url="http://localhost:9001/RPC2"
                                 XML RPC endpoint.
      --collector.systemd.unit-include=".+"
                                 Regexp of systemd units to include. Units must both match include and not match exclude to be included.
      --collector.systemd.unit-exclude=".+\\.(automount|device|mount|scope|slice)"
                                 Regexp of systemd units to exclude. Units must both match include and not match exclude to be included.
      --collector.systemd.enable-task-metrics
                                 Enables service unit tasks metrics unit_tasks_current and unit_tasks_max
      --collector.systemd.enable-restarts-metrics
                                 Enables service unit metric service_restart_total
      --collector.systemd.enable-start-time-metrics
                                 Enables service unit metric unit_start_time_seconds
      --collector.tapestats.ignored-devices="^$"
                                 Regexp of devices to ignore for tapestats.
      --collector.textfile.directory=""
                                 Directory to read text files with metrics from.
      --collector.vmstat.fields="^(oom_kill|pgpg|pswp|pg.*fault).*"
                                 Regexp of fields to return for vmstat collector.
      --collector.wifi.fixtures=""
                                 test fixtures to use for wifi collector metrics
      --collector.arp            Enable the arp collector (default: enabled).
      --collector.bcache         Enable the bcache collector (default: enabled).
      --collector.bonding        Enable the bonding collector (default: enabled).
      --collector.btrfs          Enable the btrfs collector (default: enabled).
      --collector.buddyinfo      Enable the buddyinfo collector (default: disabled).
      --collector.conntrack      Enable the conntrack collector (default: enabled).
      --collector.cpu            Enable the cpu collector (default: enabled).
      --collector.cpufreq        Enable the cpufreq collector (default: enabled).
      --collector.diskstats      Enable the diskstats collector (default: enabled).
      --collector.dmi            Enable the dmi collector (default: enabled).
      --collector.drbd           Enable the drbd collector (default: disabled).
      --collector.drm            Enable the drm collector (default: disabled).
      --collector.edac           Enable the edac collector (default: enabled).
      --collector.entropy        Enable the entropy collector (default: enabled).
      --collector.ethtool        Enable the ethtool collector (default: disabled).
      --collector.fibrechannel   Enable the fibrechannel collector (default: enabled).
      --collector.filefd         Enable the filefd collector (default: enabled).
      --collector.filesystem     Enable the filesystem collector (default: enabled).
      --collector.hwmon          Enable the hwmon collector (default: enabled).
      --collector.infiniband     Enable the infiniband collector (default: enabled).
      --collector.interrupts     Enable the interrupts collector (default: disabled).
      --collector.ipvs           Enable the ipvs collector (default: enabled).
      --collector.ksmd           Enable the ksmd collector (default: disabled).
      --collector.lnstat         Enable the lnstat collector (default: disabled).
      --collector.loadavg        Enable the loadavg collector (default: enabled).
      --collector.logind         Enable the logind collector (default: disabled).
      --collector.mdadm          Enable the mdadm collector (default: enabled).
      --collector.meminfo        Enable the meminfo collector (default: enabled).
      --collector.meminfo_numa   Enable the meminfo_numa collector (default: disabled).
      --collector.mountstats     Enable the mountstats collector (default: disabled).
      --collector.netclass       Enable the netclass collector (default: enabled).
      --collector.netdev         Enable the netdev collector (default: enabled).
      --collector.netstat        Enable the netstat collector (default: enabled).
      --collector.network_route  Enable the network_route collector (default: disabled).
      --collector.nfs            Enable the nfs collector (default: enabled).
      --collector.nfsd           Enable the nfsd collector (default: enabled).
      --collector.ntp            Enable the ntp collector (default: disabled).
      --collector.nvme           Enable the nvme collector (default: enabled).
      --collector.os             Enable the os collector (default: enabled).
      --collector.perf           Enable the perf collector (default: disabled).
      --collector.powersupplyclass
                                 Enable the powersupplyclass collector (default: enabled).
      --collector.pressure       Enable the pressure collector (default: enabled).
      --collector.processes      Enable the processes collector (default: disabled).
      --collector.qdisc          Enable the qdisc collector (default: disabled).
      --collector.rapl           Enable the rapl collector (default: enabled).
      --collector.runit          Enable the runit collector (default: disabled).
      --collector.schedstat      Enable the schedstat collector (default: enabled).
      --collector.sockstat       Enable the sockstat collector (default: enabled).
      --collector.softnet        Enable the softnet collector (default: enabled).
      --collector.stat           Enable the stat collector (default: enabled).
      --collector.supervisord    Enable the supervisord collector (default: disabled).
      --collector.systemd        Enable the systemd collector (default: disabled).
      --collector.tapestats      Enable the tapestats collector (default: enabled).
      --collector.tcpstat        Enable the tcpstat collector (default: disabled).
      --collector.textfile       Enable the textfile collector (default: enabled).
      --collector.thermal_zone   Enable the thermal_zone collector (default: enabled).
      --collector.time           Enable the time collector (default: enabled).
      --collector.timex          Enable the timex collector (default: enabled).
      --collector.udp_queues     Enable the udp_queues collector (default: enabled).
      --collector.uname          Enable the uname collector (default: enabled).
      --collector.vmstat         Enable the vmstat collector (default: enabled).
      --collector.wifi           Enable the wifi collector (default: disabled).
      --collector.xfs            Enable the xfs collector (default: enabled).
      --collector.zfs            Enable the zfs collector (default: enabled).
      --collector.zoneinfo       Enable the zoneinfo collector (default: disabled).
      --web.listen-address=":9100"
                                 Address on which to expose metrics and web interface.
      --web.telemetry-path="/metrics"
                                 Path under which to expose metrics.
      --web.disable-exporter-metrics
                                 Exclude metrics about the exporter itself (promhttp_*, process_*, go_*).
      --web.max-requests=40      Maximum number of parallel scrape requests. Use 0 to disable.
      --collector.disable-defaults
                                 Set all collectors to disabled by default.
      --web.config=""            [EXPERIMENTAL] Path to config yaml file that can enable TLS or authentication.
      --log.level=info           Only log messages with the given severity or above. One of: [debug, info, warn, error]
      --log.format=logfmt        Output format of log messages. One of: [logfmt, json]
      --version                  Show application version.


比如我们想禁用一个收集比如arp

[root@exporter node_exporter-1.3.1.linux-amd64]# ./node_exporter --no-collector.arp

这样关于ARP的收集器就被关闭了

[root@exporter node_exporter-1.3.1.linux-amd64]# ./node_exporter --no-collector.arp
ts=2022-07-25T01:58:08.617Z caller=node_exporter.go:182 level=info msg="Starting node_exporter" version="(version=1.3.1, branch=HEAD, revision=a2321e7b940ddcff26873612bccdf7cd4c42b6b6)"
ts=2022-07-25T01:58:08.618Z caller=node_exporter.go:183 level=info msg="Build context" build_context="(go=go1.17.3, user=root@243aafa5525c, date=20211205-11:09:49)"
ts=2022-07-25T01:58:08.618Z caller=node_exporter.go:185 level=warn msg="Node Exporter is running as root user. This exporter is designed to run as unpriviledged user, root is not required."
ts=2022-07-25T01:58:08.618Z caller=filesystem_common.go:111 level=info collector=filesystem msg="Parsed flag --collector.filesystem.mount-points-exclude" flag=^/(dev|proc|run/credentials/.+|sys|var/lib/docker/.+)($|/)
ts=2022-07-25T01:58:08.618Z caller=filesystem_common.go:113 level=info collector=filesystem msg="Parsed flag --collector.filesystem.fs-types-exclude" flag=^(autofs|binfmt_misc|bpf|cgroup2?|configfs|debugfs|devpts|devtmpfs|fusectl|hugetlbfs|iso9660|mqueue|nsfs|overlay|proc|procfs|pstore|rpc_pipefs|securityfs|selinuxfs|squashfs|sysfs|tracefs)$
ts=2022-07-25T01:58:08.619Z caller=node_exporter.go:108 level=info msg="Enabled collectors"
ts=2022-07-25T01:58:08.619Z caller=node_exporter.go:115 level=info collector=bcache
ts=2022-07-25T01:58:08.619Z caller=node_exporter.go:115 level=info collector=bonding
ts=2022-07-25T01:58:08.619Z caller=node_exporter.go:115 level=info collector=btrfs
ts=2022-07-25T01:58:08.619Z caller=node_exporter.go:115 level=info collector=conntrack
ts=2022-07-25T01:58:08.619Z caller=node_exporter.go:115 level=info collector=cpu
ts=2022-07-25T01:58:08.619Z caller=node_exporter.go:115 level=info collector=cpufreq
ts=2022-07-25T01:58:08.619Z caller=node_exporter.go:115 level=info collector=diskstats
ts=2022-07-25T01:58:08.619Z caller=node_exporter.go:115 level=info collector=dmi
ts=2022-07-25T01:58:08.619Z caller=node_exporter.go:115 level=info collector=edac
ts=2022-07-25T01:58:08.619Z caller=node_exporter.go:115 level=info collector=entropy
ts=2022-07-25T01:58:08.619Z caller=node_exporter.go:115 level=info collector=fibrechannel
ts=2022-07-25T01:58:08.619Z caller=node_exporter.go:115 level=info collector=filefd
ts=2022-07-25T01:58:08.619Z caller=node_exporter.go:115 level=info collector=filesystem
ts=2022-07-25T01:58:08.619Z caller=node_exporter.go:115 level=info collector=hwmon
ts=2022-07-25T01:58:08.619Z caller=node_exporter.go:115 level=info collector=infiniband
ts=2022-07-25T01:58:08.619Z caller=node_exporter.go:115 level=info collector=ipvs
ts=2022-07-25T01:58:08.619Z caller=node_exporter.go:115 level=info collector=loadavg
ts=2022-07-25T01:58:08.619Z caller=node_exporter.go:115 level=info collector=mdadm
ts=2022-07-25T01:58:08.619Z caller=node_exporter.go:115 level=info collector=meminfo
ts=2022-07-25T01:58:08.619Z caller=node_exporter.go:115 level=info collector=netclass
ts=2022-07-25T01:58:08.619Z caller=node_exporter.go:115 level=info collector=netdev
ts=2022-07-25T01:58:08.619Z caller=node_exporter.go:115 level=info collector=netstat
ts=2022-07-25T01:58:08.619Z caller=node_exporter.go:115 level=info collector=nfs
ts=2022-07-25T01:58:08.619Z caller=node_exporter.go:115 level=info collector=nfsd
ts=2022-07-25T01:58:08.619Z caller=node_exporter.go:115 level=info collector=nvme
ts=2022-07-25T01:58:08.619Z caller=node_exporter.go:115 level=info collector=os
ts=2022-07-25T01:58:08.619Z caller=node_exporter.go:115 level=info collector=powersupplyclass
ts=2022-07-25T01:58:08.619Z caller=node_exporter.go:115 level=info collector=pressure
ts=2022-07-25T01:58:08.619Z caller=node_exporter.go:115 level=info collector=rapl
ts=2022-07-25T01:58:08.619Z caller=node_exporter.go:115 level=info collector=schedstat
ts=2022-07-25T01:58:08.619Z caller=node_exporter.go:115 level=info collector=sockstat
ts=2022-07-25T01:58:08.619Z caller=node_exporter.go:115 level=info collector=softnet
ts=2022-07-25T01:58:08.619Z caller=node_exporter.go:115 level=info collector=stat
ts=2022-07-25T01:58:08.619Z caller=node_exporter.go:115 level=info collector=tapestats
ts=2022-07-25T01:58:08.619Z caller=node_exporter.go:115 level=info collector=textfile
ts=2022-07-25T01:58:08.619Z caller=node_exporter.go:115 level=info collector=thermal_zone
ts=2022-07-25T01:58:08.619Z caller=node_exporter.go:115 level=info collector=time
ts=2022-07-25T01:58:08.619Z caller=node_exporter.go:115 level=info collector=timex
ts=2022-07-25T01:58:08.619Z caller=node_exporter.go:115 level=info collector=udp_queues
ts=2022-07-25T01:58:08.619Z caller=node_exporter.go:115 level=info collector=uname
ts=2022-07-25T01:58:08.619Z caller=node_exporter.go:115 level=info collector=vmstat
ts=2022-07-25T01:58:08.619Z caller=node_exporter.go:115 level=info collector=xfs
ts=2022-07-25T01:58:08.619Z caller=node_exporter.go:115 level=info collector=zfs
ts=2022-07-25T01:58:08.619Z caller=node_exporter.go:199 level=info msg="Listening on" address=:9100
ts=2022-07-25T01:58:08.620Z caller=tls_config.go:195 level=info msg="TLS is disabled." http2=false


那如果有人说我只想启动其中的某一个或者几个功能怎么办呢?当然了它也有解决方法

[root@exporter node_exporter-1.3.1.linux-amd64]# ./node_exporter --collector.disable-defaults --collector.cpu
ts=2022-07-25T02:01:15.971Z caller=node_exporter.go:182 level=info msg="Starting node_exporter" version="(version=1.3.1, branch=HEAD, revision=a2321e7b940ddcff26873612bccdf7cd4c42b6b6)"
ts=2022-07-25T02:01:15.971Z caller=node_exporter.go:183 level=info msg="Build context" build_context="(go=go1.17.3, user=root@243aafa5525c, date=20211205-11:09:49)"
ts=2022-07-25T02:01:15.971Z caller=node_exporter.go:185 level=warn msg="Node Exporter is running as root user. This exporter is designed to run as unpriviledged user, root is not required."
ts=2022-07-25T02:01:15.972Z caller=node_exporter.go:108 level=info msg="Enabled collectors"
ts=2022-07-25T02:01:15.972Z caller=node_exporter.go:115 level=info collector=cpu
ts=2022-07-25T02:01:15.972Z caller=node_exporter.go:199 level=info msg="Listening on" address=:9100
ts=2022-07-25T02:01:15.972Z caller=tls_config.go:195 level=info msg="TLS is disabled." http2=false


解释:--collector.disable-defaults    # 默认禁用所有的采集器
     --collector.cpu    # 只开启CPU的采集器

关于参数匹配的系统我们可以去它的Github查看:https://github.com/prometheus/node_exporter
13.1.1.2:配置Exporter
我们完全可以使用一个容器来管理Docker,我们需要映射一些东西并要开启很多的权限,然而我们常用的还是systemd来管理它,接下来我们使用systemd来配置一下

# 移动Exporter
[root@exporter node_exporter-1.3.1.linux-amd64]# mv node_exporter /usr/local/bin/

# 编写systemd管理进程
[root@exporter ~]# cat /etc/systemd/system/node_exporter.service
[Unit]
Description=node exporter servoce
Documentation=https://prometheus.io
After=network.target

[Service]
Type=simple
User=root
Group=root
ExecStart=/usr/local/bin/node_exporter
Restart=on-failure

[Install]
WantedBy=multi-user.target

# 启动exporter
[root@exporter ~]# systemctl start node_exporter.service
[root@exporter ~]# systemctl status node_exporter.service
● node_exporter.service - node exporter servoce
   Loaded: loaded (/etc/systemd/system/node_exporter.service; disabled; vendor preset: disabled)
   Active: active (running) since Mon 2022-07-25 15:57:17 CST; 8s ago
     Docs: https://prometheus.io
 Main PID: 22425 (node_exporter)
    Tasks: 3
   Memory: 6.5M
   CGroup: /system.slice/node_exporter.service
           └─22425 /usr/local/bin/node_exporter

[root@exporter ~]# netstat -nplt | grep exporter
tcp6       0      0 :::9100                 :::*                    LISTEN      22425/node_exporter

# 设置开机自启
[root@exporter ~]# systemctl enable node_exporter.service

# 配置Prometheus
[root@prometheus prometheus]# cat prometheus.yml
global:
  scrape_interval: 15s
  evaluation_interval: 15s


scrape_configs:
  - job_name: "prometheus"
    static_configs:
      - targets: ["localhost:9090"]

  - job_name: "node_exporter"
    static_configs:
      - targets: ["localhost:9100","10.0.0.11:9100"]


重启Prometheus
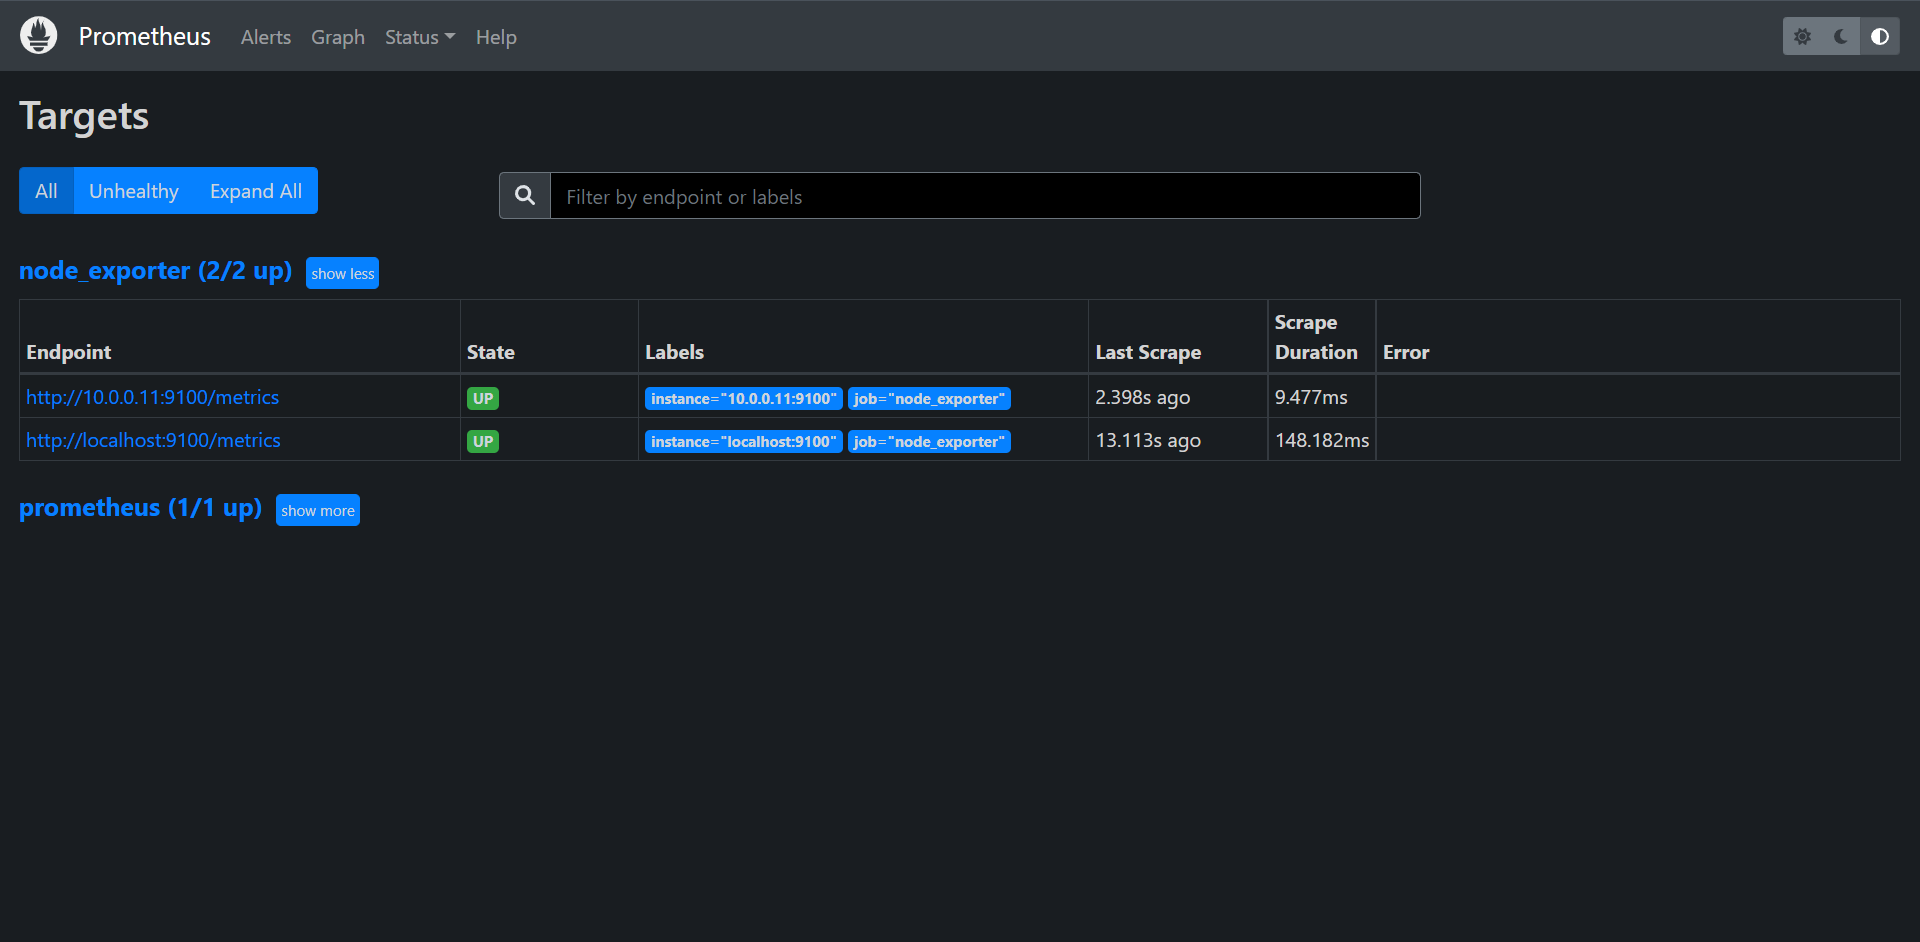
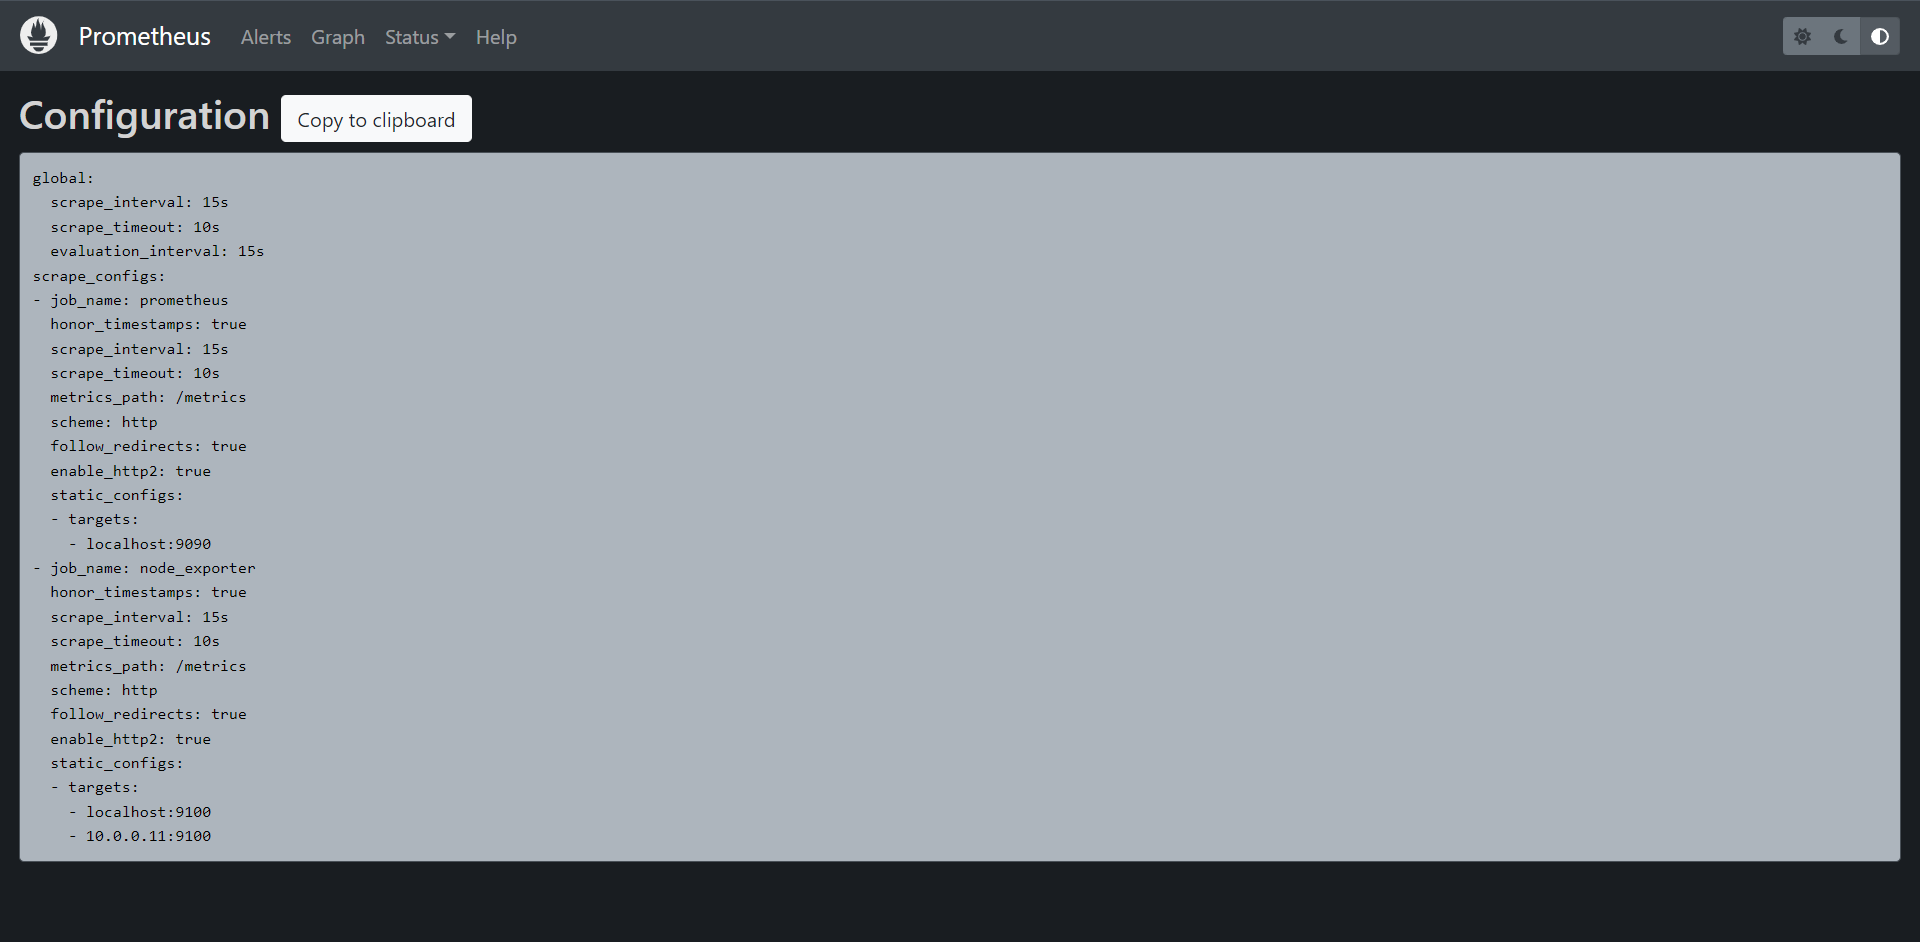
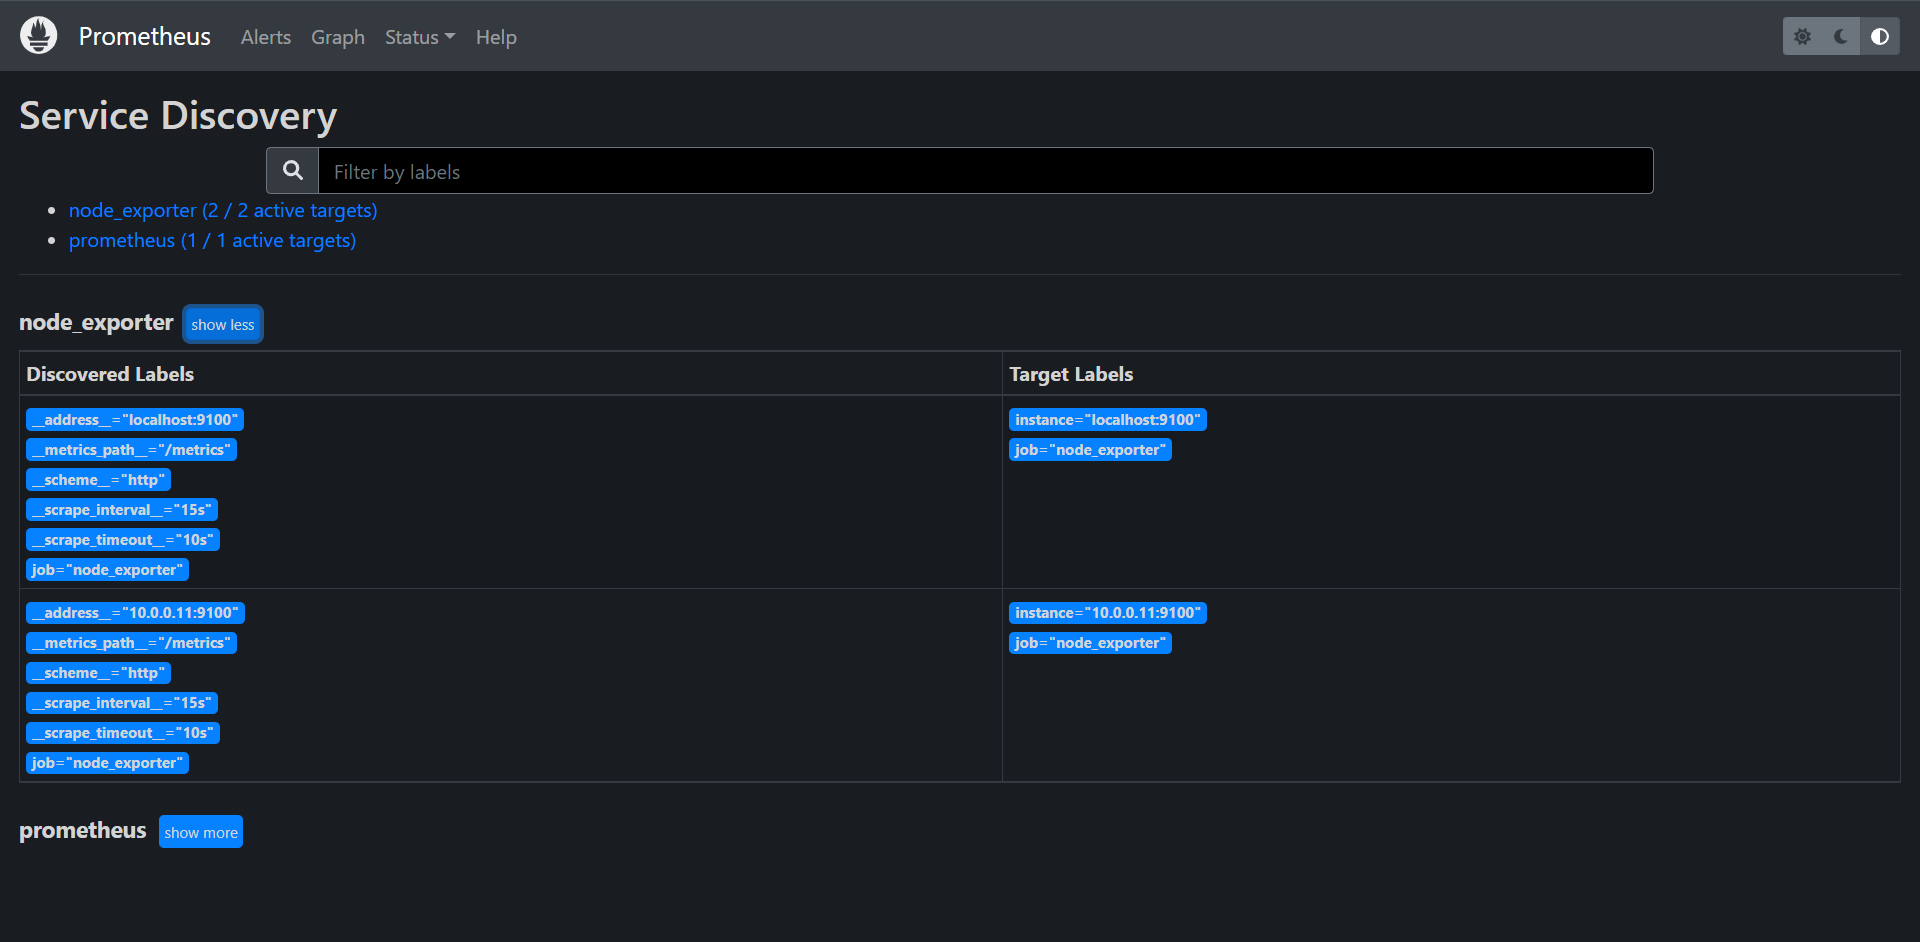
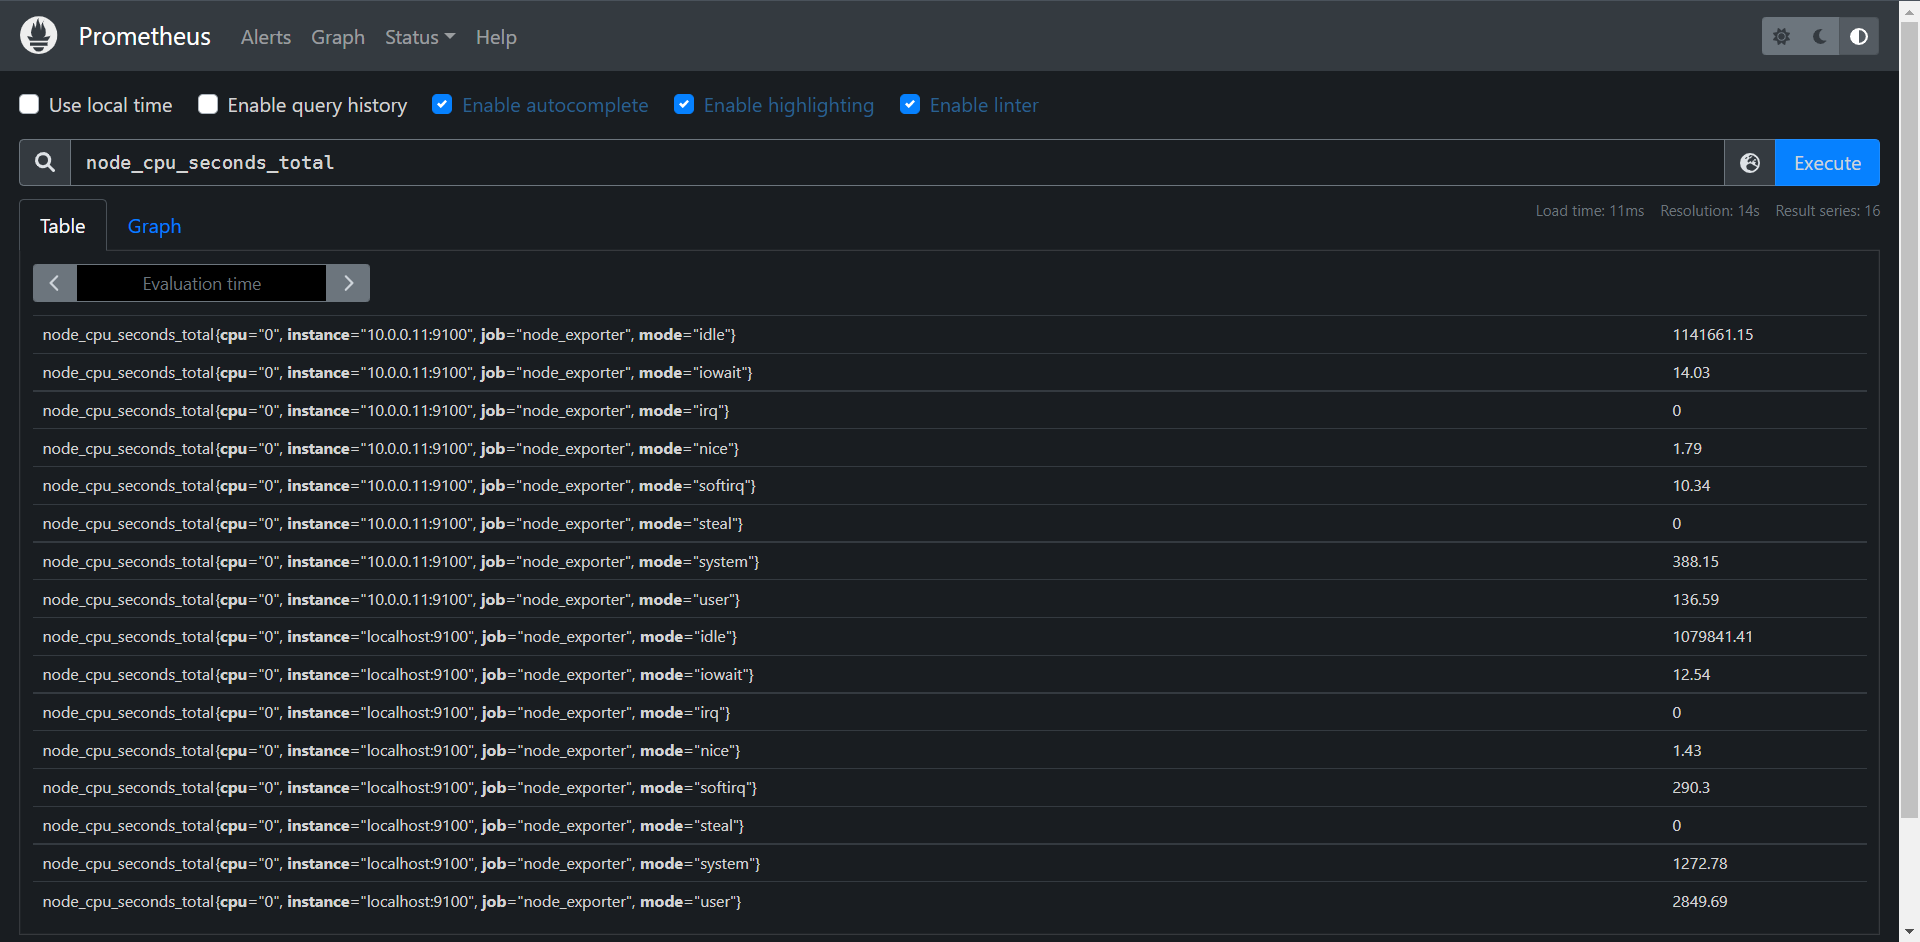
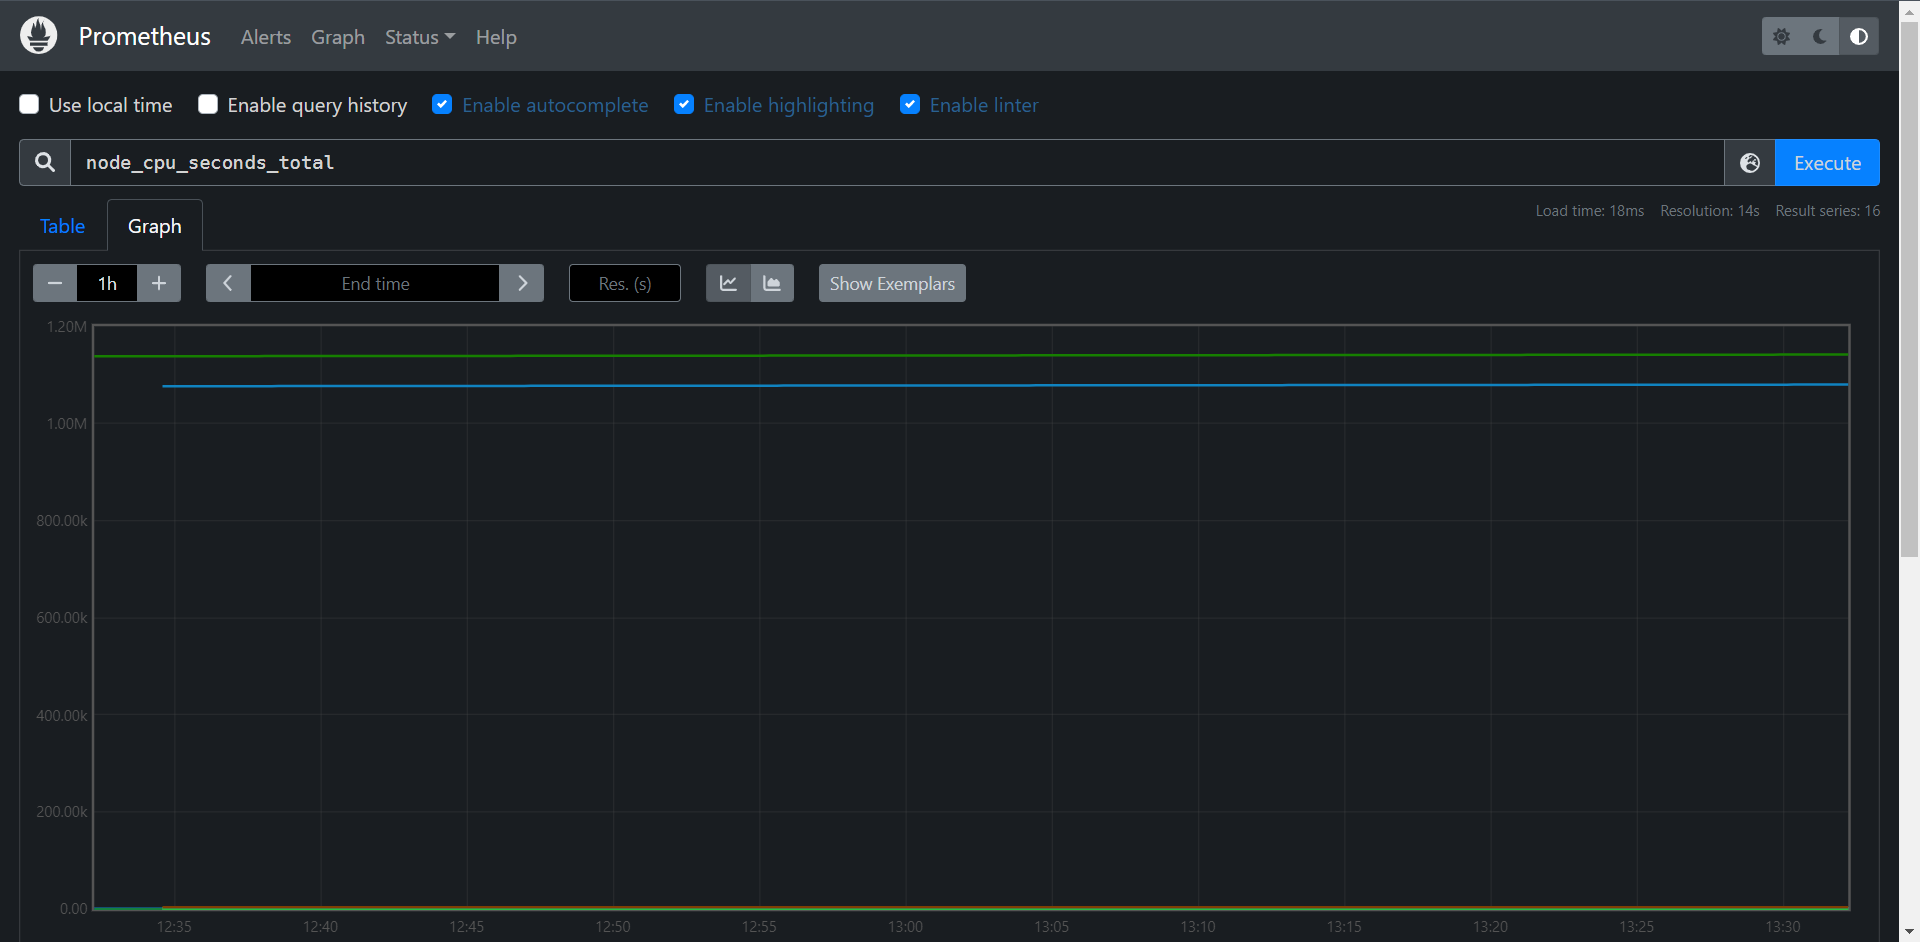
这里我在Prometheus本地也装了一个Node Exporter

到这里我们就配置好了我们的Exporter了,接下来我们来学习的就是node_exporter的常用配置了。
13.1.2:Node_exporter常用监控指标
13.1.2.1:CPU监控
对于节点我们首先想到的就是要先对CPU进行监控,因为CPU是处理任何任务的核心,根据CPU的状态可以分析出当前系统的健康状态,要对节点进行CPU监控,需要用到node_cpu_seconds_total这个监控指标,在metrics接口中该指标内容如下:

# HELP node_cpu_seconds_total Seconds the CPUs spent in each mode.
# TYPE node_cpu_seconds_total counter
node_cpu_seconds_total{cpu="0",mode="idle"} 1.14513961e+06
node_cpu_seconds_total{cpu="0",mode="iowait"} 14.06
node_cpu_seconds_total{cpu="0",mode="irq"} 0
node_cpu_seconds_total{cpu="0",mode="nice"} 1.79
node_cpu_seconds_total{cpu="0",mode="softirq"} 10.4
node_cpu_seconds_total{cpu="0",mode="steal"} 0
node_cpu_seconds_total{cpu="0",mode="system"} 390.77
node_cpu_seconds_total{cpu="0",mode="user"} 137.93

从接口的描述可以看出该指标是用来统计CPU每种模式下所花费的时间,是一个Counter类型的指标,也就是会一直整张,这个数值其实是CPU时间片的一个累积值,意思就是从操作系统启动起来CPU开始工作,就开始记录自己总共使用的时间,然后保存下来,而且这里累积的CPU使用时间还会分成几个不同的模式,比如用户态使用时间,空闲时间,中断时间,内核态使用时间等等,也就是平时我们使用top命令查看到的相关信息,而且我们这个指标会分别对这些模式进行记录。

接下来我们对节点的CPU进行监控,我们也知道一个一直增长的CPU时间对于我们来说意义不大,一般我们更希望监控节点的CPU使用率,也就是我们使用top命令看到的百分比、
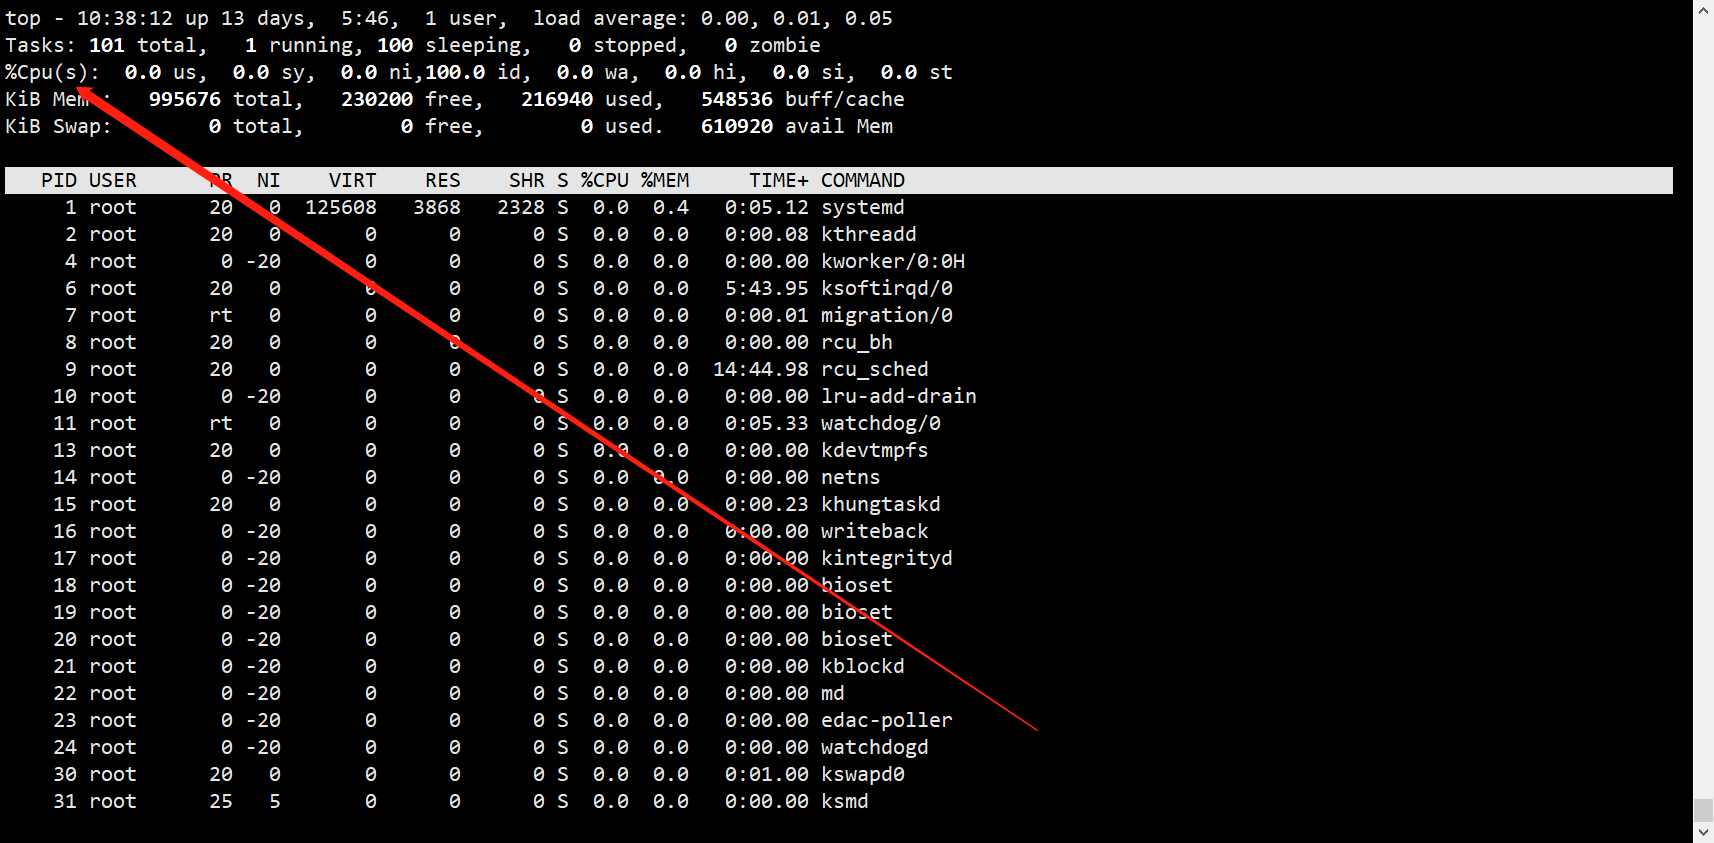
要计算CPU的使用率,那么我们需要搞清楚这个使用率的含义,CPU使用率是CPU除空闲(Idle)状态之外其他的所有CPU的时间总和除以CPU时间得到的结果,理解了这个概念后就可以写出正确的PromQL查询语句了

要计算除空闲状态之外的CPU时间总和,更好的方式是不是直接计算空闲CPU状态的使用率。然后用1减去结果就得到了我们想要的结果了,所以我们首先先过滤idle模式的指标:

PromQL:node_cpu_seconds_total{mode="idle"}
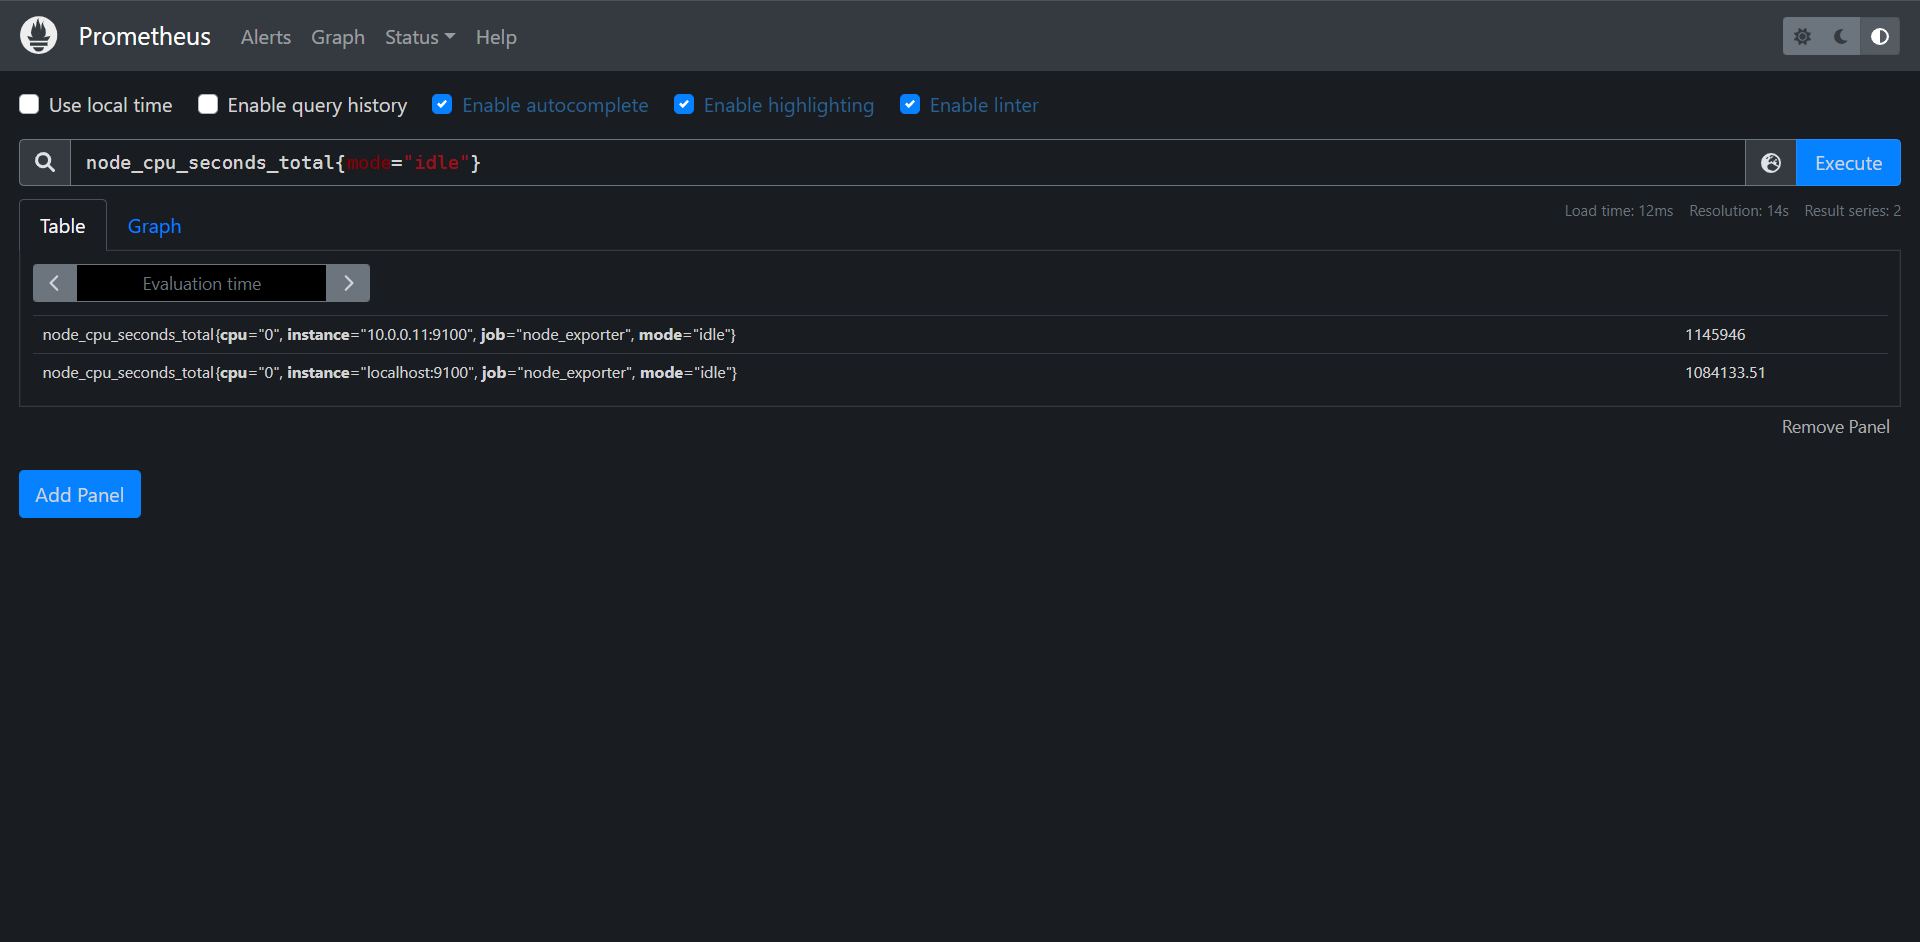
计算一分钟内idle模式下cpu使用了多少时间

PromQL:increase(node_cpu_seconds_total{mode="idle"}[1m])
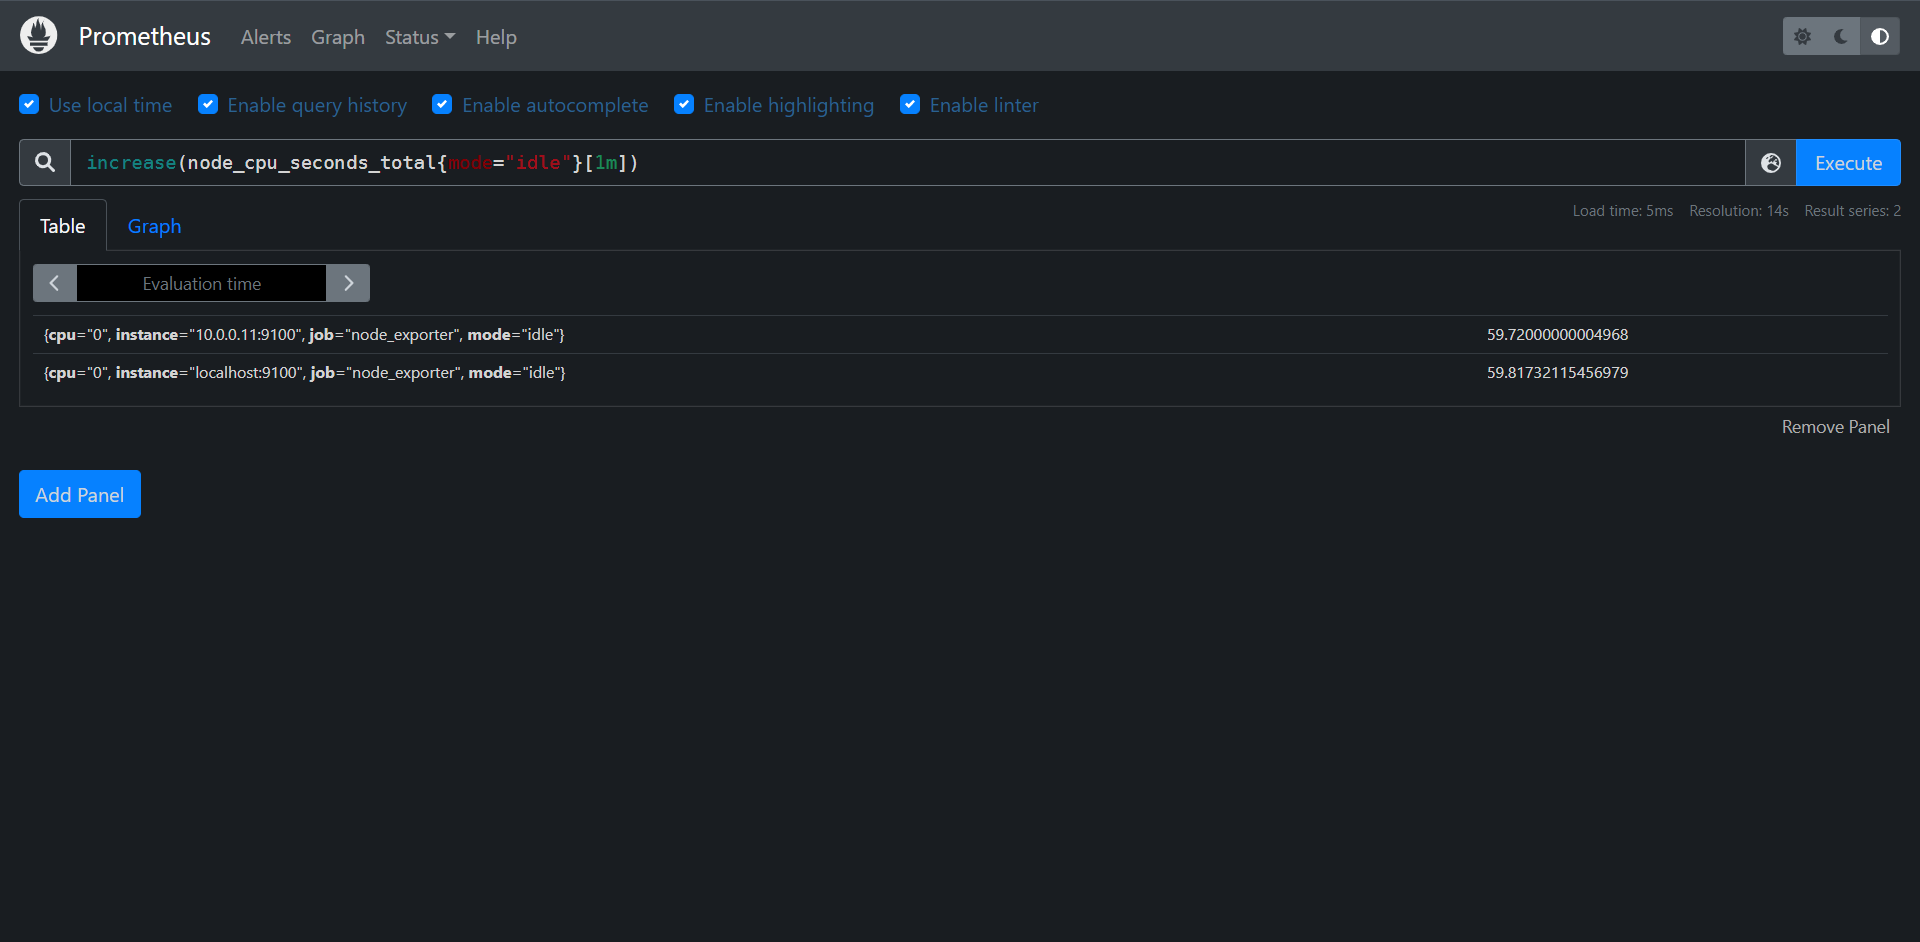
根据instance进行聚合一下

PromQL:sum by(instance)(increase(node_cpu_seconds_total{mode="idle"}[1m]))

与总的CPU时长进行对比

PromQL:
sum (increase(node_cpu_seconds_total{mode="idle"}[1m])) by(instance) / sum (increase(node_cpu_seconds_total[1m])) by(instance)
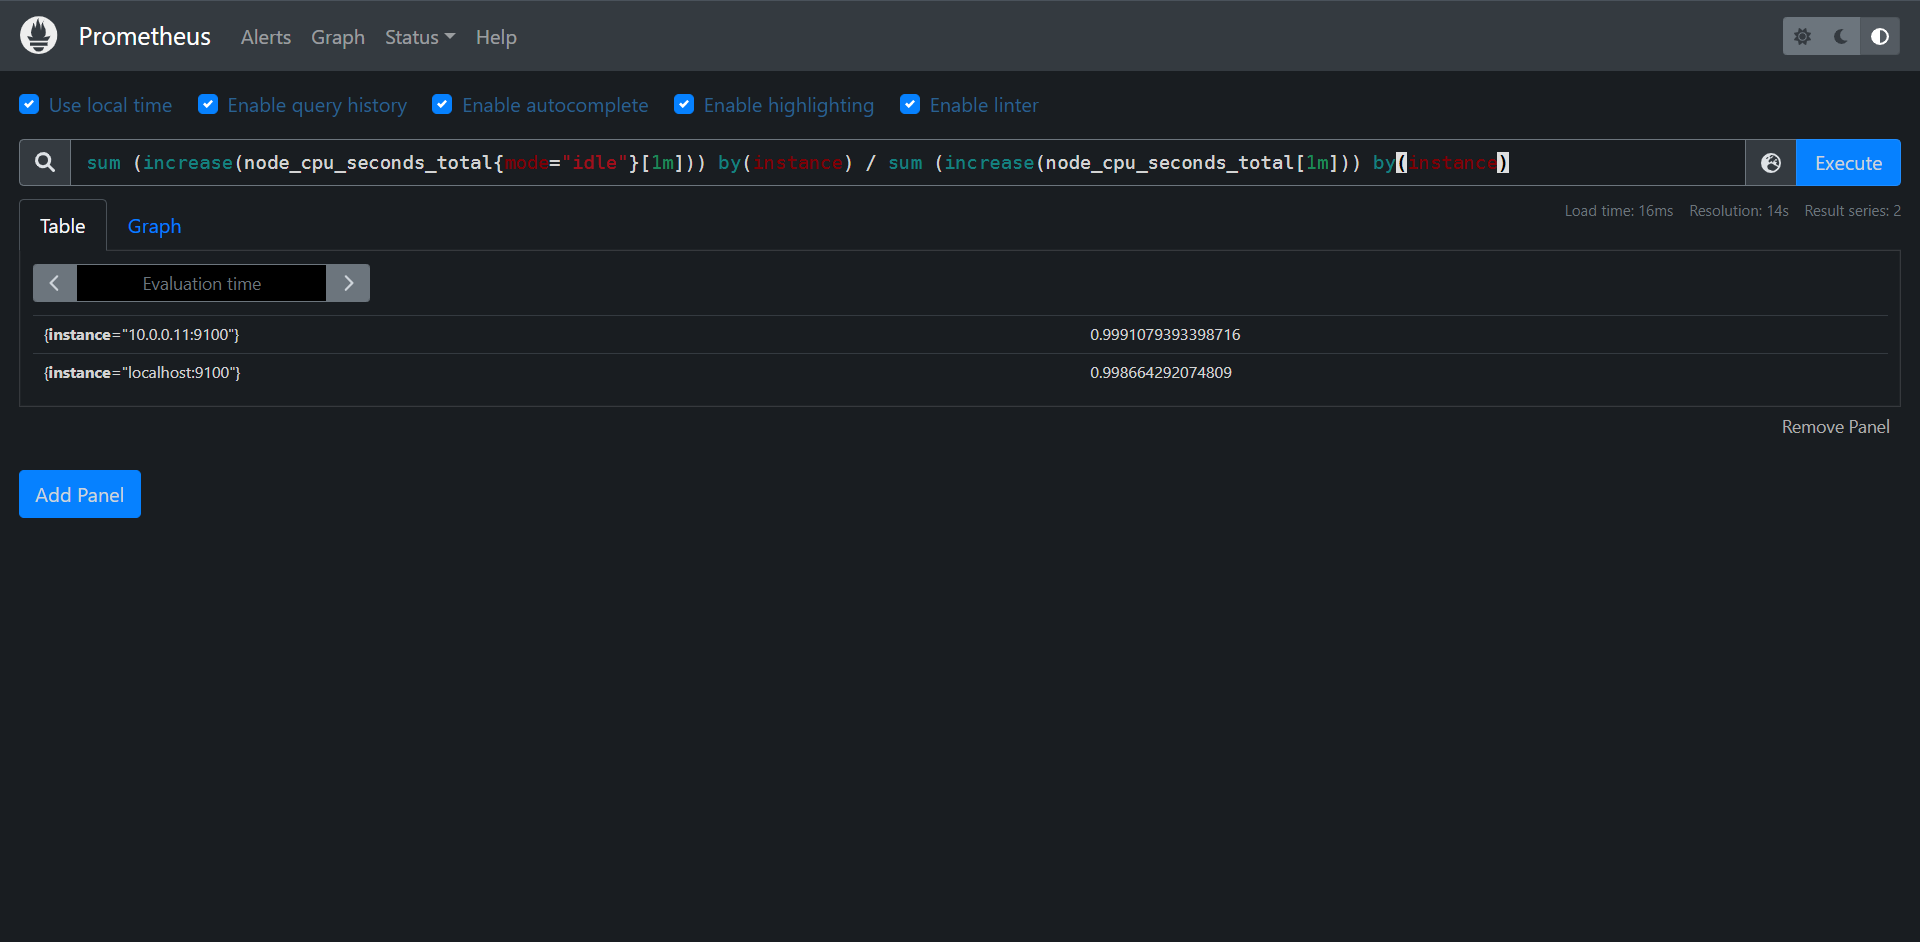
整体PromQL计算如下:

PromQL:
(1 - sum (increase(node_cpu_seconds_total{mode="idle"}[1m])) by(instance) / sum (increase(node_cpu_seconds_total[1m])) by(instance)) * 100
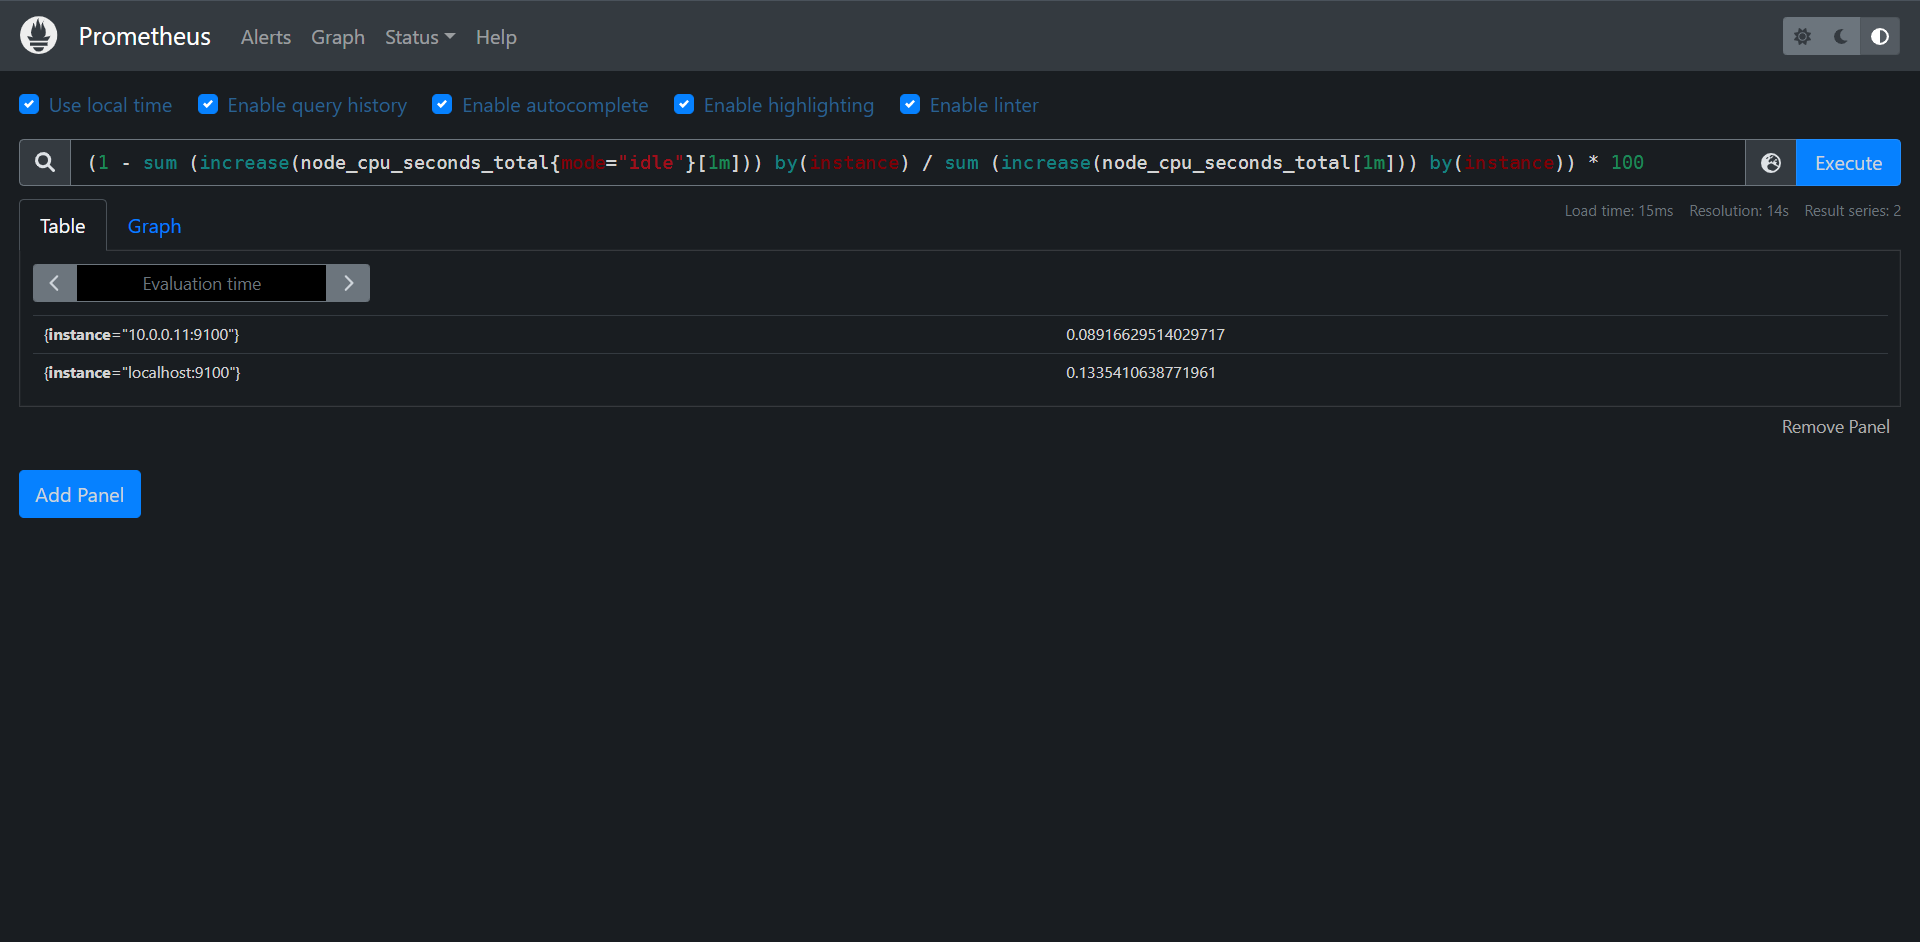
当然了我们完全可以吧increase这个函数换成rate,其实结果相差不大的

PromQL:
(1 - sum (rate(node_cpu_seconds_total{mode="idle"}[1m])) by(instance) / sum (rate(node_cpu_seconds_total[1m])) by(instance)) * 100
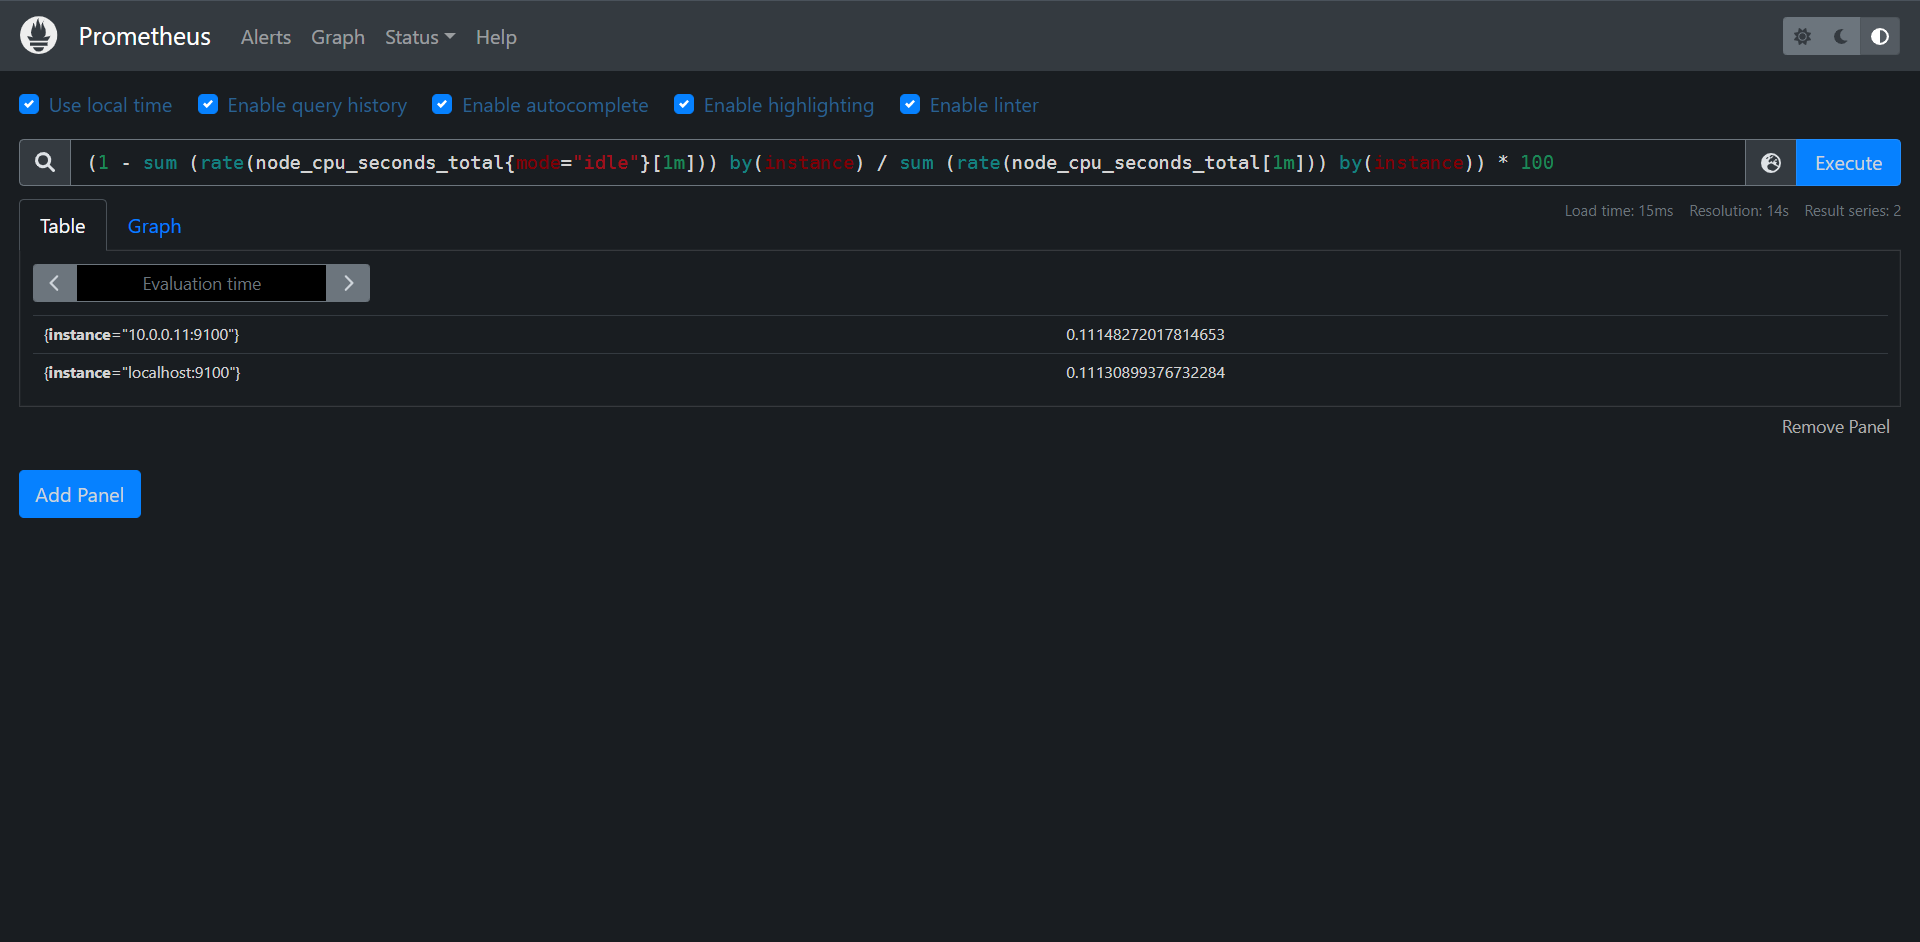
13.1.2.2:内存监控
除了CPU监控之外,我们可能最关心的就就是节点内存的监控了,平时我们查看节点的内存使用情况基本上都是使用free命令来查看

[root@prometheus prometheus]# free -mh
              total        used        free      shared  buff/cache   available
Mem:           972M        214M        198M         13M        560M        594M
Swap:            0B          0B          0B

free命令的输出会显示系统内存的使用情况,包括物理内存,交换内存(swap)和内核缓冲区内存等,所以要对内存进行监控我们需要先了解这些概念,我们先了解一下free命令的输出内容:


1:total:表示系统总的可用的内存
2:used:已经被使用的内存
3:free:还有多少内存可供是使用
4:shared:被共享使用的大小
5:buff/cache:被buff/cache使用的大小
6:available:可以被应用使用的内存大小

主要我们需要关注free和available,主要是这样的Linux为了提升磁盘的操作性能它会消耗一部分内存来缓存磁盘的数据也就是我们看到的buff/cache,所以说对于内核来说buff/cache属于已经被使用过的内存,只是说对于应用程序它需要内存的时候如果free不够了它会从buff/cache的内存回收给到应用程序去使用,从应用程序的角度来说available=free+buff/cache,但是这个计算月不是百分百准确的,只是一个理想的值,

我们主要来看看如何查询Mem的相关的指标:
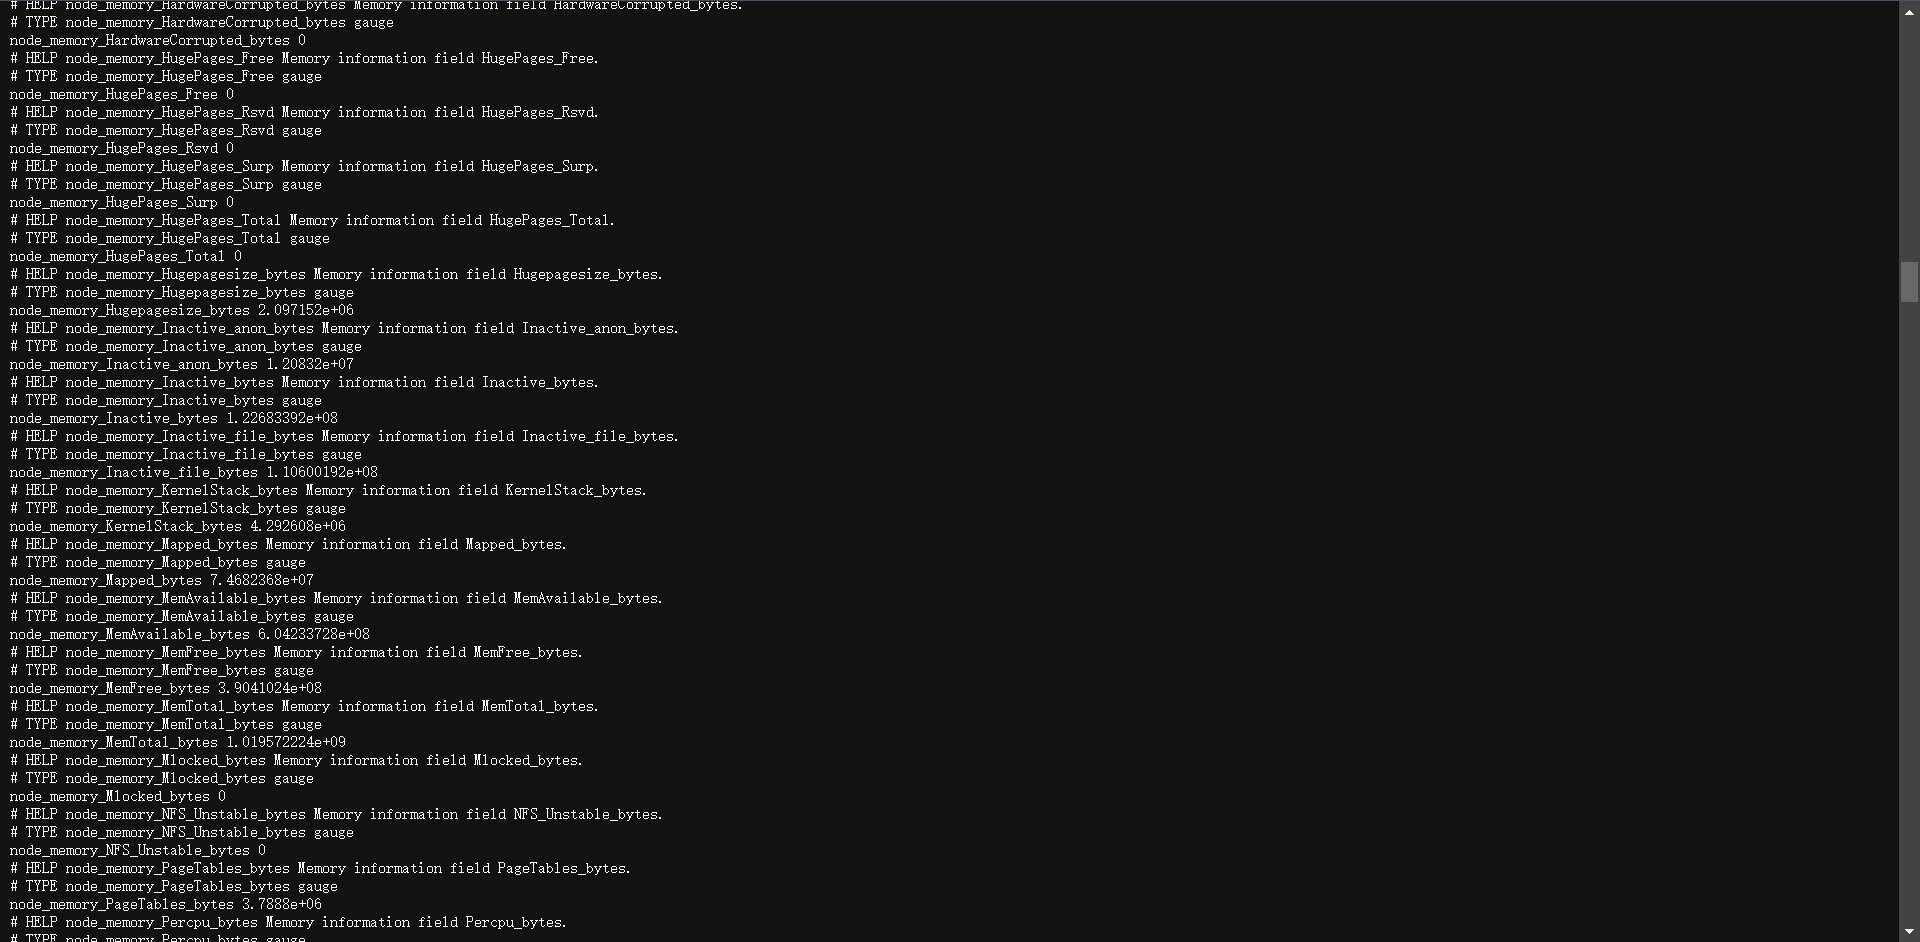
我们可以看到非常的多,

那么要计算可使用的内存的使用我们需要使用如下(应用程序角度)

PromQL:node_memory_Buffers_bytes + node_memory_Cached_bytes + node_memory_MemFree_bytes


内存使用率计算方法如下:

PromQL:
(1 - (node_memory_Buffers_bytes + node_memory_Cached_bytes + node_memory_MemFree_bytes) / node_memory_MemTotal_bytes) * 100

内存总的一个使用情况:

PromQL:node_memory_MemTotal_bytes
13.1.2.3:磁盘监控
接下来比较重要的就是磁盘监控,对于磁盘监控我们不仅要对磁盘的使用情况感兴趣,一般来说对于磁盘的IO的监控也非常的重要。

1:磁盘容量监控
要监控磁盘容量,需要用到node_filesystem_*相关指标,比如要查询节点磁盘空间使用率,则可以同样用总的减去可用的来进行计算,磁盘可用空间使用node_filesystem_avail_bytes指标,但是由于会有一些我们不关心的磁盘信息,所以我们可以使用fstype标签过滤关心的磁盘信息,或如ext4或者xfs格式的磁盘,

# 可用的磁盘空间
PromQL:node_filesystem_avail_bytes{fstype=~"xfs|ext4"}
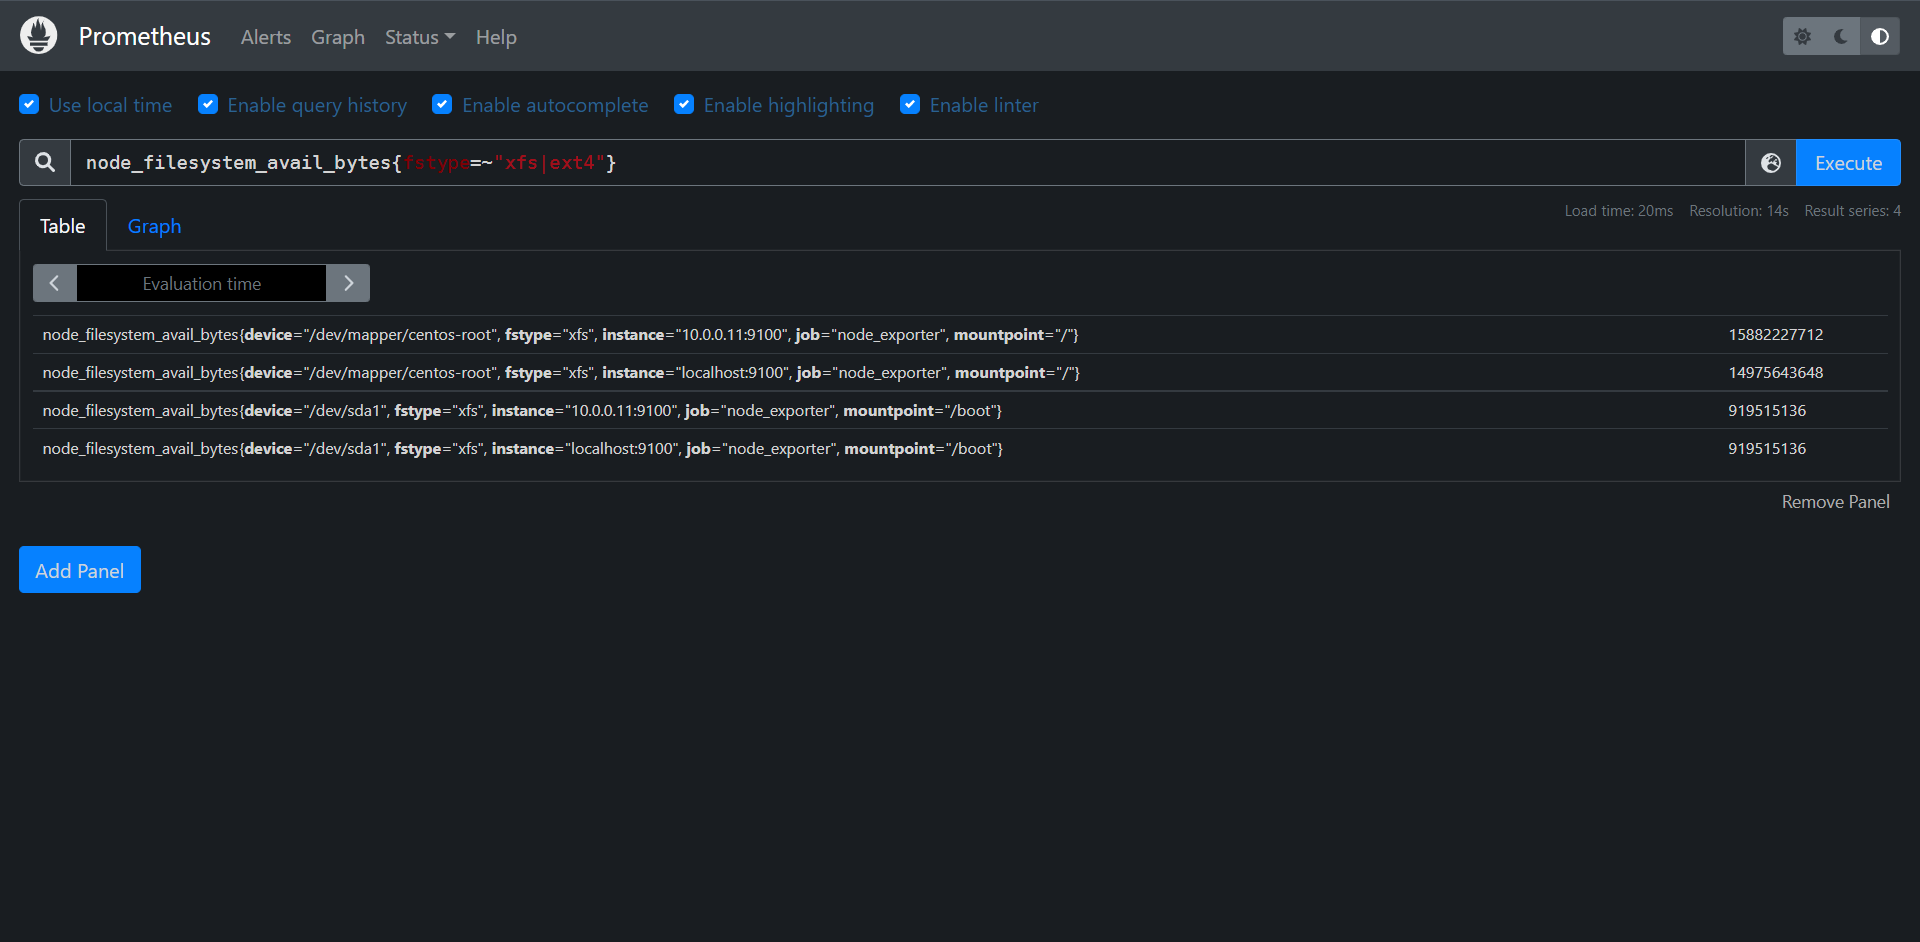
接下来我们来计算可用率

PromQL:
node_filesystem_avail_bytes{fstype=~"xfs|ext4"} / node_filesystem_size_bytes{fstype=~"xfs|ext4"} * 100
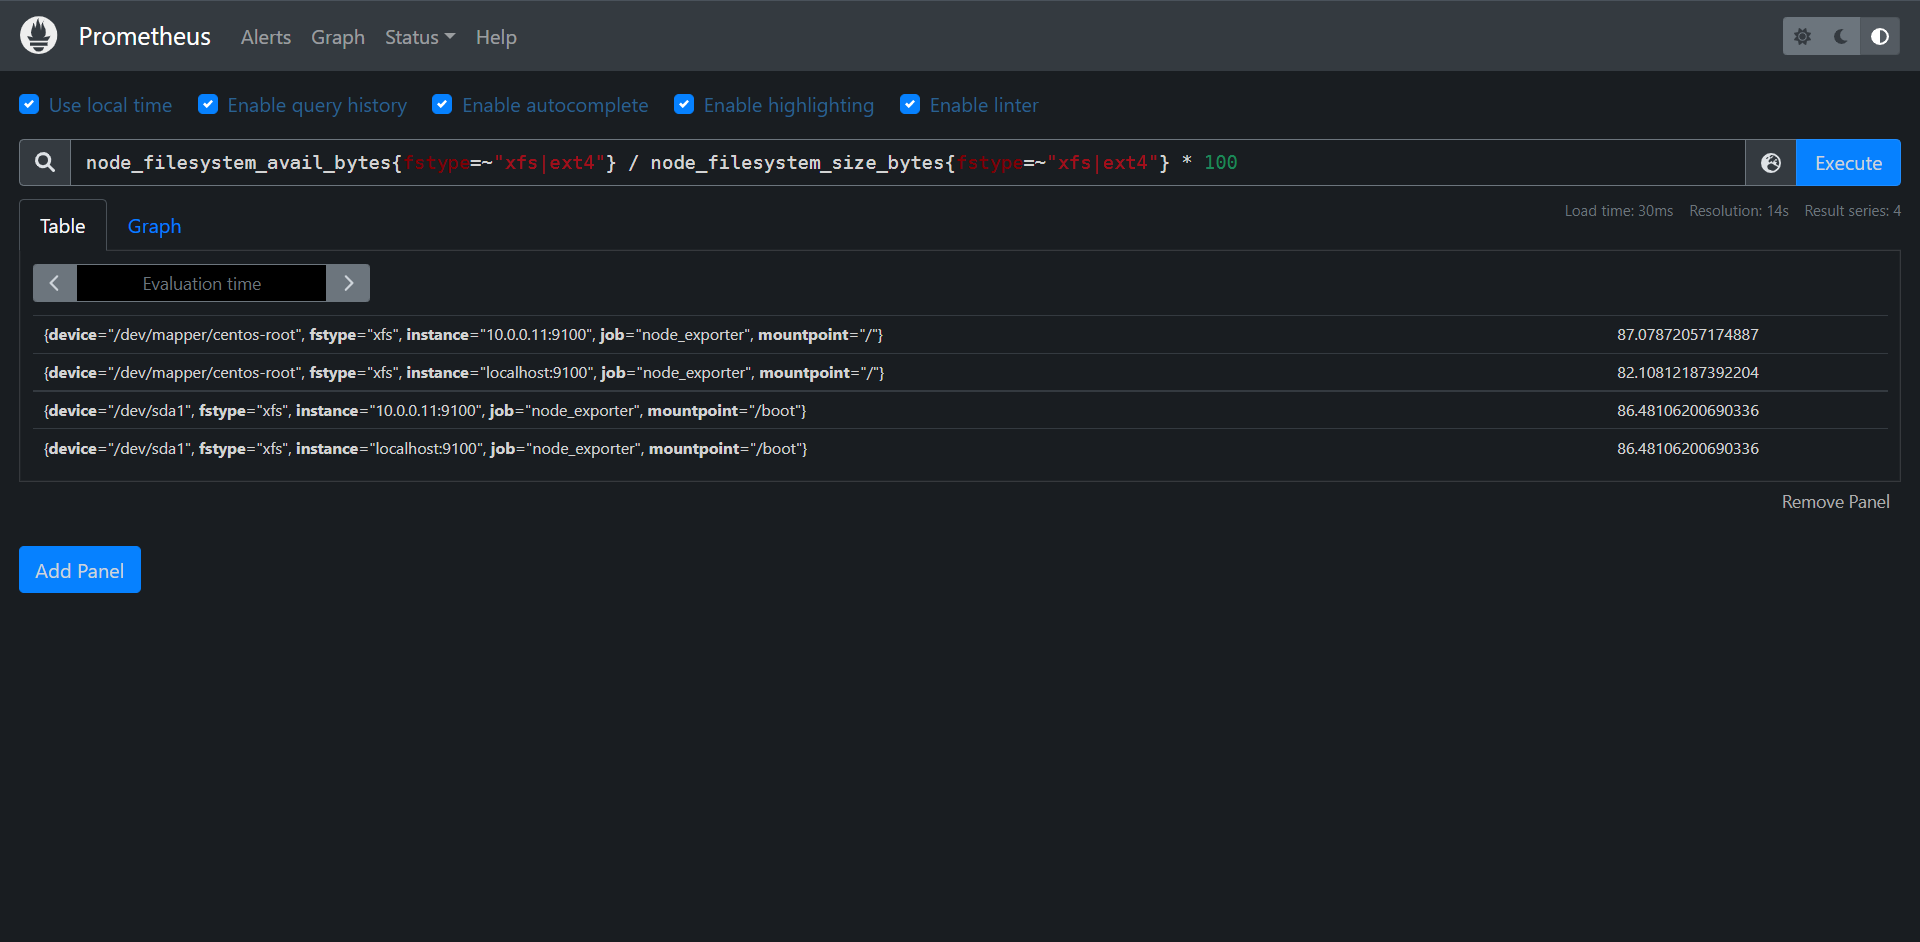
计算使用率:

PromQL:
(1 - node_filesystem_avail_bytes{fstype=~"xfs|ext4"} / node_filesystem_size_bytes{fstype=~"xfs|ext4"}) * 100
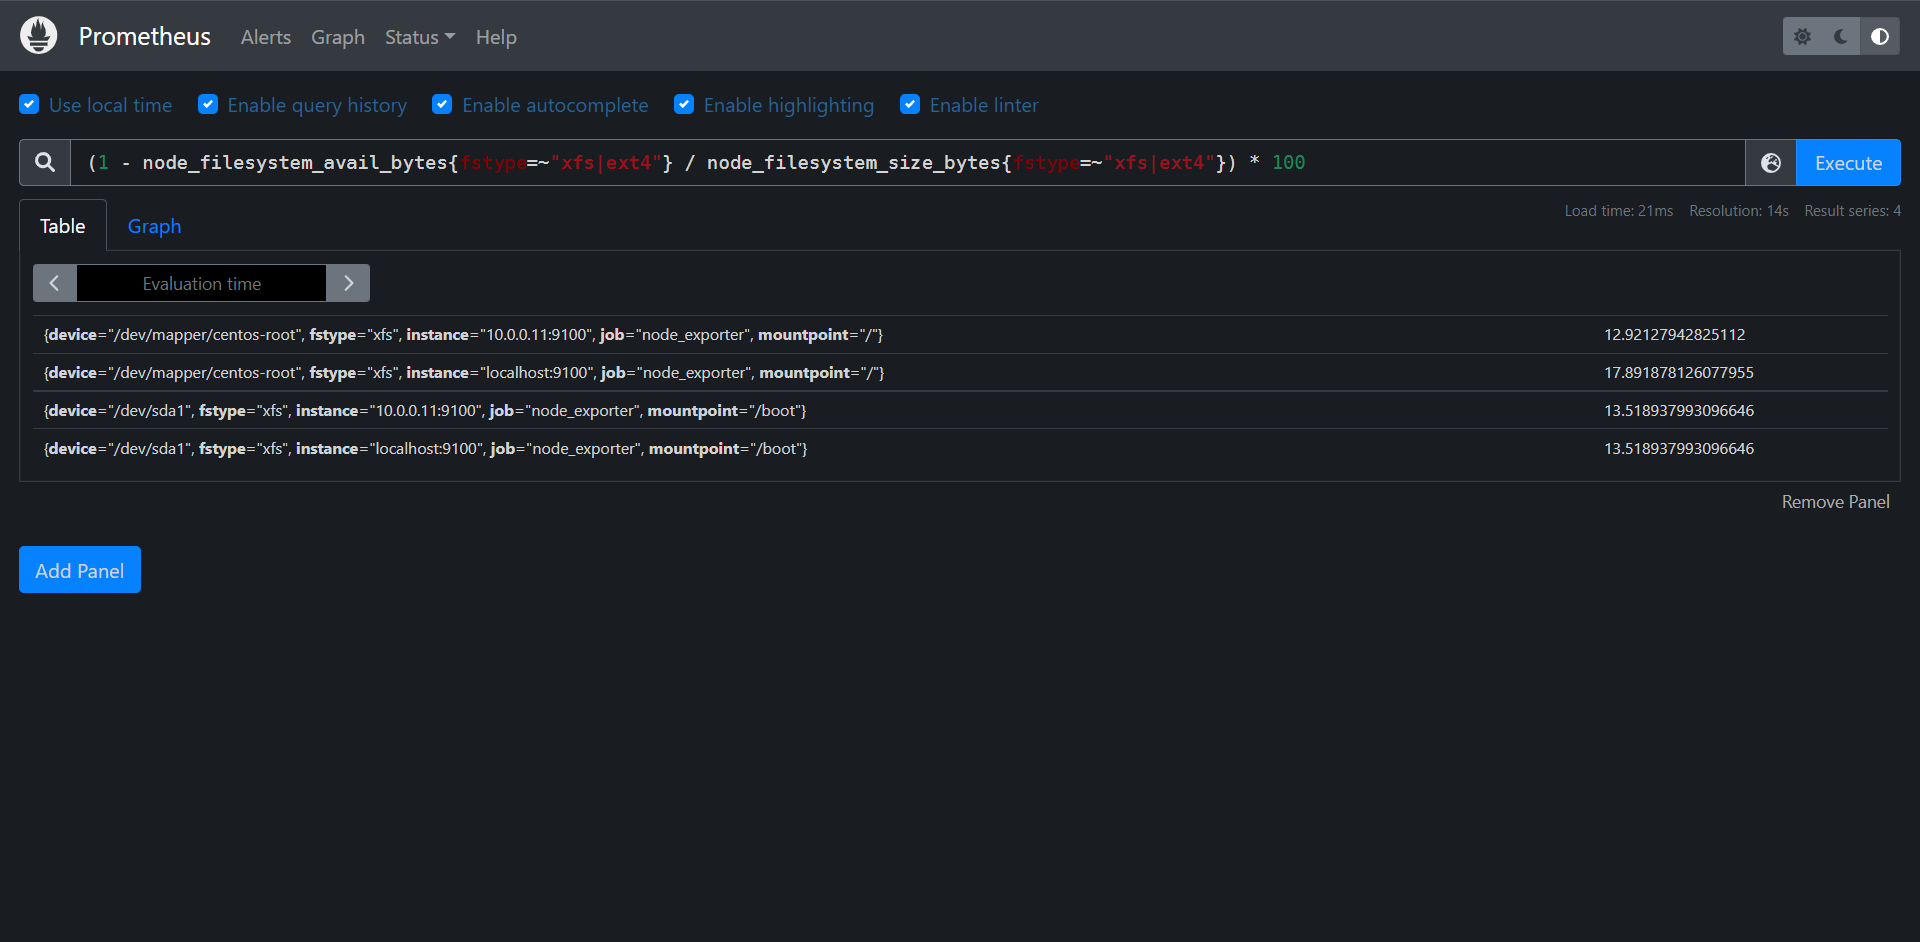
当然了我们可以根据各个服务器来查看不同的情况,比如我们查看Prometheus本身的,在过滤时使用标签即可

PromQL:
(1 - node_filesystem_avail_bytes{fstype=~"xfs|ext4",instance="localhost:9100"} / node_filesystem_size_bytes{fstype=~"xfs|ext4",instance="localhost:9100"}) * 100
磁盘IO监控

要监控磁盘的IO,那么就要区分是读IO还是写的IO,读的IO使用node_disk_reads_completed_total指标,写的IO使用node_disk_writes_completed_total指标。

磁盘读IO使用如下方法计算:
PromQL:sum by(device,instance)(rate(node_disk_reads_completed_total[1d]))
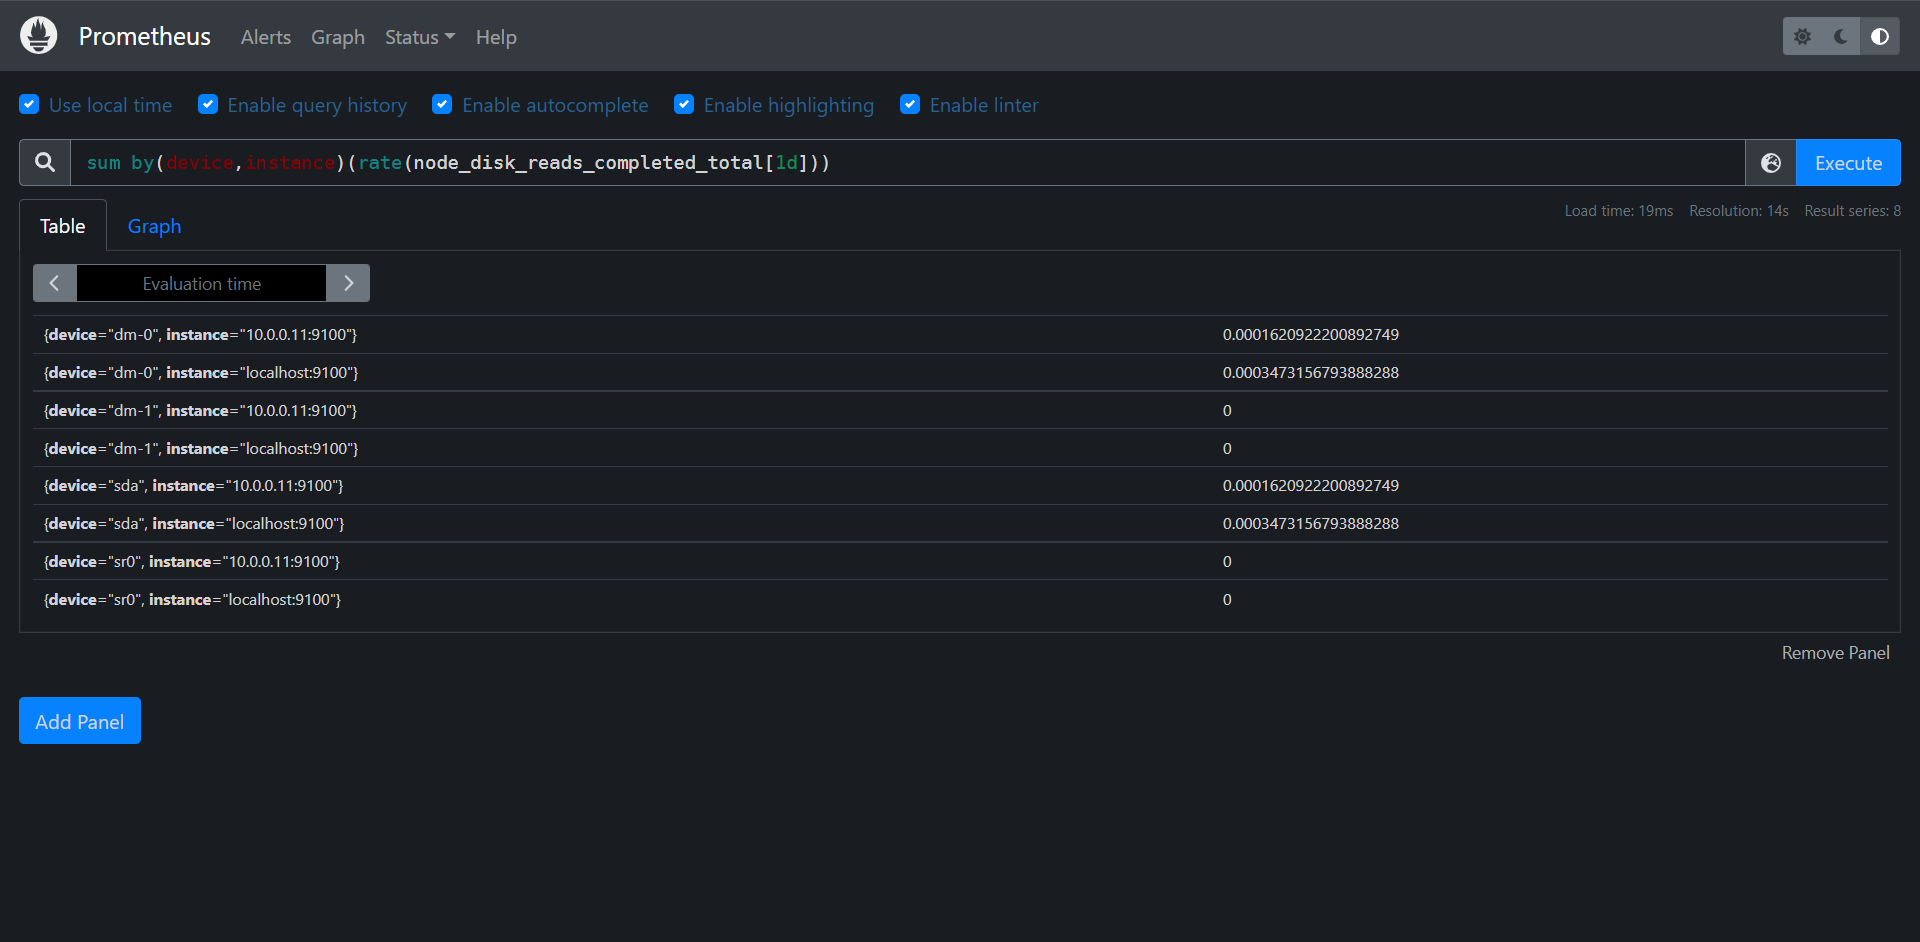
计算写的IO使用方法如下:
PromQL:sum by(device,instance)(rate(node_disk_writes_completed_total[1d]))

预测磁盘容量我们后面再说,在讲到报警的时候我们会讲到。
13.1.2.4:网络IO监控
这里我们要了解的就是上下行带宽的问题了,上行带宽使用node_network_receive_bytes_total,由于我们对网络带宽的瞬间变化比较关注,所以一般我们会使用irate函数计算网络IO,比如计算上行带宽:

# 注。这里面的话可能涉及到多网卡的情况,所以我这里只使用eth0来计算了,要根据生产的环境来酌情使用正则
PromQL:node_network_receive_bytes_total{device = "eth0"}
PromQL:rate(node_network_receive_bytes_total{device = "eth0"}[5m])
PromQL:sum by(instance)(rate(node_network_receive_bytes_total{device = "eth0"}[5m]))
PromQL:sum by(instance)(irate(node_network_receive_bytes_total{device = "eth0"}[5m])) / 1024^2
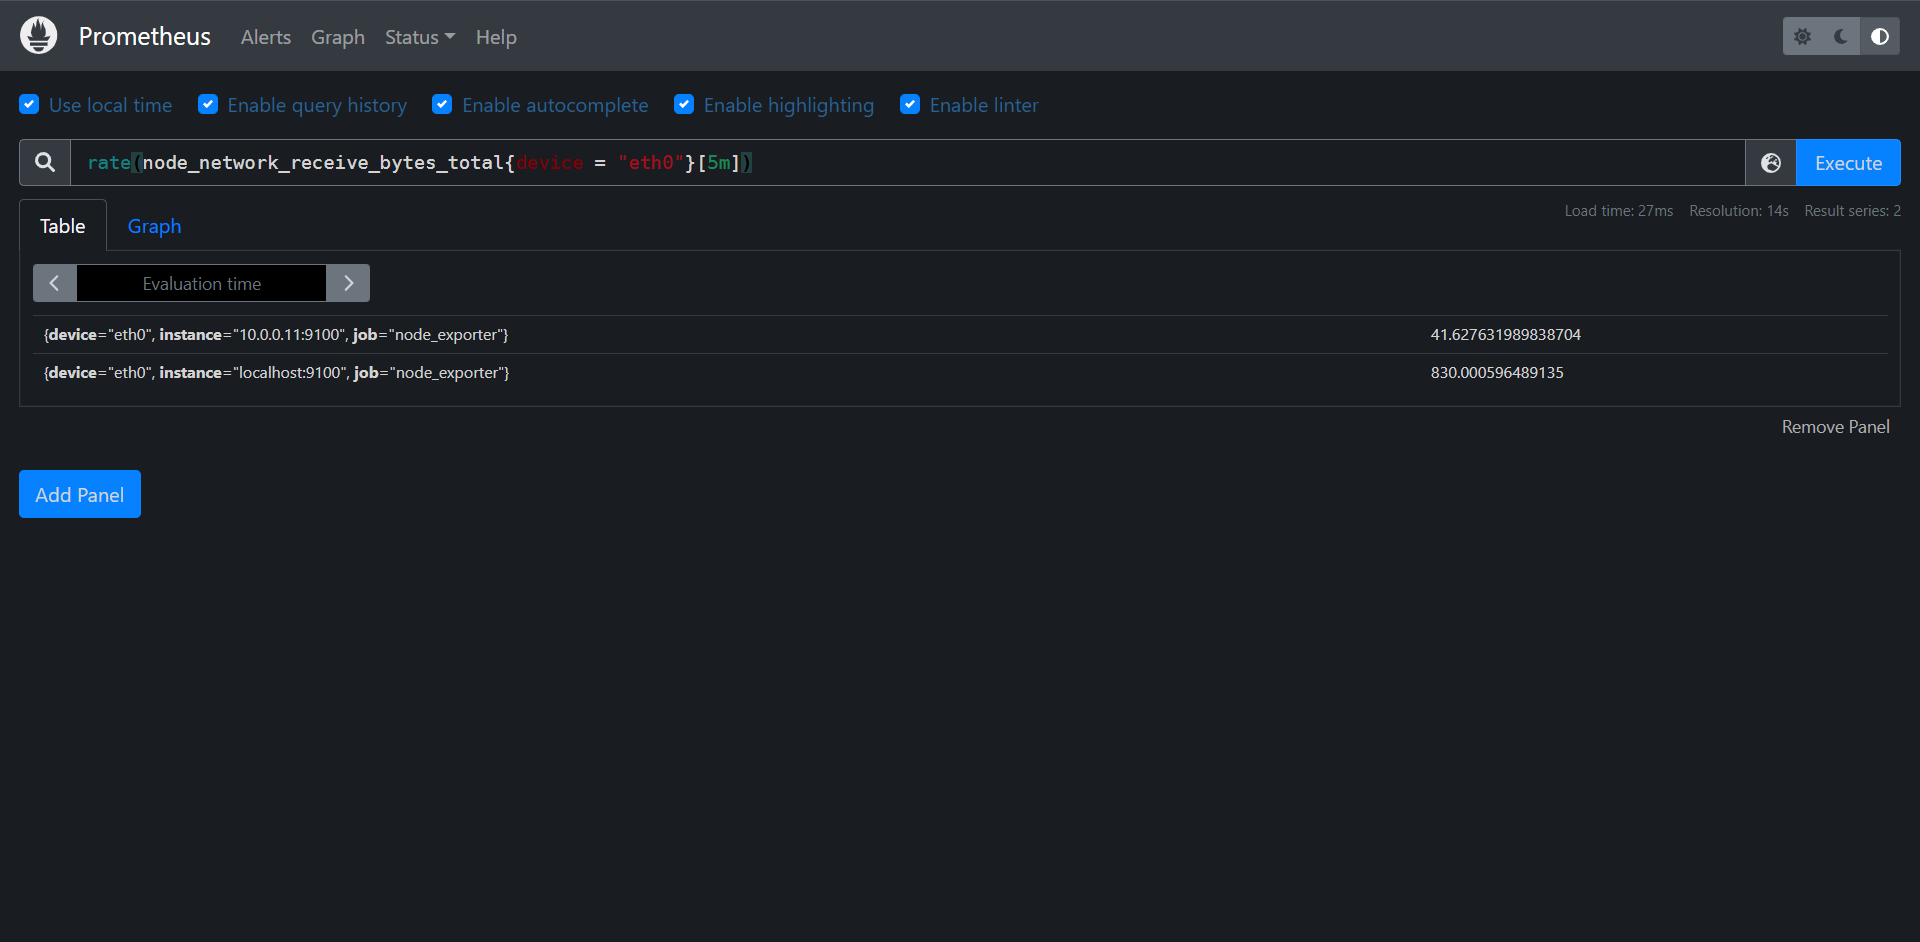
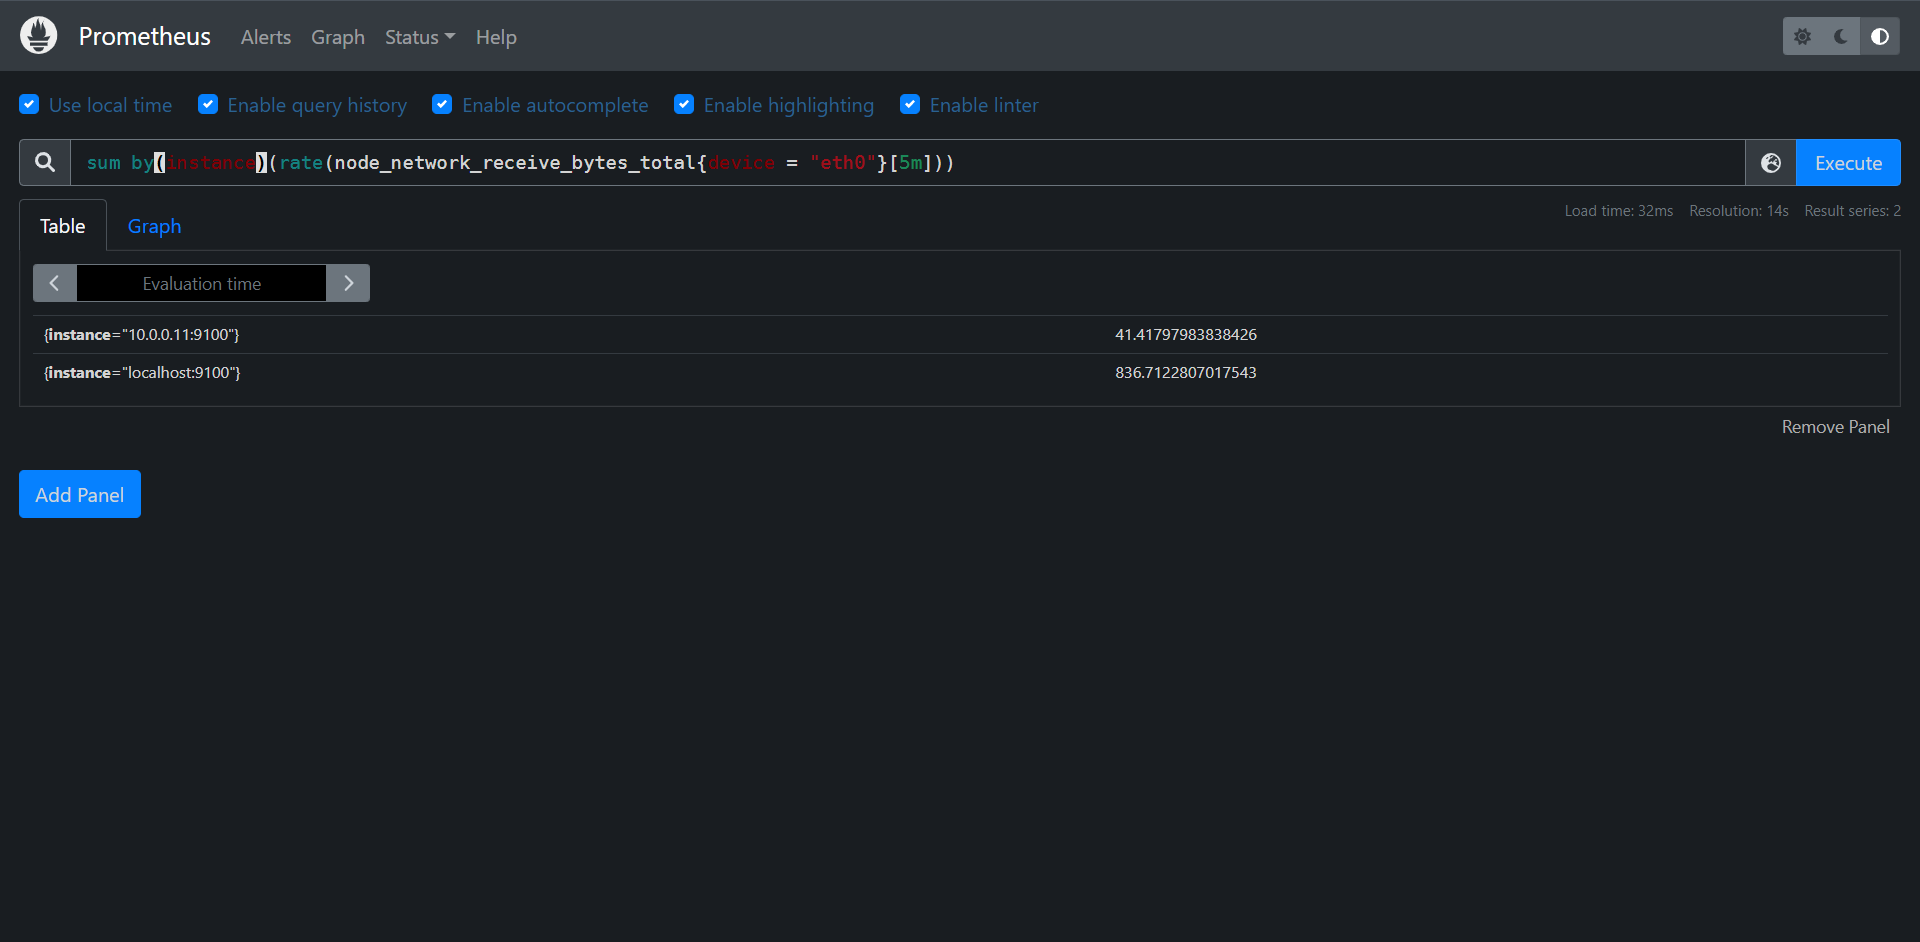
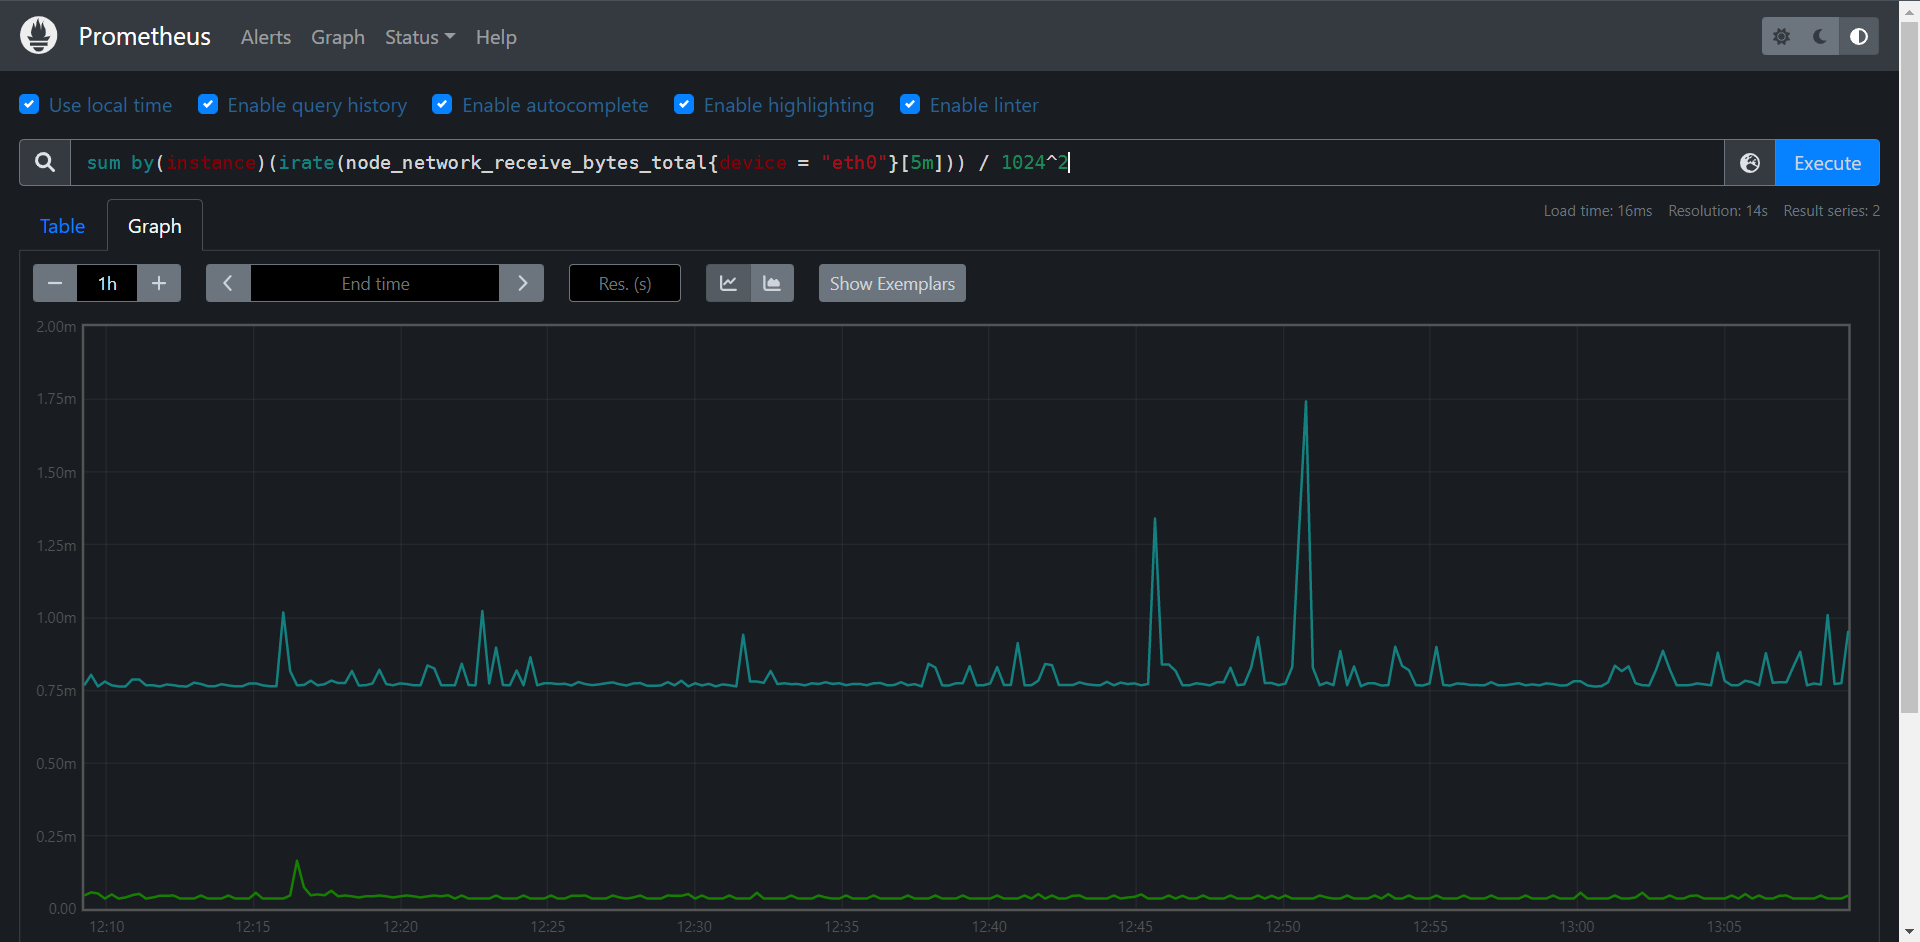
当然了,这个是要根据实际情况来聚合的,这里我只是使用了节点instance来聚合了一下而已

下行带宽我们也来看一下;

PromQL:sum by(instance)(irate(node_network_transmit_bytes_total{device = "eth0"}[5m])) / 1024^2
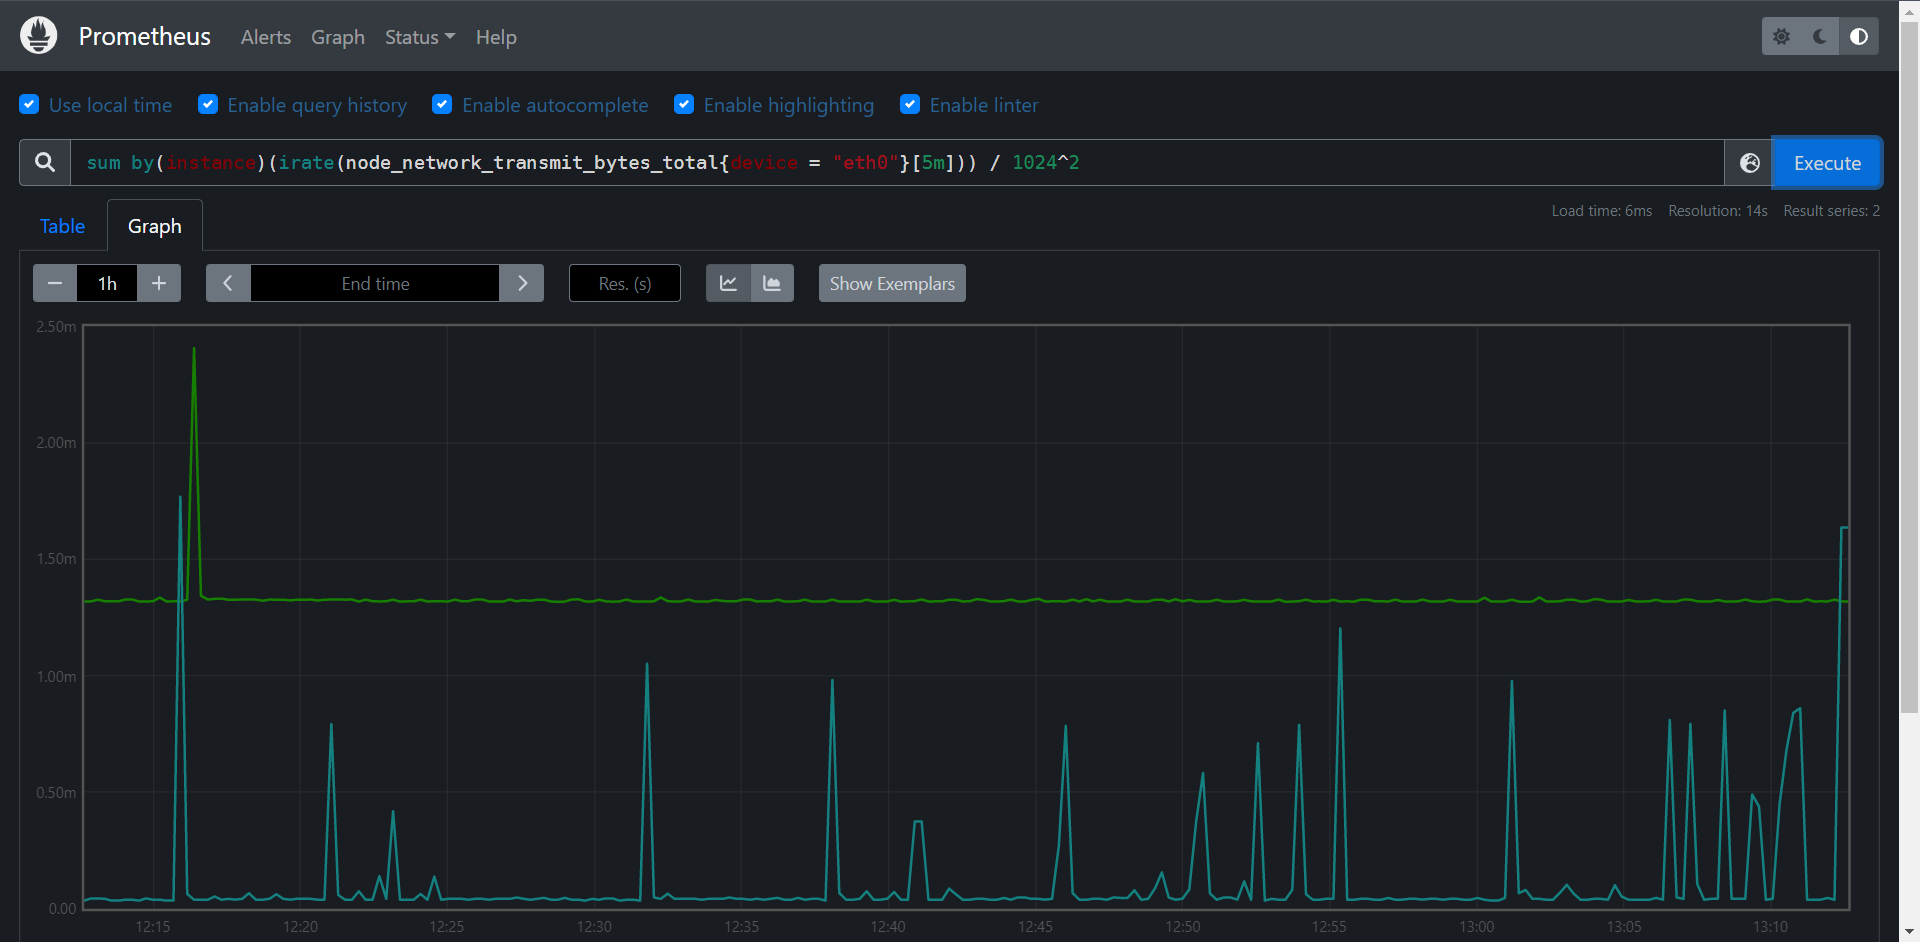
其他的监控我们后面涉及到了当然也会给大家提的,这里重点并不是我们难得地方,难就难在了我们不知道该使用哪儿个指标来计算我们所需要的数据。
13.1.3:Node Exporter自定义监控指标
13.1.3.1:textfile收集器
node_exporter除了本身可以收集系统指标之外,还可以通过textfile模块来采集我们自定义得监控指标,这对于系统监控提供了更灵活得使用空间,比如我们通过脚本采集到得监控数据可以通过该模块暴露出去,用于Prometheus进行监控报警,默认情况下node_exporter会启用textfile组件,但是需要使用--collector.textfile.dirvectory参数设置一个用于采集的路径,所有生成的监控指标都将放在该路径下以.prom文件后缀结尾,所有自定义生成的监控指标需要按照如下所示的方式进行存储,比如我们使用shell或者Python脚本写入的文件

# HELP example_metric Metric read fron /sone/path/textfile/example.pron
# TYPE example_metric untyped
exanple_metric 1

这其实是一个标准的metrics接口内容格式,这里如果没有加上HELP信息的话,系统会帮助生成一个简单的描述信息,但是如果有多个文件中出现相同的指标名称,那么需要保证这些指标的HELP和TYPE要一致,否则采集会出错。

一般来说输出指标到.prom文件的脚本任务会加入到crontab中执行,按照需求设置采集时间,但是如果node_exporter采集的时候正好文件正在写入操作,可能会导致文件出现问题,我们可以将任务先转移到一个临时文件,然后通过临时文件的重命名进行操作,降低风险:

* /5 * * * * $TEXTFILE/printMetrics.sh > /path/to/directory/metrics.prom.$$ && mv /path/to/directory/metrics.prom.$$ /path/to/directory/metrics.prom

对于.prom文件的采集,系统会自动的加入采集文件的修改时间,通过该指标我们可以设置告警用于判断是否文件发生了变化,比如采集指标时间为10分钟一次,那么修改时间应该<15分钟,否则就应该报警上次采集未成功,该指标名称为node_textfile_mtime_seconds,指标收集时间为unixtime格式时间。

同时除了加载一些探测信息,使用该方式还可以用于静态信息的收集,比如定义系统角色信息,或服务器特殊配置信息,这些也都可以通过metrics的方式进行传递。

echo 'role{role="application_server"} 1' > /path/to/directory/role.prom.$$ && mv /path/to/directory/role.prom.$$ /path/to/directory/role.prom

这里我们以官方给的一个脚本来采集文件夹目录大小的shell脚本为例进行说明,脚本地址如下:
https://raw.githubusercontent.com/prometheus-community/node-exporter-textfile-collector-scripts/master/directory-size.sh

内容如下:

#!/bin/sh
#
# Expose directory usage metrics, passed as an argument.
#
# Usage: add this to crontab:
#
# */5 * * * * prometheus directory-size.sh /var/lib/prometheus | sponge /var/lib/node_exporter/directory_size.prom
#
# sed pattern taken from https://www.robustperception.io/monitoring-directory-sizes-with-the-textfile-collector/
#
# Author: Antoine Beaupré <anarcat@debian.org>
echo "# HELP node_directory_size_bytes Disk space used by some directories"
echo "# TYPE node_directory_size_bytes gauge"
du --block-size=1 --summarize "$@" \
  | sed -ne 's/\\/\\\\/;s/"/\\"/g;s/^\([0-9]\+\)\t\(.*\)$/node_directory_size_bytes{directory="\2"} \1/p'
我们可以看到其实它也给了解决方案,使用sponge来输出文件

接下来我们来实战操作一下

我们需要修改一下node_exporter的采集目录
# 创建一下textfile目录
[root@prometheus ~]# mkdir textfile

# 更改systemd
[root@prometheus textfile]# cat /etc/systemd/system/node_exporter.service
[Unit]
Description=node exporter servoce
Documentation=https://prometheus.io
After=network.target

[Service]
Type=simple
User=root
Group=root
ExecStart=/usr/local/bin/node_exporter --collector.textfile.directory=/root/textfile
Restart=on-failure

[Install]
WantedBy=multi-user.target

# 重载并重启一下node_exporter
[root@prometheus textfile]# systemctl daemon-reload && systemctl restart node_exporter.service

完成之后我们需要去写一个脚本向定义的目录写入内容,脚本就用上面那个

安装 sponge
1:安装epel-release
2:安装moreutils

[root@prometheus textfile]# yum install -y epel-release && yum install -y moreutils

测试脚本的可执行性

[root@prometheus ~]# source size.sh ./
# HELP node_directory_size_bytes Disk space used by some directories
# TYPE node_directory_size_bytes gauge
node_directory_size_bytes{directory="./"} 252891136

# 写入crontab
[root@prometheus ~]# crontab -l
*/1 * * * * /root/size.sh /root | sponge /root/textfile/size.prom
[root@prometheus ~]# chmod +x /root/size.sh
[root@prometheus ~]# ls textfile/
size.prom

# 使用PromQL查询
PromQL:node_directory_size_bytes
PromQL:node_textfile_mtime_seconds
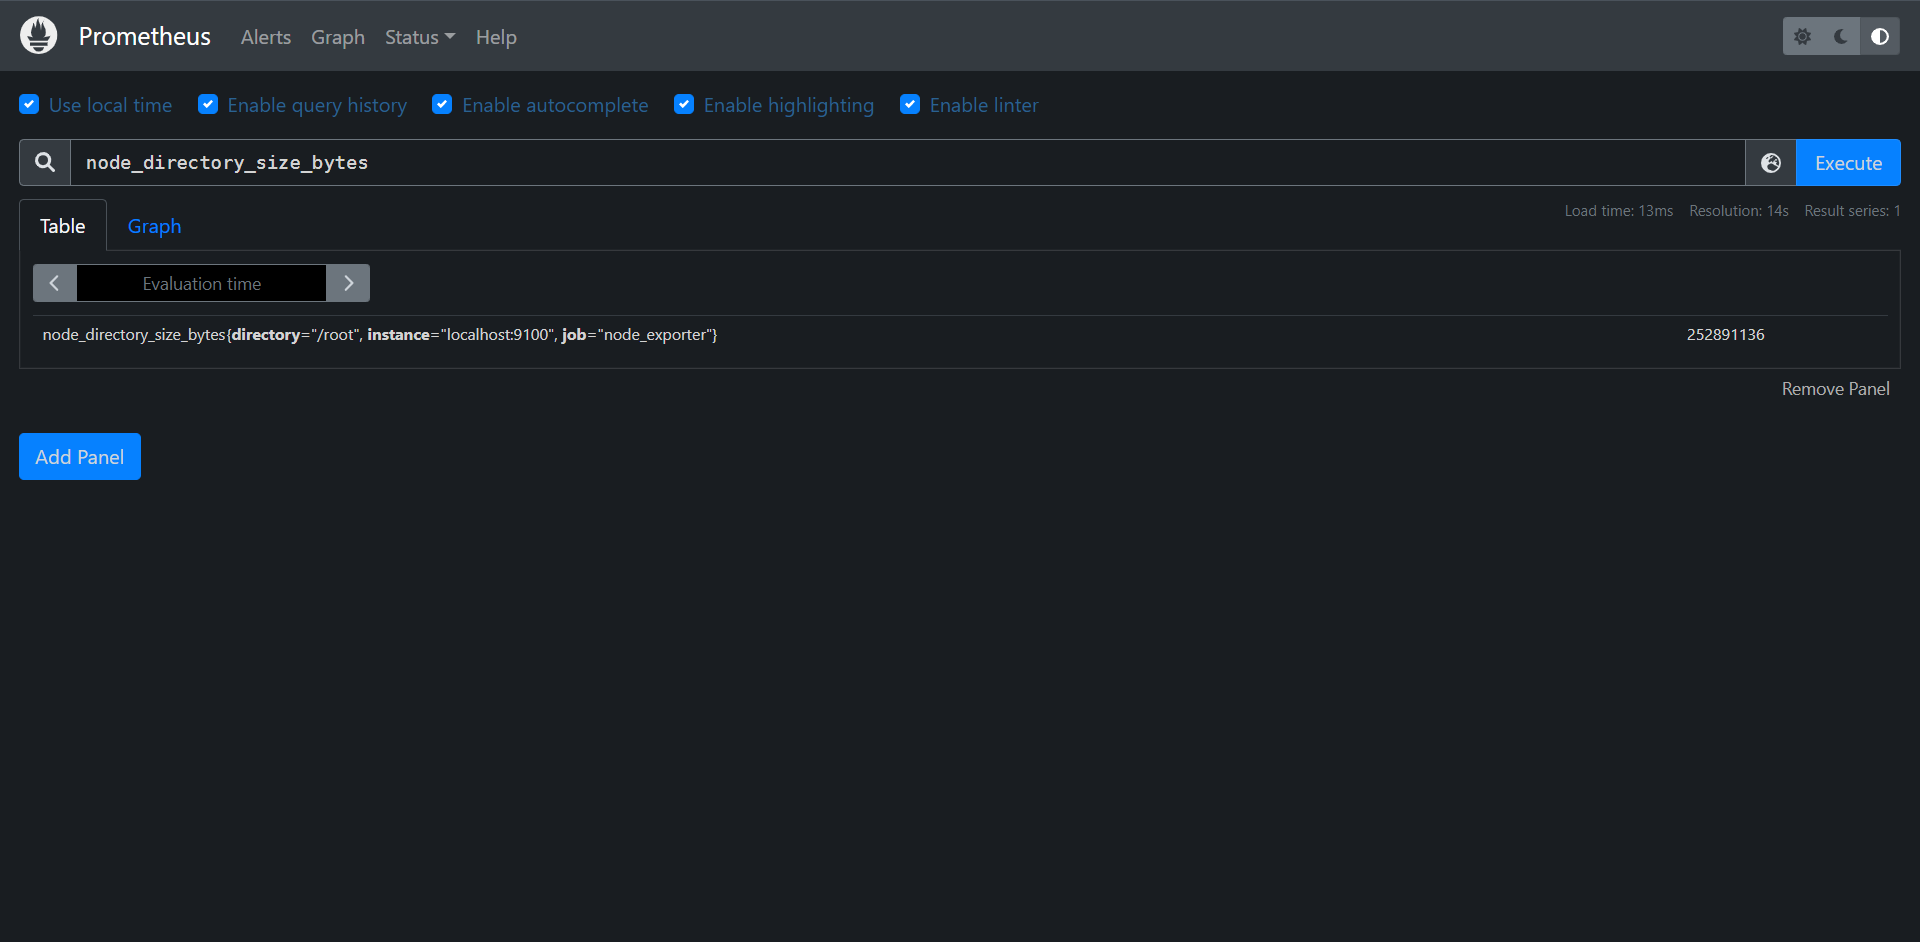
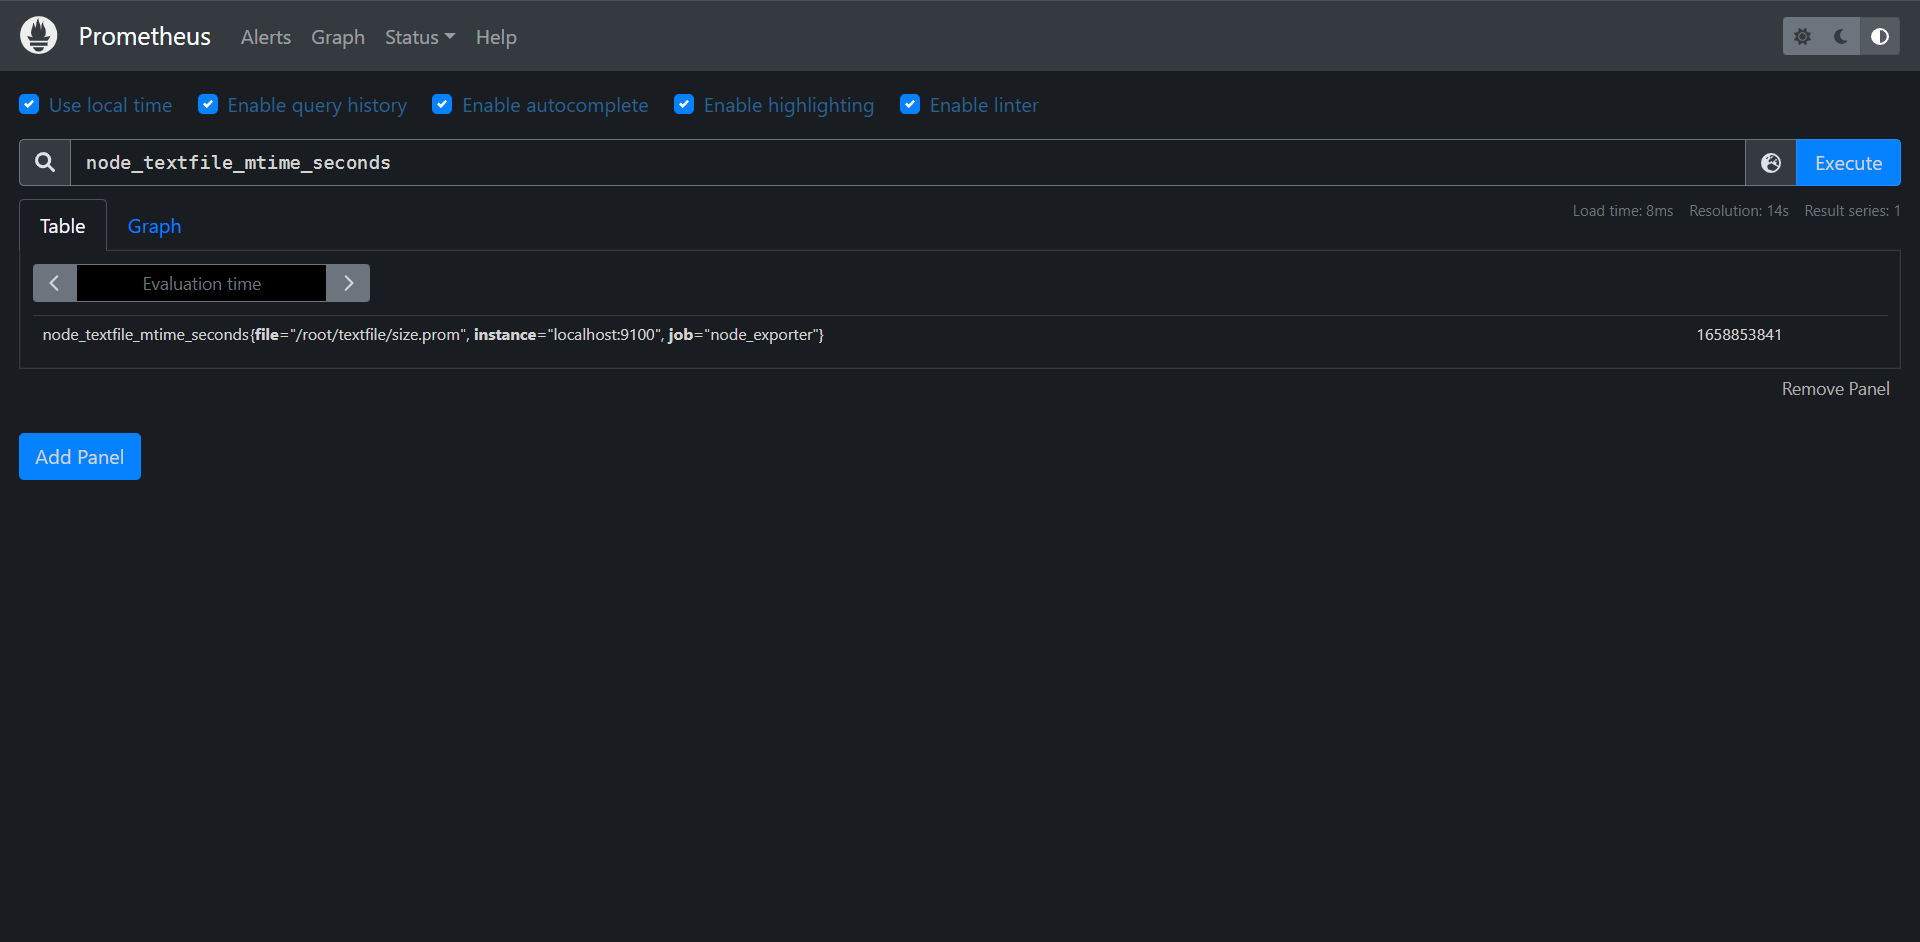
14:数据可视化
14.1:Grafana介绍及安装
14.1.1:Grafana介绍
Grafana是一个监控仪表系统,它是由Grafana Labs公司开发的的一个系统检测工具,它可以大大的帮助我们简化监控的复杂度,我们只需要提供监控的数据,它就可以帮助生成各种可视化仪表,同时它还具有报警功能,可以在系统出现问题的时候发出通知。

Grafana支持许多不同的数据源,每个数据源都有一个特定的查询编辑器,每个数据源的查询语言的能力是不同的,我们可以把来自多个数据源的数据组合到一个仪表盘,但每一个仪表盘被绑定到一个特定的数据源,目前官方支持以下数据源:

1:Alertmanager
2:AWS CloudWatch
3:Azure Monitor
4:Elastic search
5:Google Cloud Monitoring
6:Graphite
7:InfluxDB
8:Loki
9:Microsoft SQL Server (MSSQL)
10:MySQL
11:OpenTSDB
12:PostgreSQL
13:Prometheus
14:Jaeger
15:Zipkin
16:Tempo

当然了,我们这里重点还是讲Prometheus这个数据源。
14.1.2:Grafana安装
接下来呢我们就来安装以下Grafana,Grafana本身是非常的轻量级的,不会占用太多的资源,此外Grafana需要一个数据库来存储其配置数据,比如用户,数据源,仪表盘等,目前Grafana支持SQLite,MySQL,PostgreSQL三种数据库,当然了默认还是用的SQLite数据库,该数据文件会存在Grafana安装位置,所以需要对Grafana的安装目录进行持久化。

当然了安装Grafana的方式有很多,我们这里使用的CentOS系统,可以在Grafana官方下载筛选合适的版本

https://grafana.com/grafana/download?pg=get&plcmt=selfmanaged-box1-cta1

这里我们直接用RPM部署:

wget https://dl.grafana.com/enterprise/release/grafana-enterprise-9.0.5-1.x86_64.rpm
# 此命令会自动解决依赖
yum localinstall -y grafana-enterprise-9.0.5-1.x86_64.rpm

完成之后我们可以使用systemd来管理Grafana
systemctl daemon-reload
systemctl start grafana-server.service

访问:http://ip:3000
# 此配置可以在启动前改
账号:admin
密码:admin

下图会让更改新的密码
完成之后如下图
grafana如果要实现高可用的话,那么SQLite数据是不行的,需要切换数据库到MySQL或者PostgreSQL,我们可以在Grafana配置内的[database]部分找到数据库的相关配置,Grafana会将所有长期数据保存在数据库中,然后部署多个Grafana实例使用同一个数据库即可实现高可用。
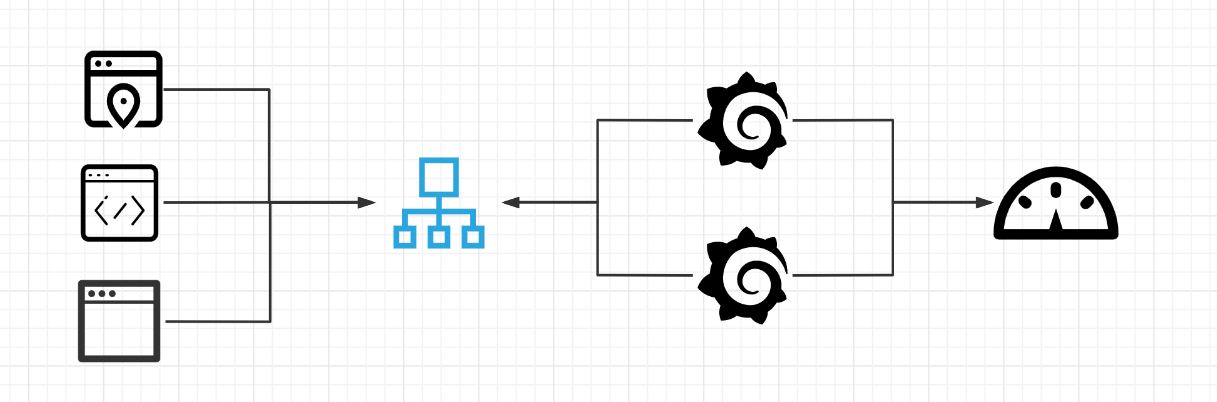
14.2:创建图形面板
面板(Panel)是Grafana中基本可视化构建块,每个面板都有一个特定于面板中选择数据源的查询编辑器,每个面板都有各种各样的样式和格式选项,面板可以在仪表盘上拖放和重新排列,它们也可以调整大小,所以要在Grafana上创建可视化图表,面板是我们必须掌握的技能。
14.2.1:数据源
在创建面板之前我们需要指定为我们的面板的数据源,Grafana支持多种数据源,我们这里当然还是使用Prometheus作为我们这次的重点,接下来我们来配置一下数据源

1:左侧工具栏选择 Configuration
2:点击 Data sources
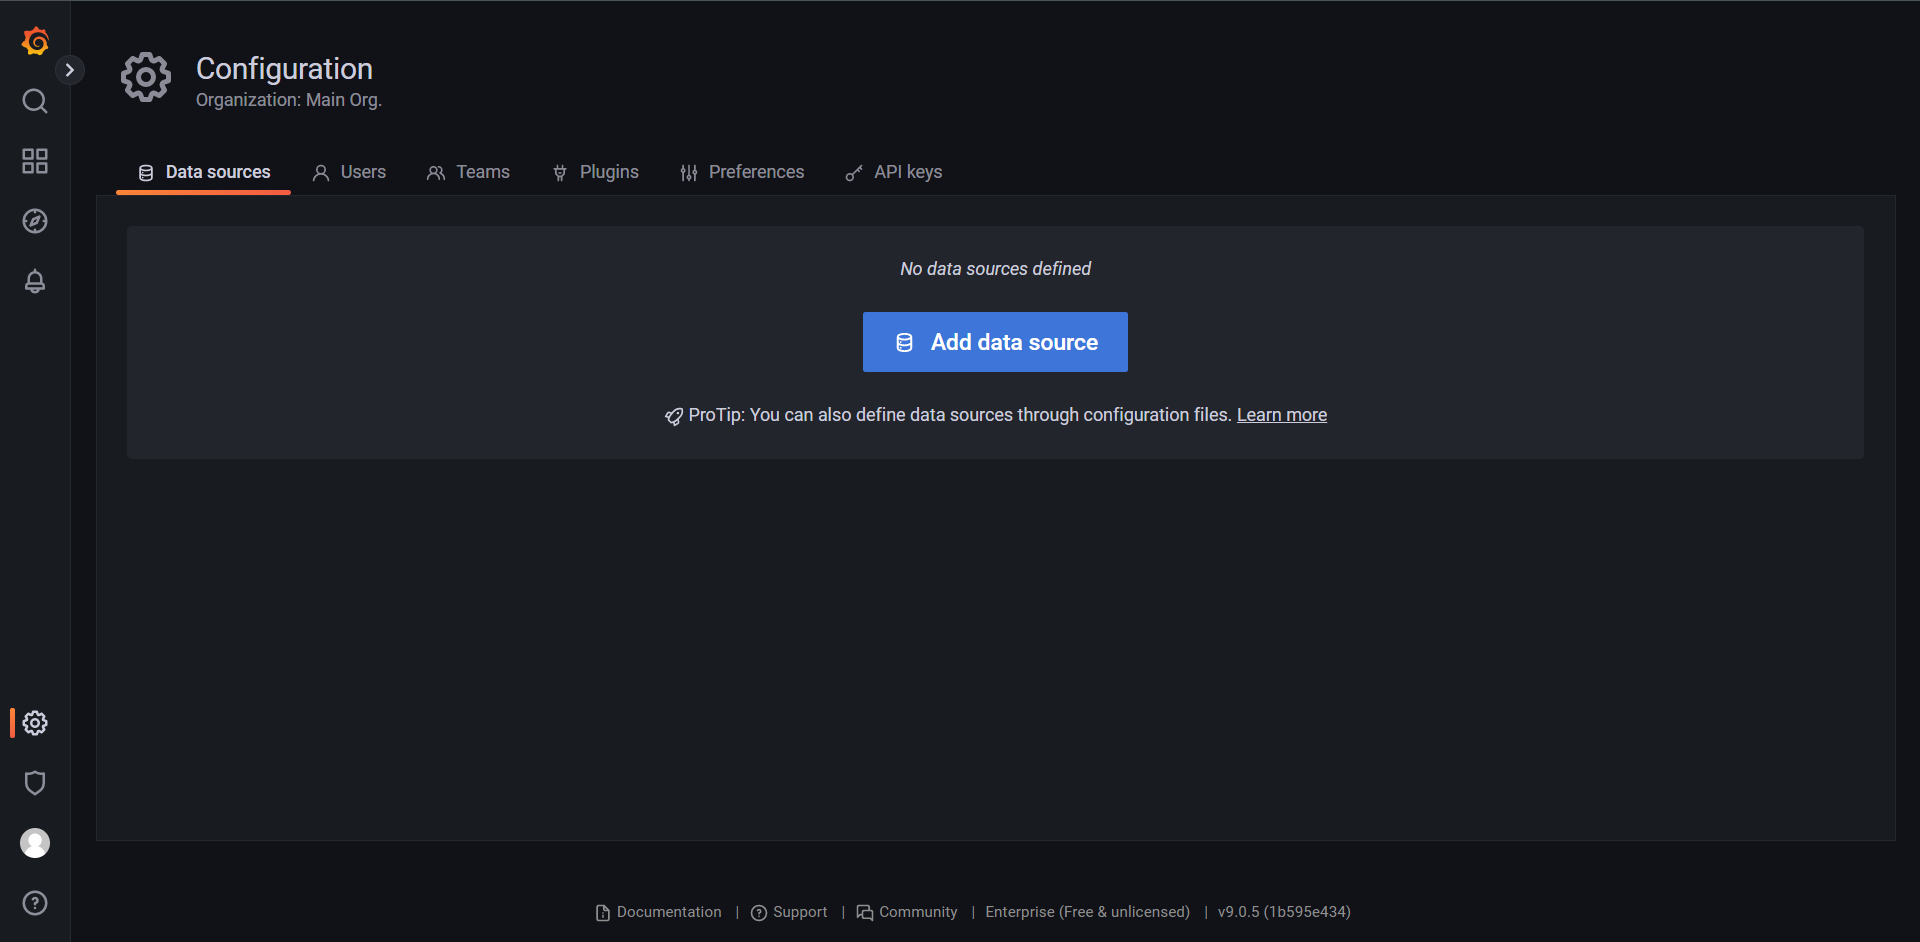
3:点击 Add Data source
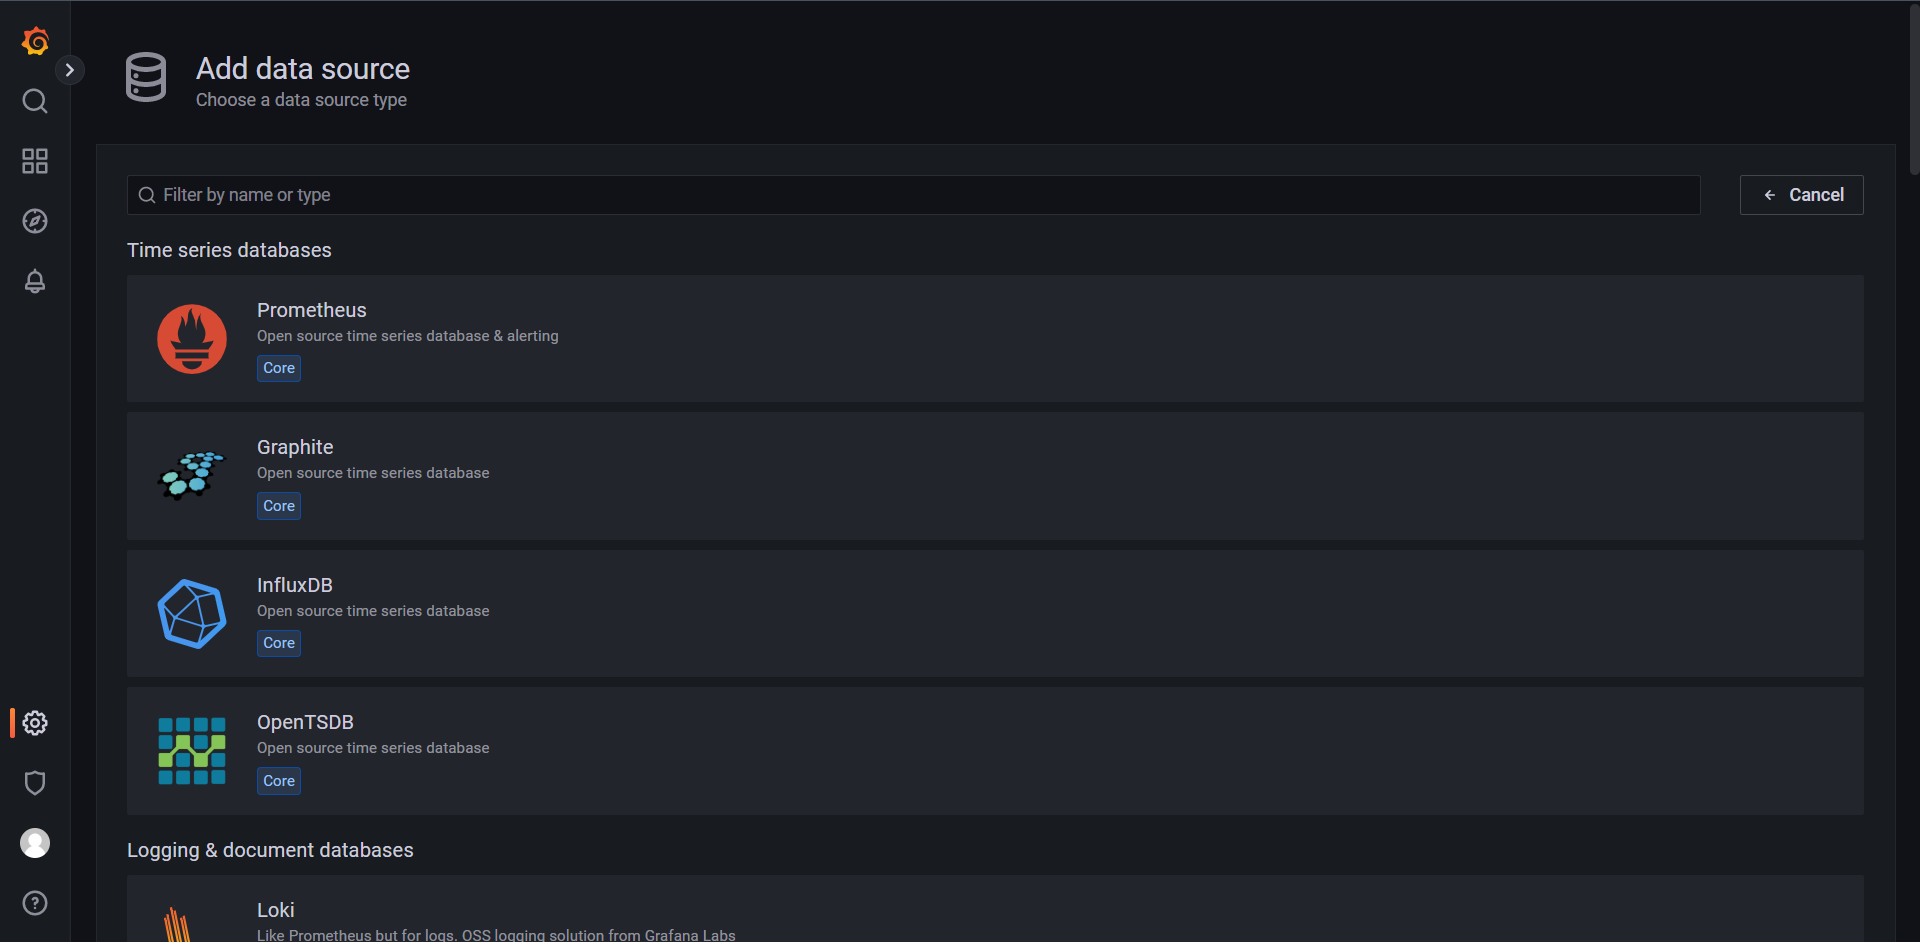
Grafana原生支持Prometheus,我们可以直接选择Prometheus
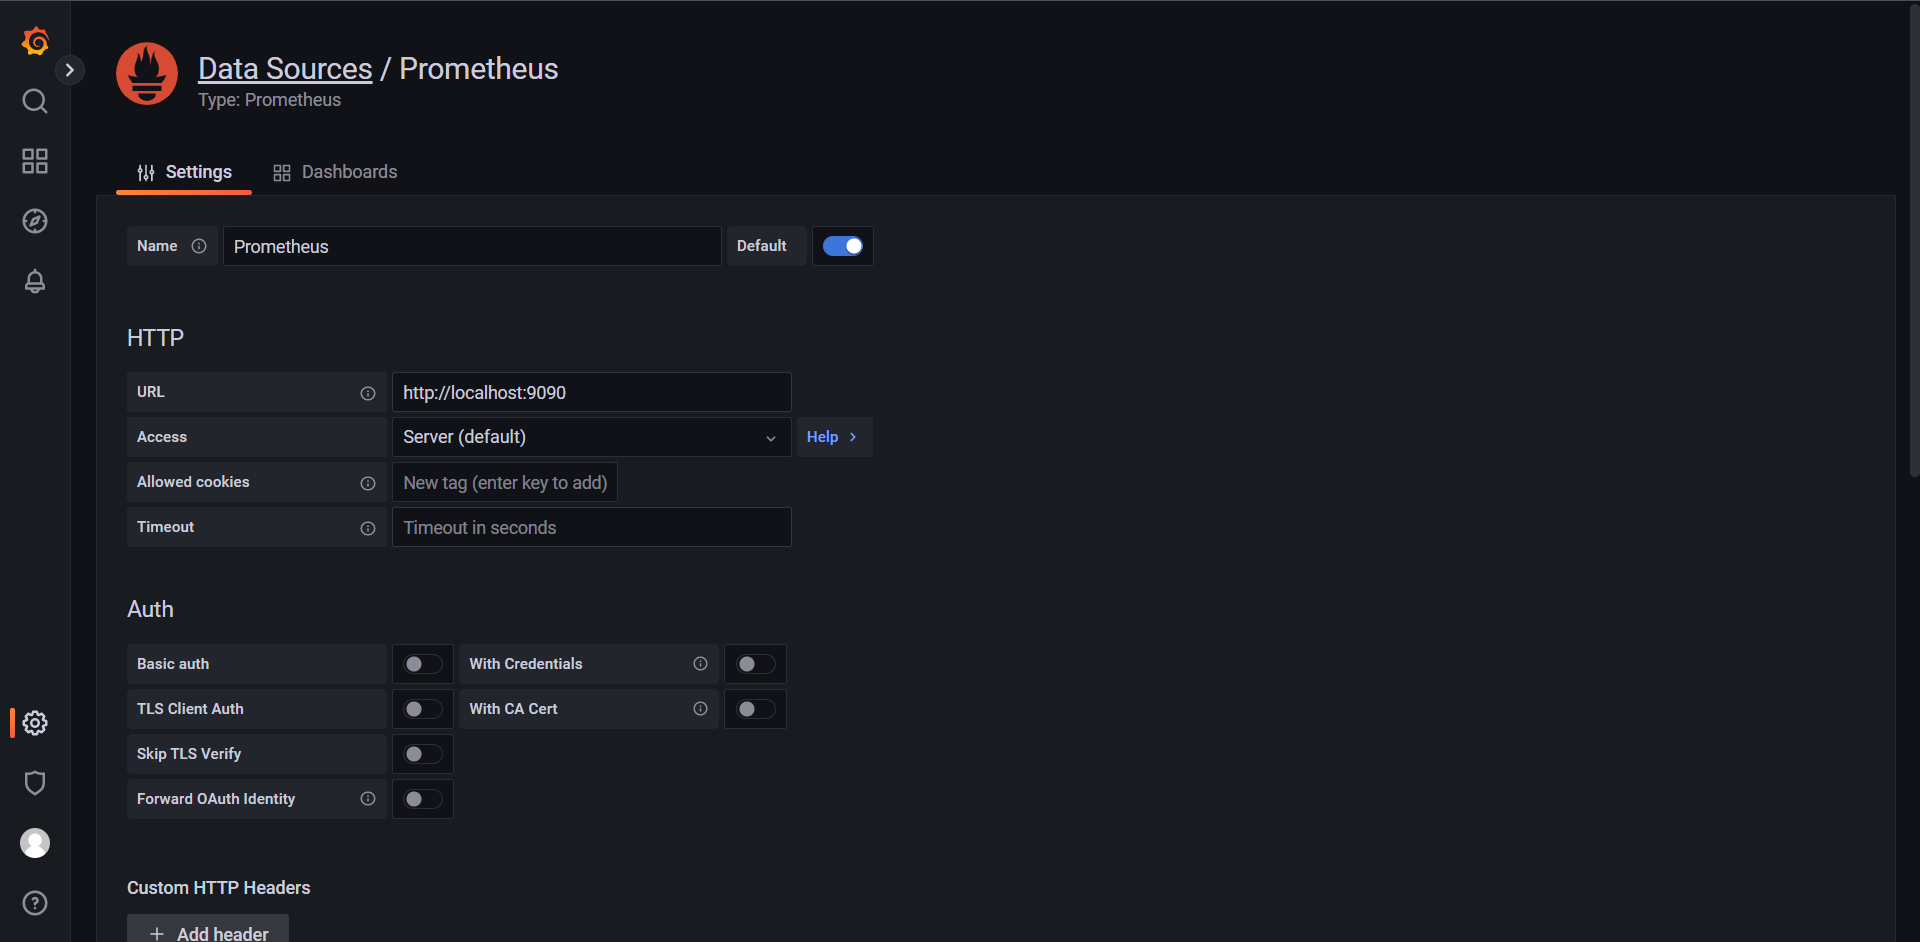
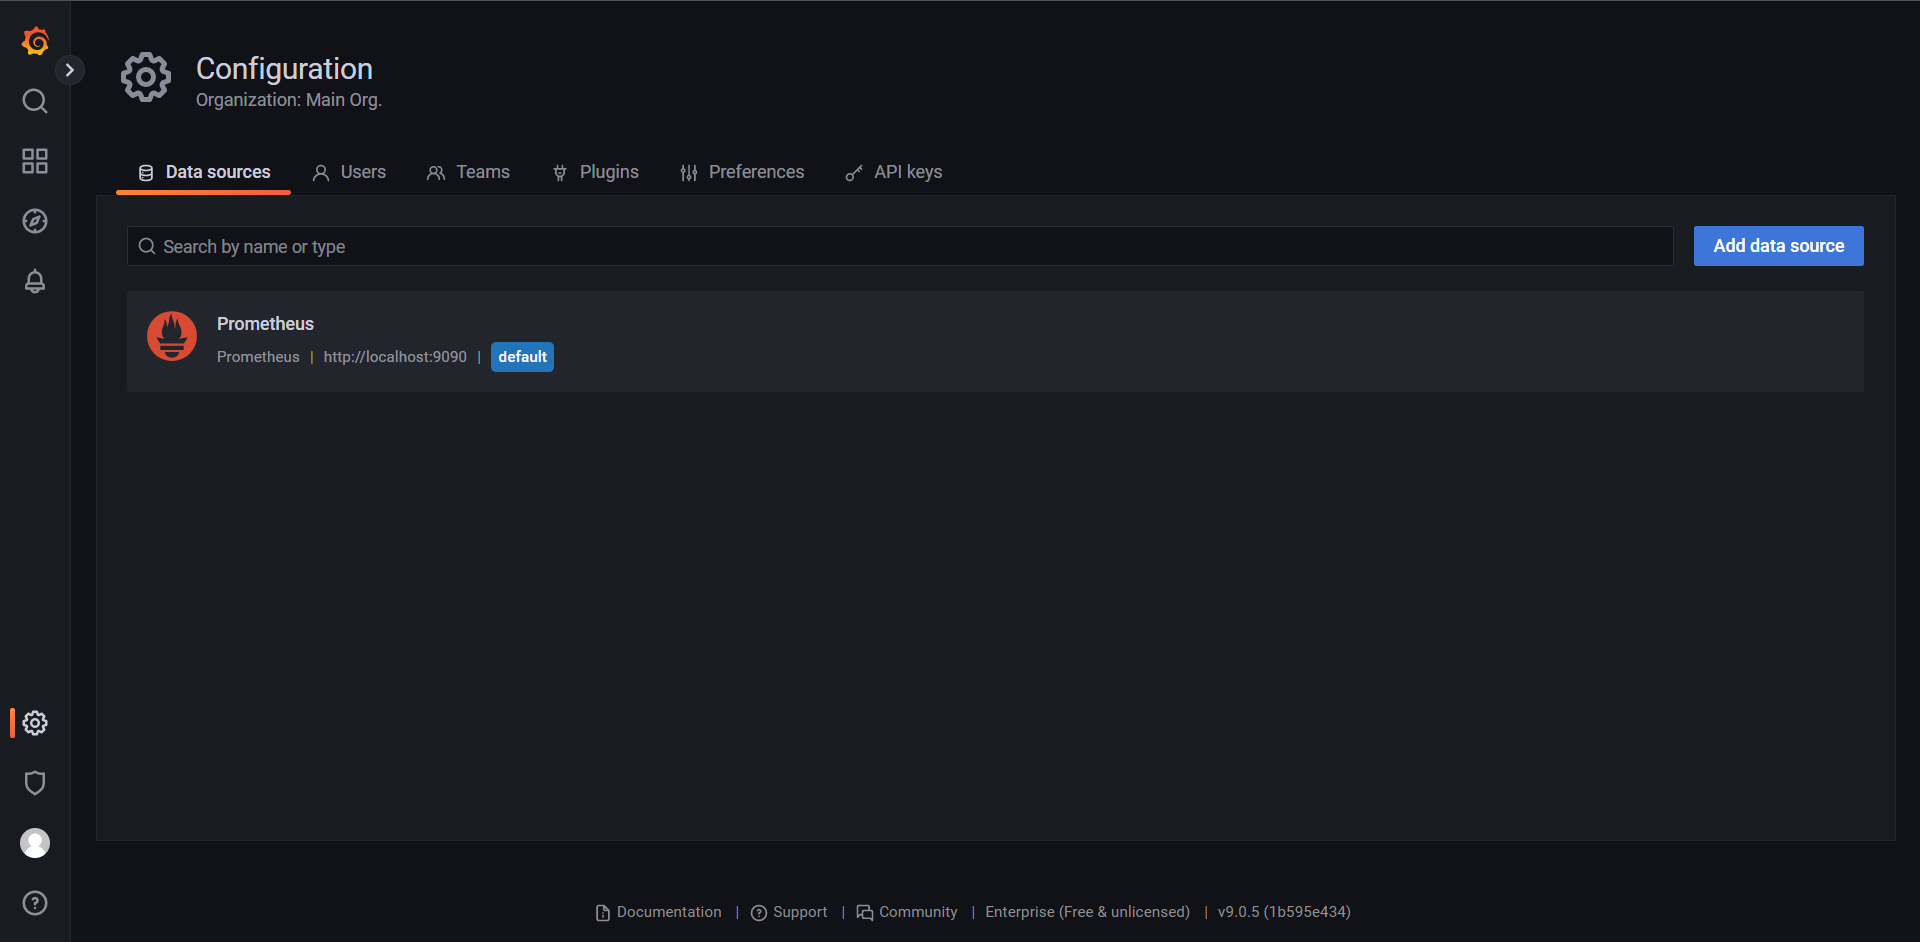
这里就不详细讲解里面的其他配置了,主要配置的信息就是 Name和URL
14.2.2:创建Dashboard
左侧选择Dashboard,然后点击New Dashboard
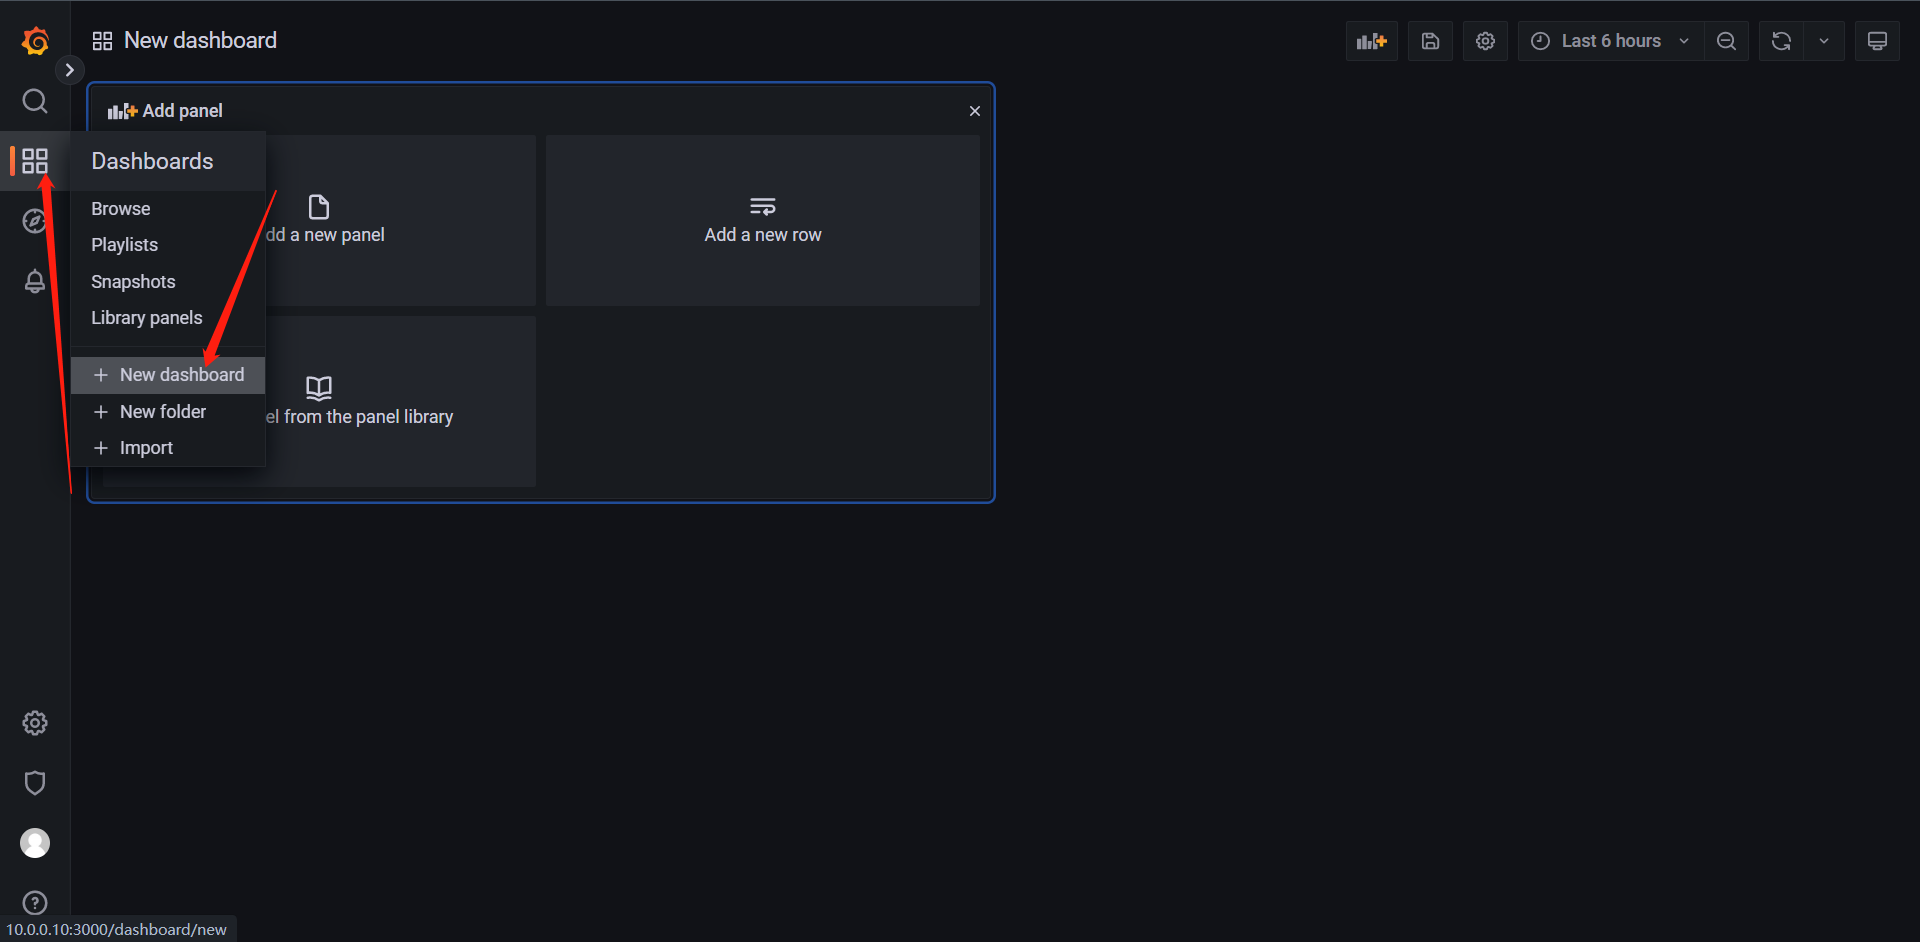
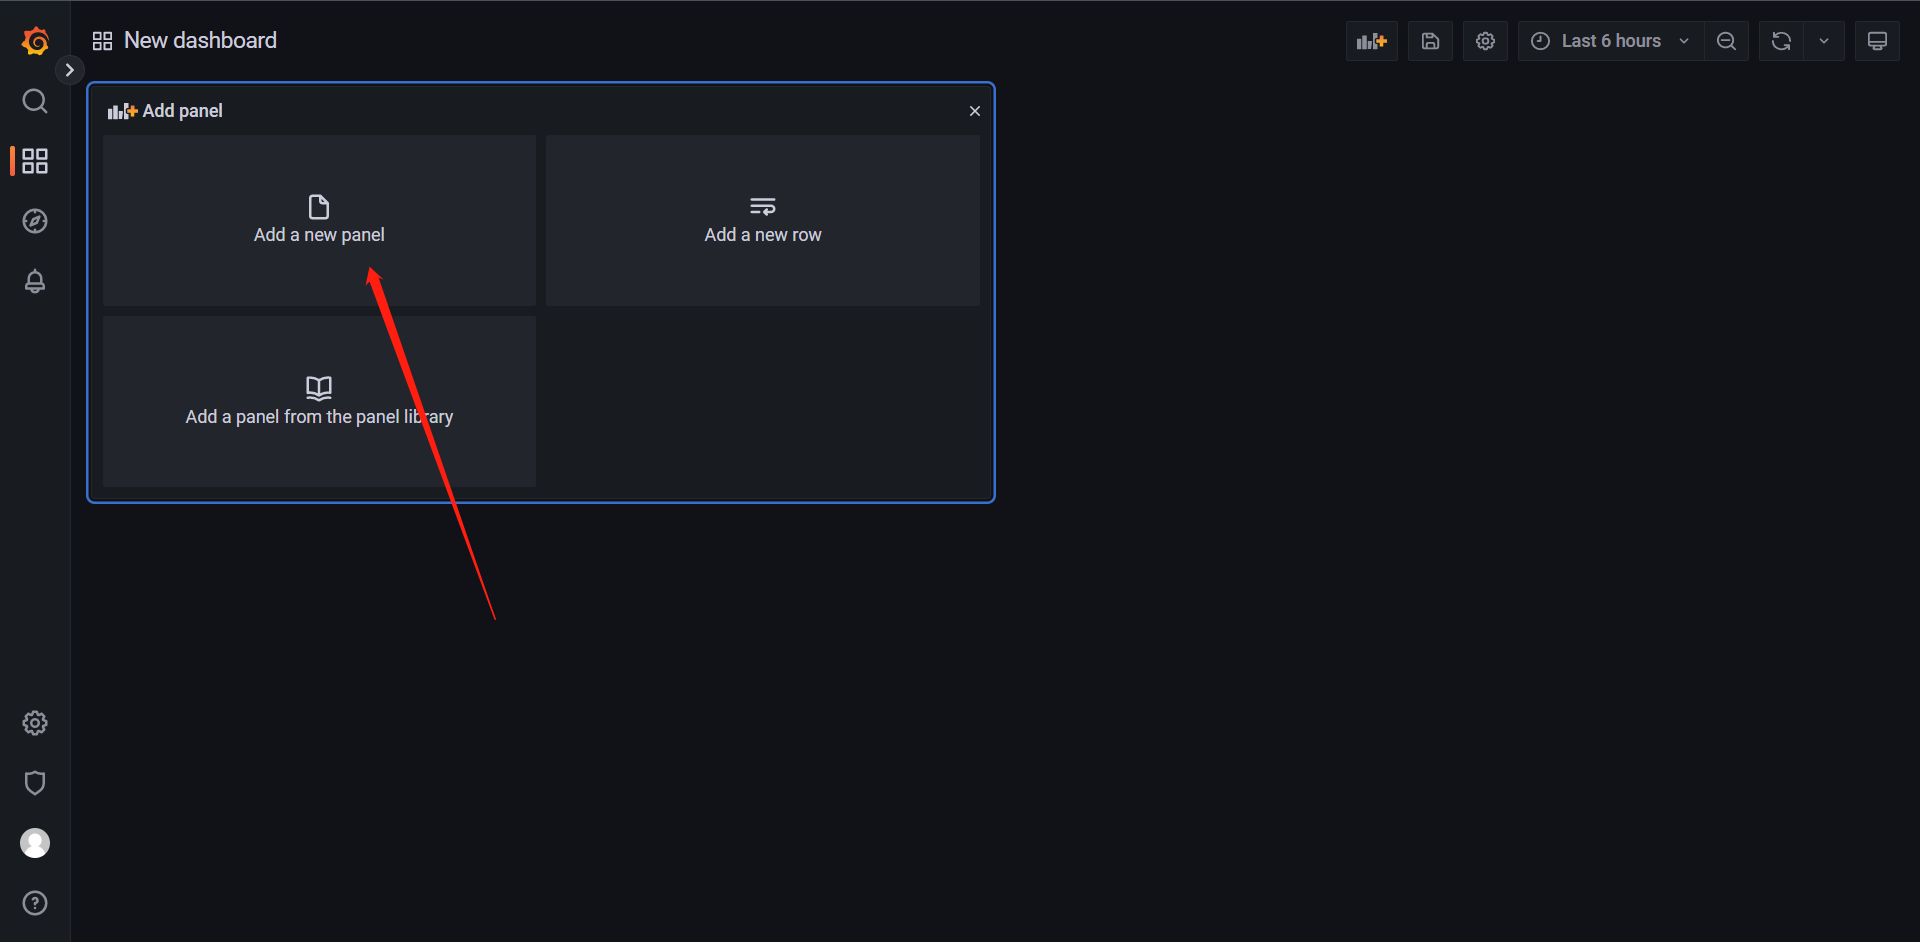
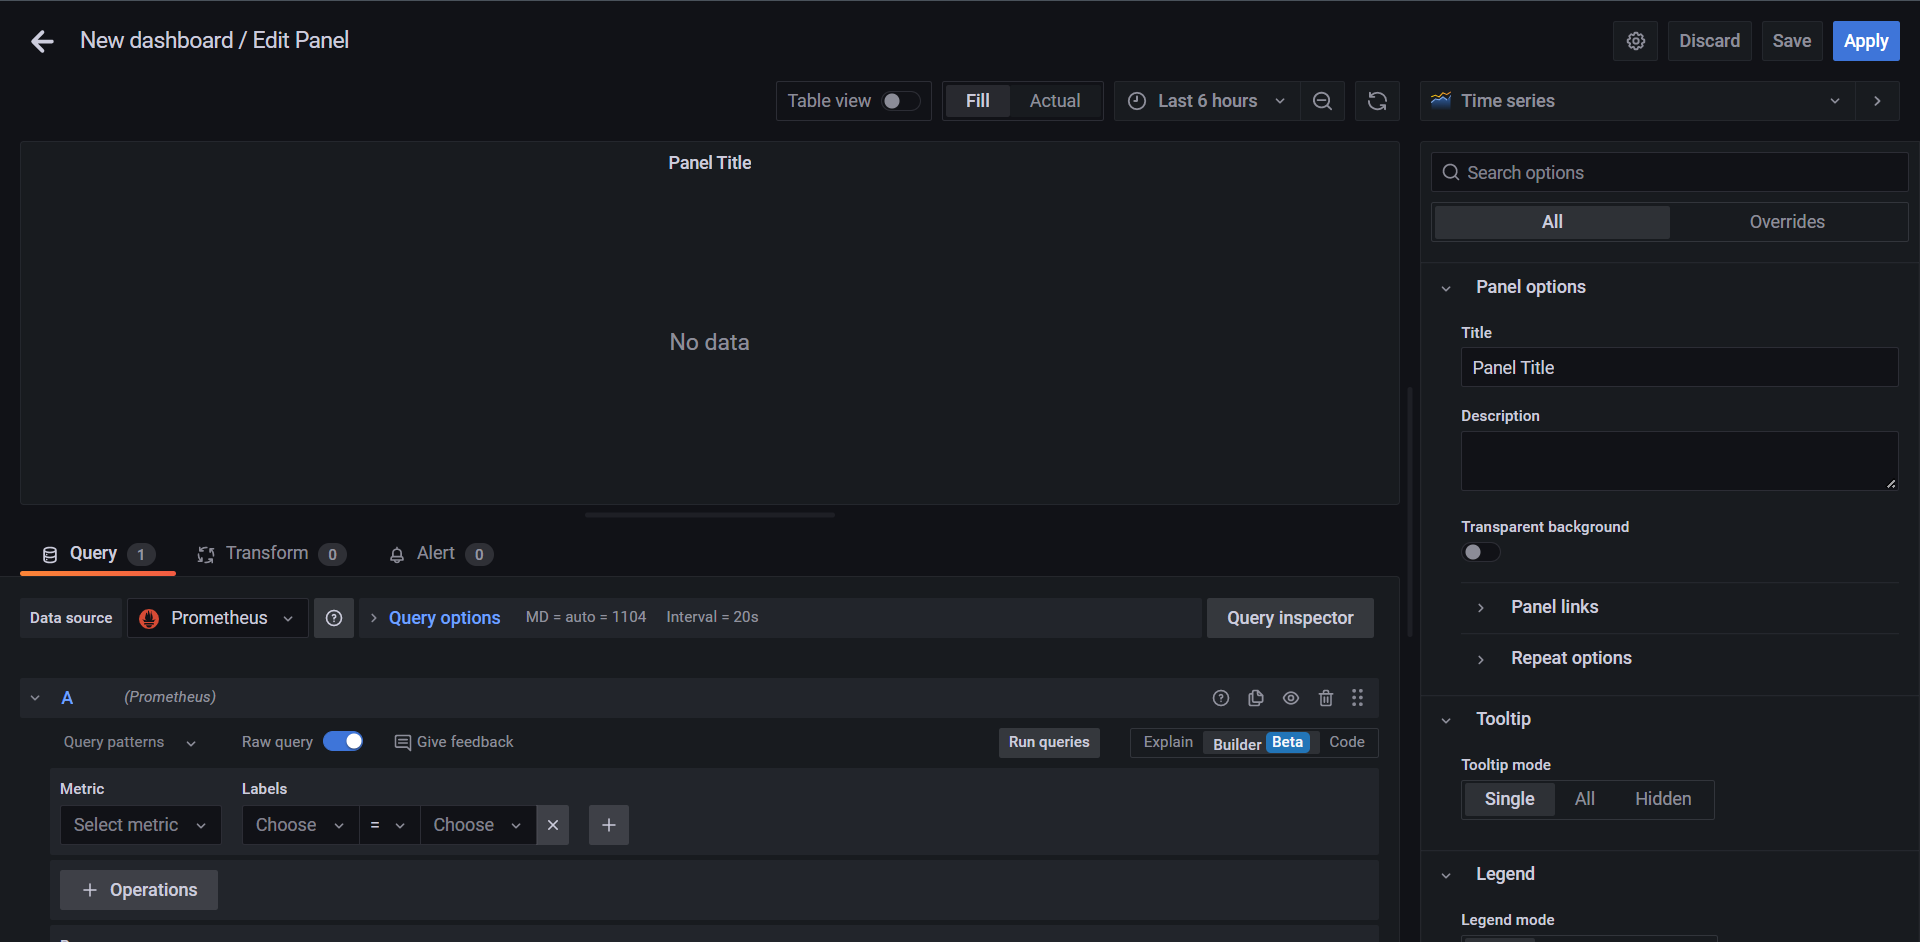
接下来我们来查询一下CPU的使用率来看看,其实就是把我们上面的一些PromQL搬下来

PromQL:
(1 - sum (increase(node_cpu_seconds_total{mode="idle"}[1m])) by(instance) / sum (increase(node_cpu_seconds_total[1m])) by(instance)) * 100

这里出了点小问题,我选择了老版本的Grafana换成了8.5.0

其实变化不大
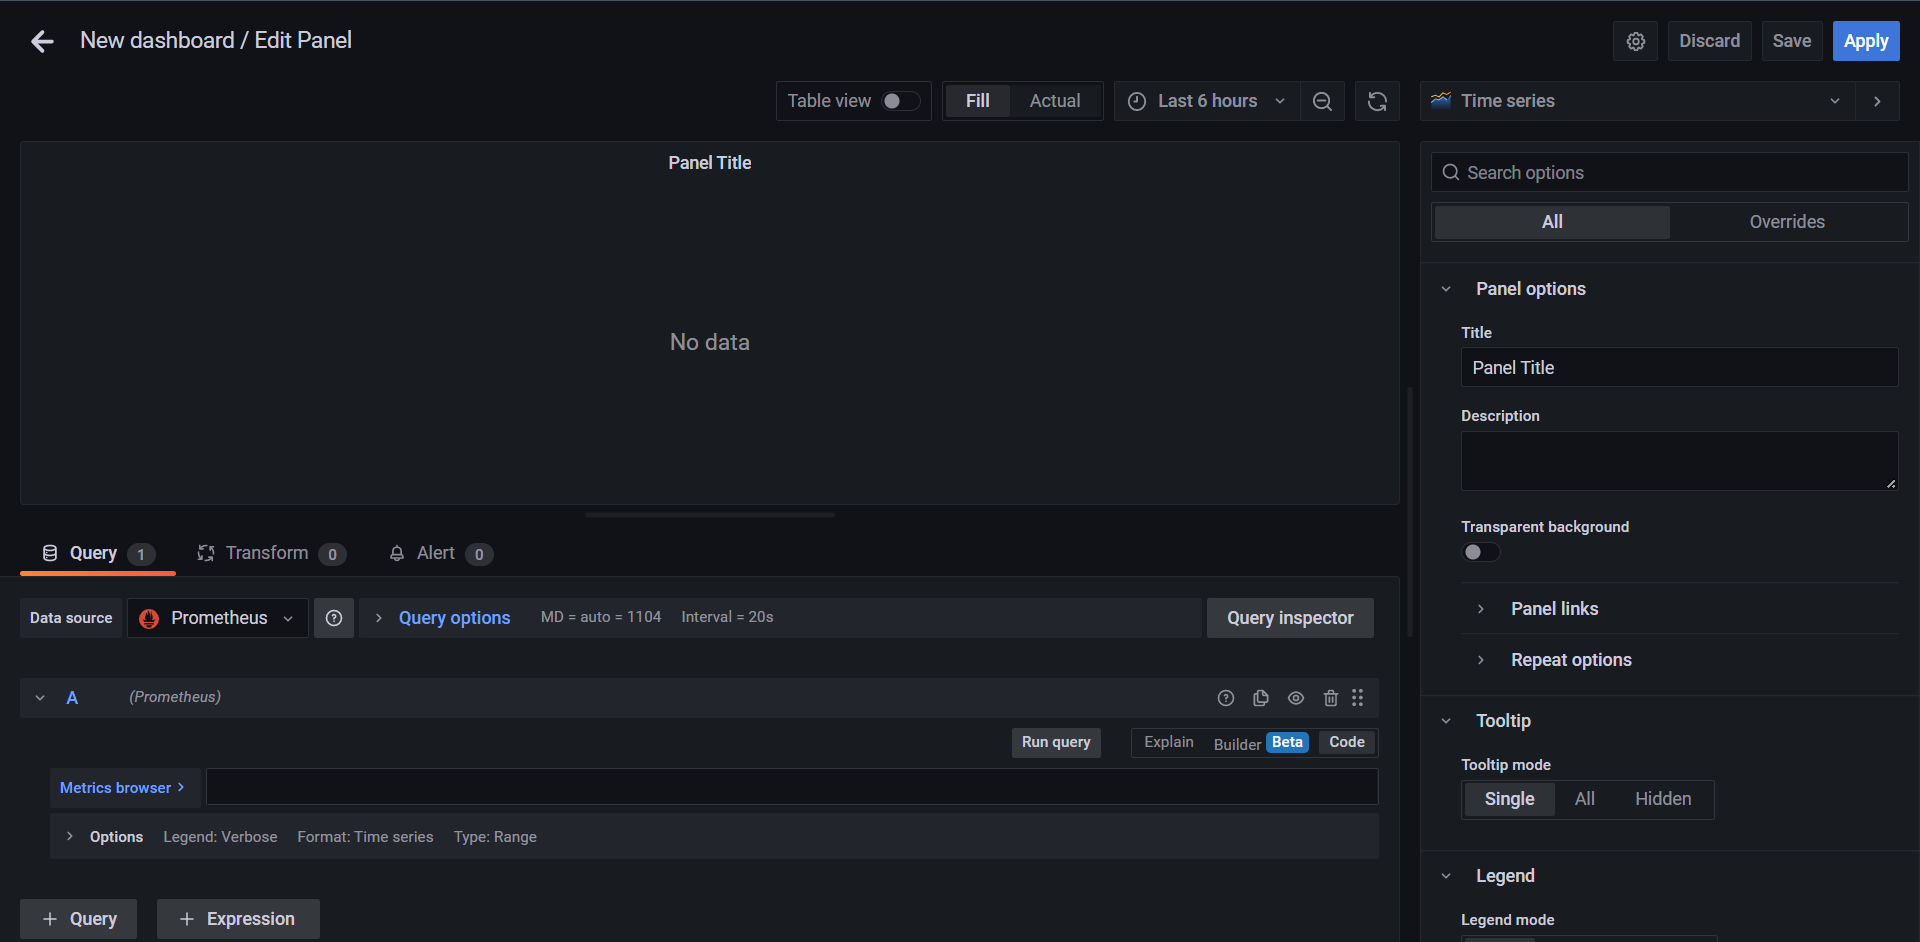
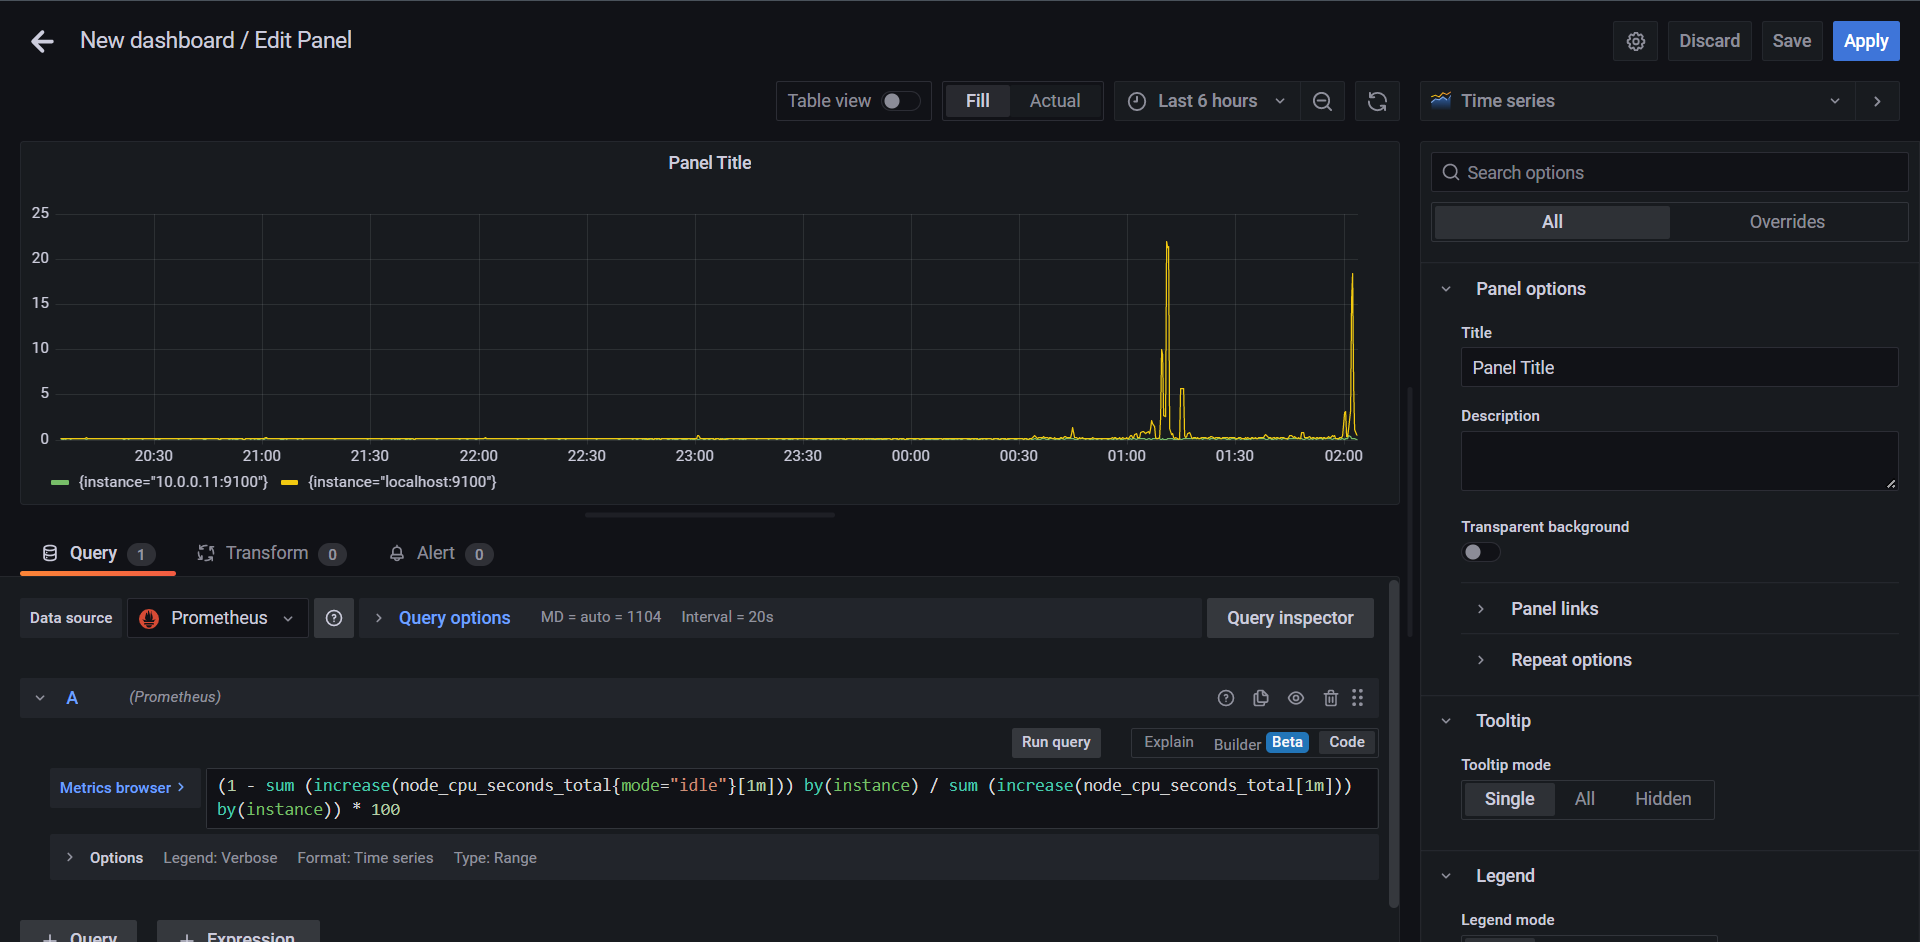
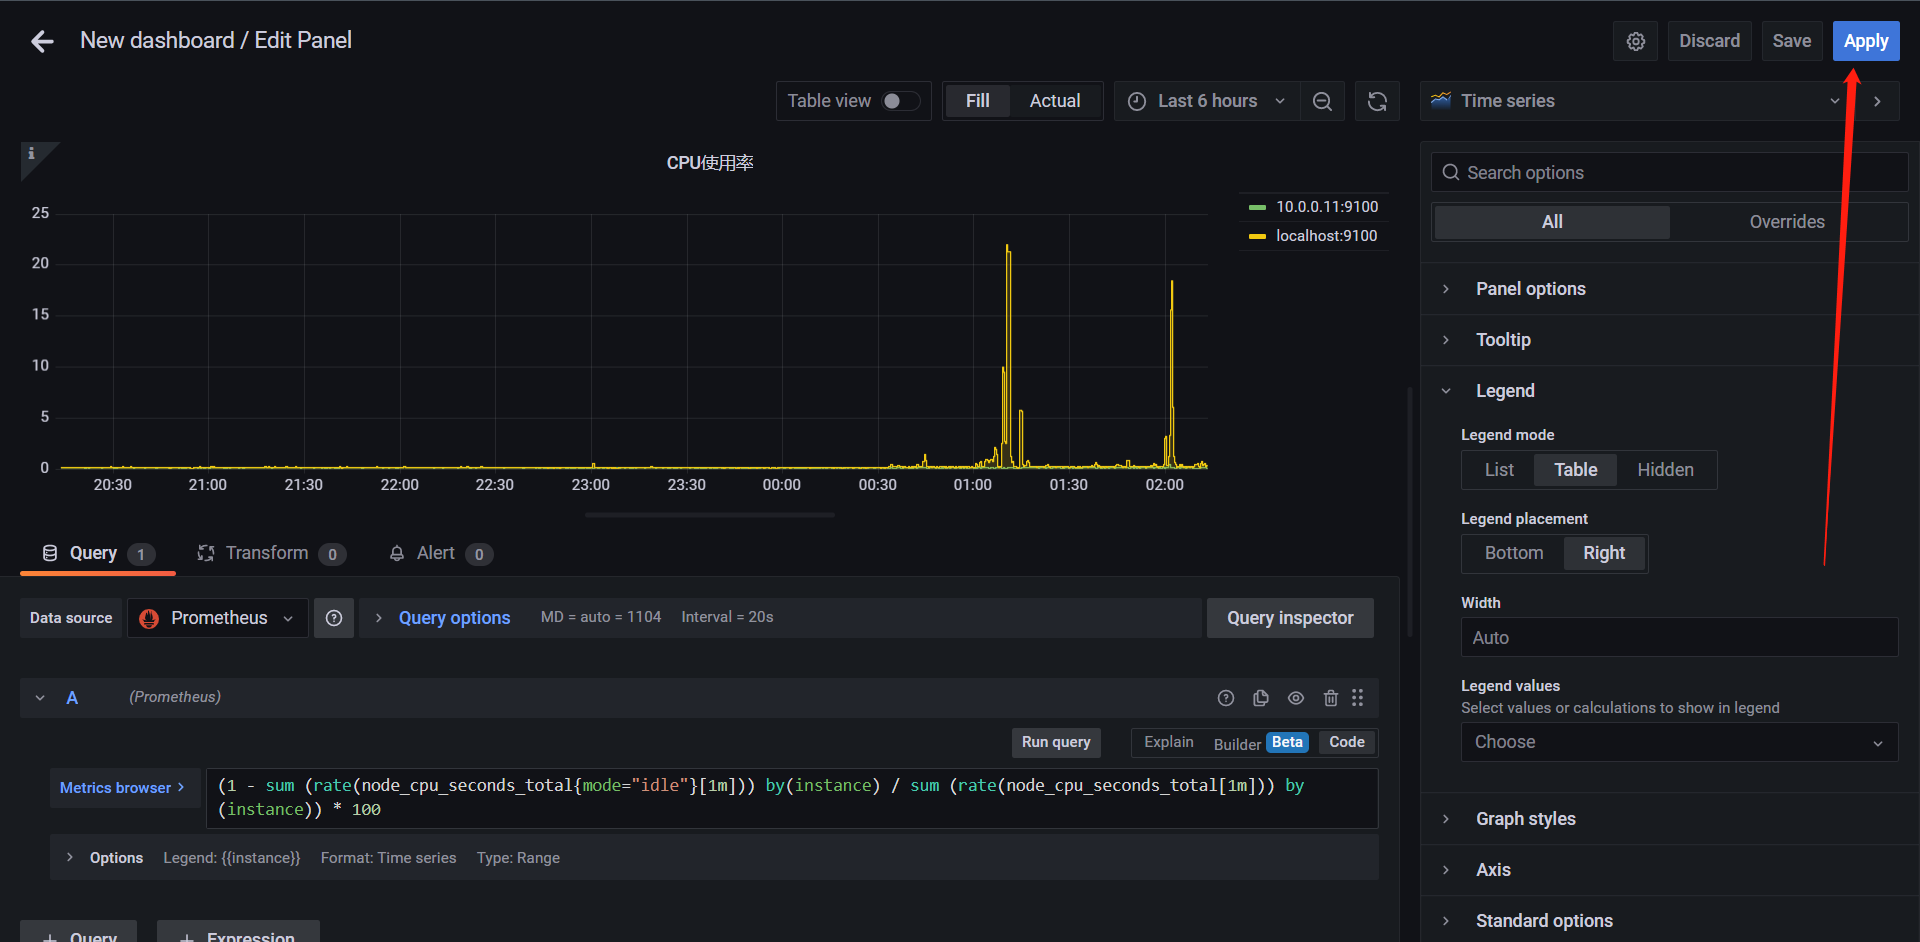
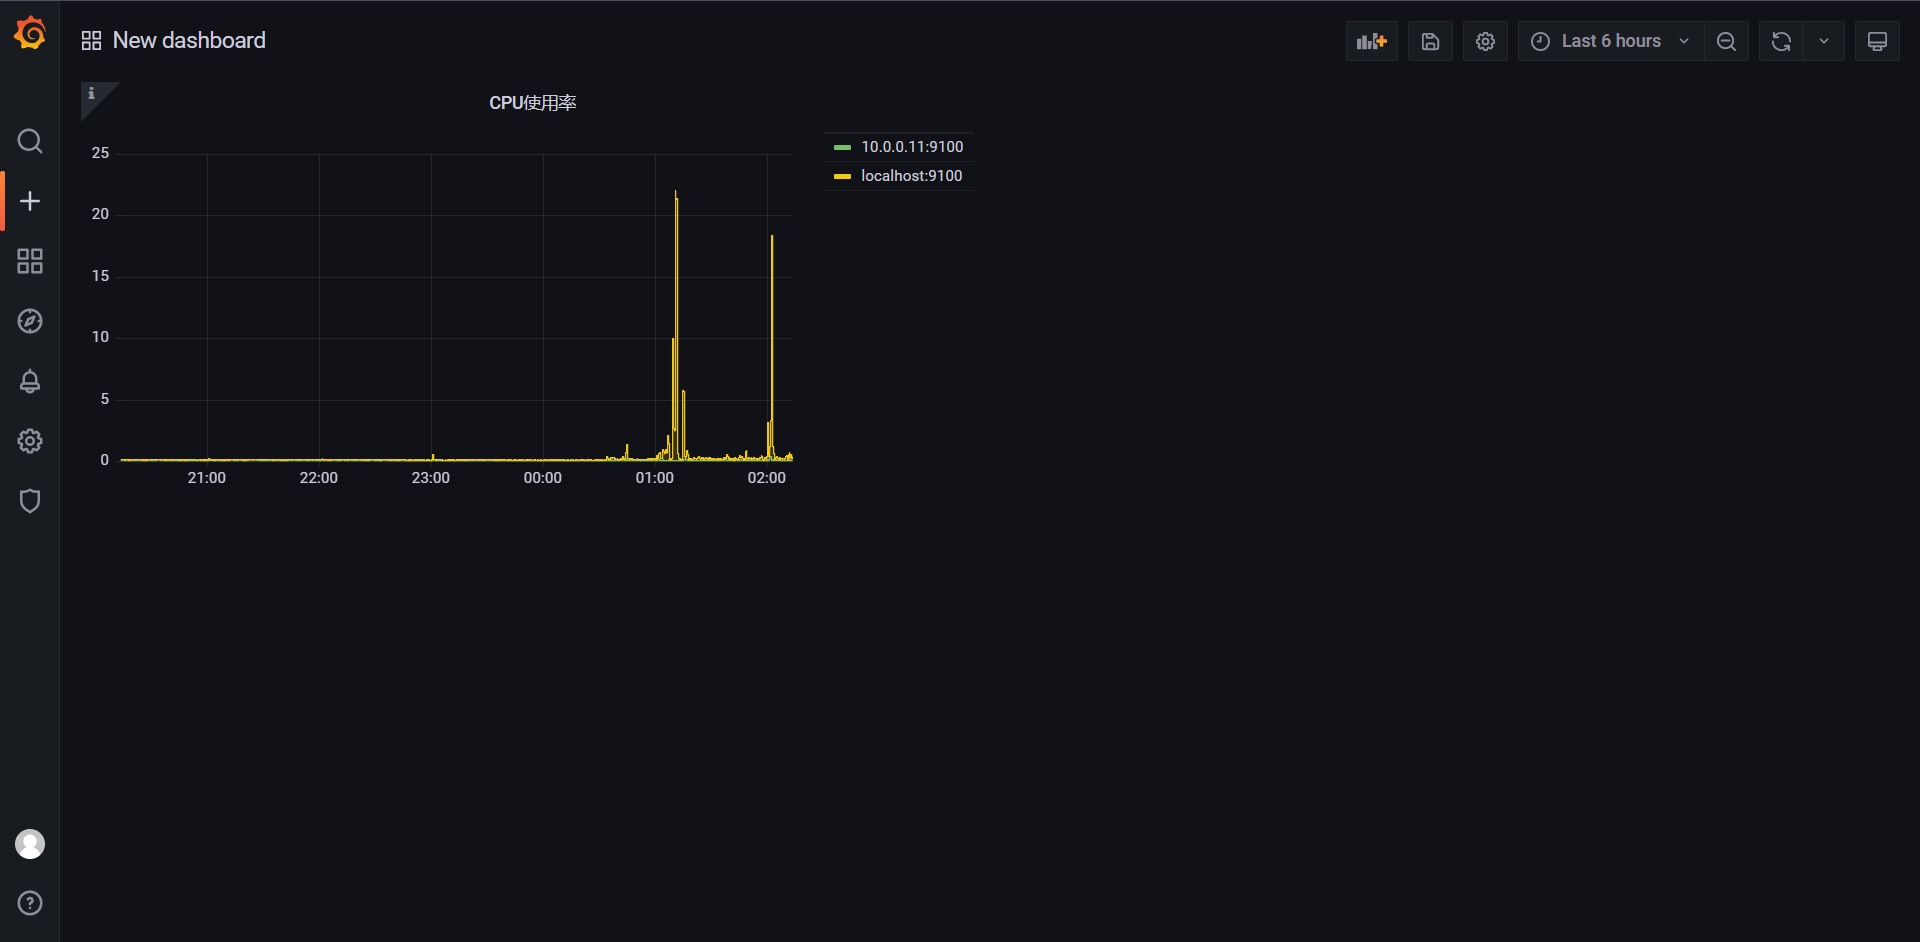
同样的方法我们再次创建一个
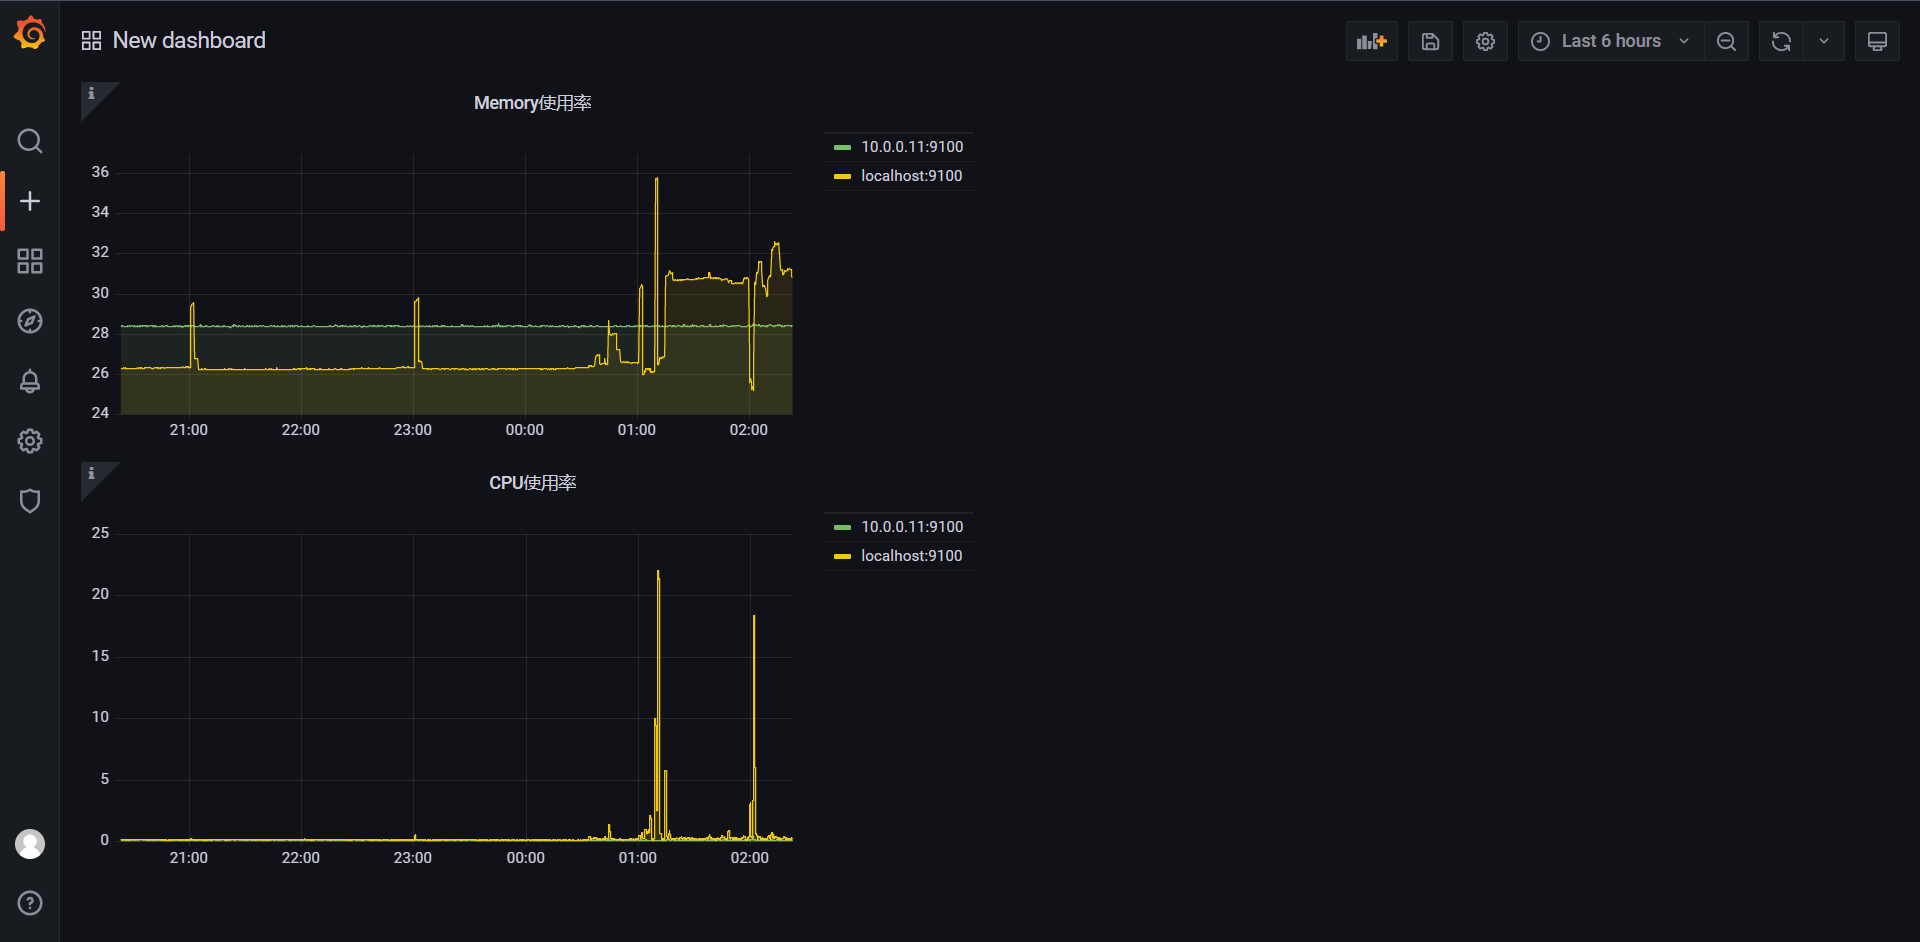
这里的Panel是可以随意调大小和拖动的
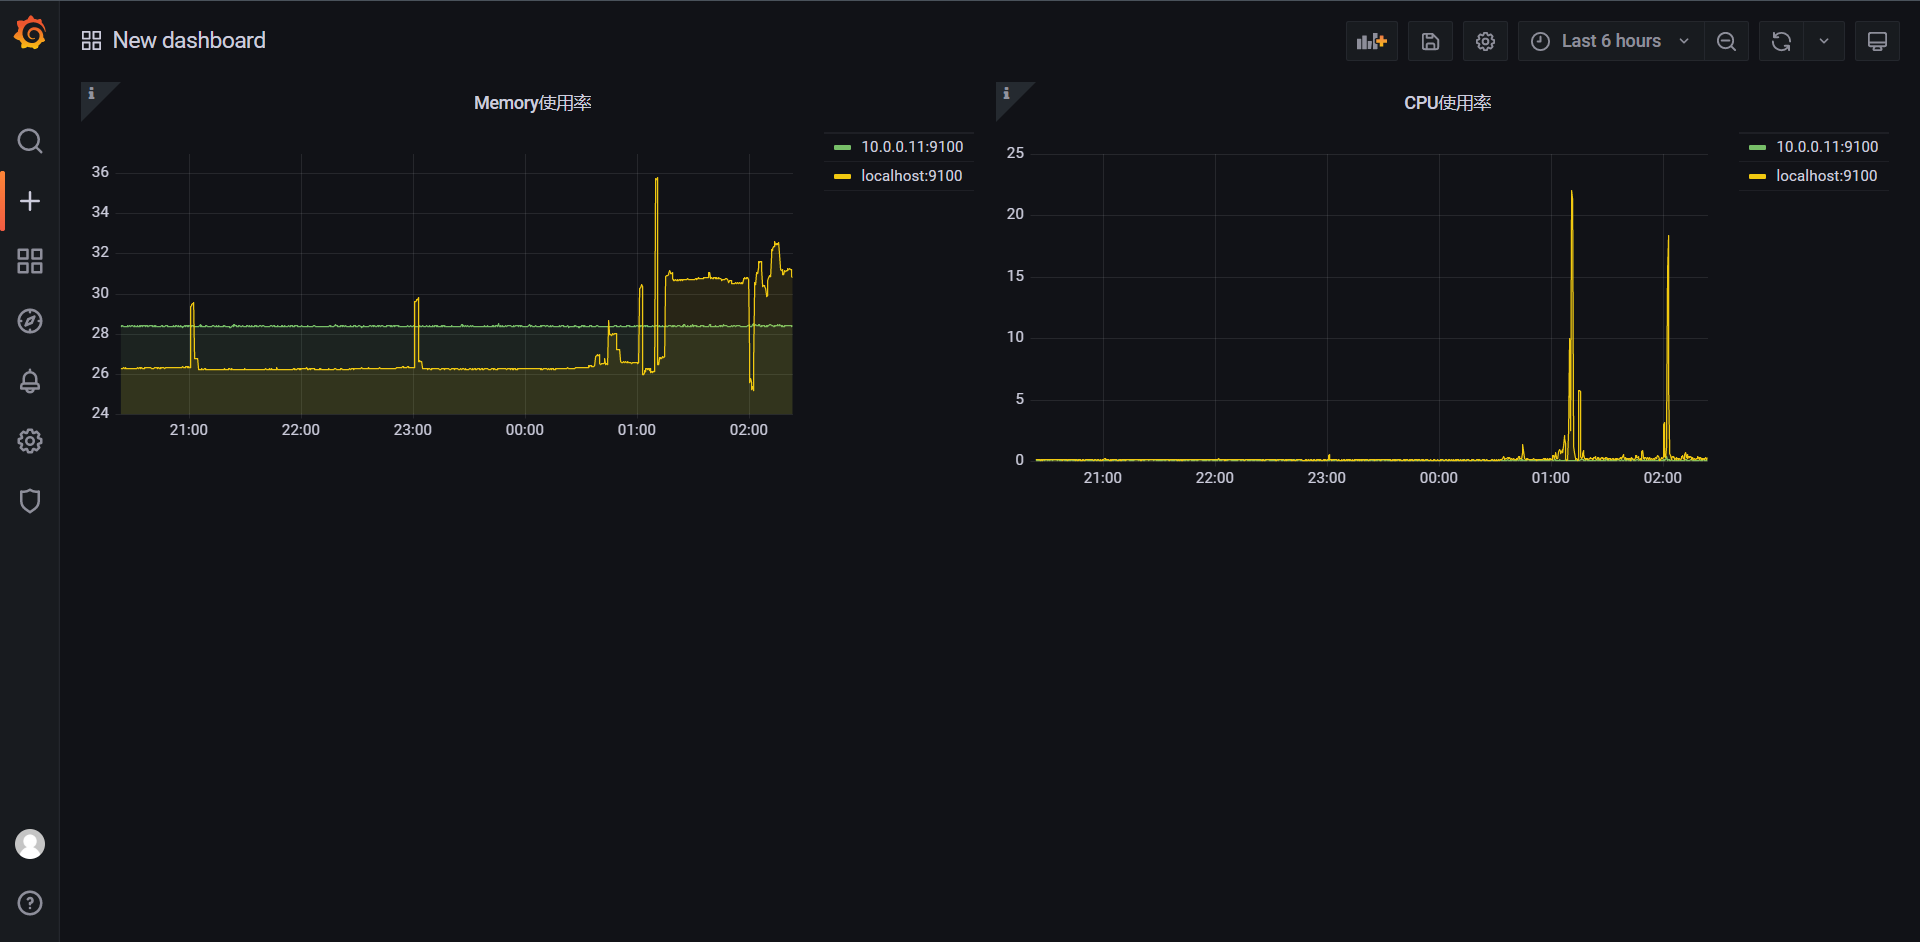
14.2.3:图形参数配置
因为可能涉及到我们的主机会比较多,所以集合在一起的话不太直观,所以我们完全可以通过参数来实现各个主机展示各个图标
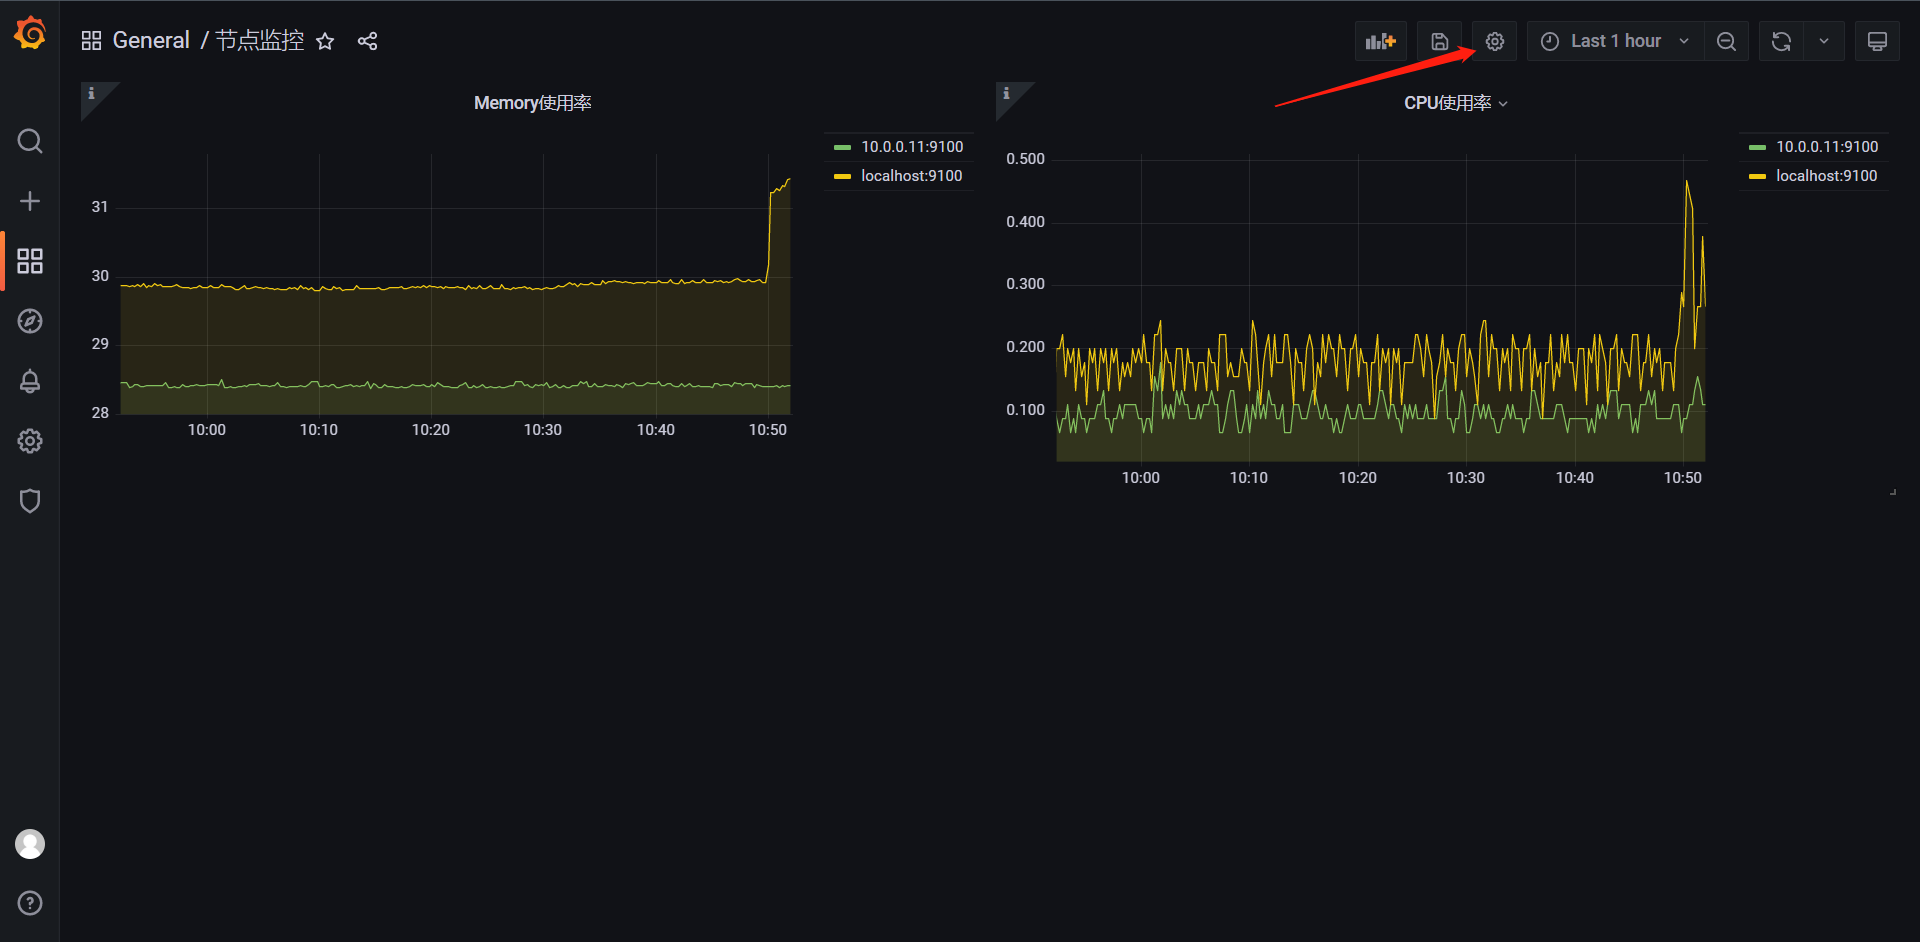
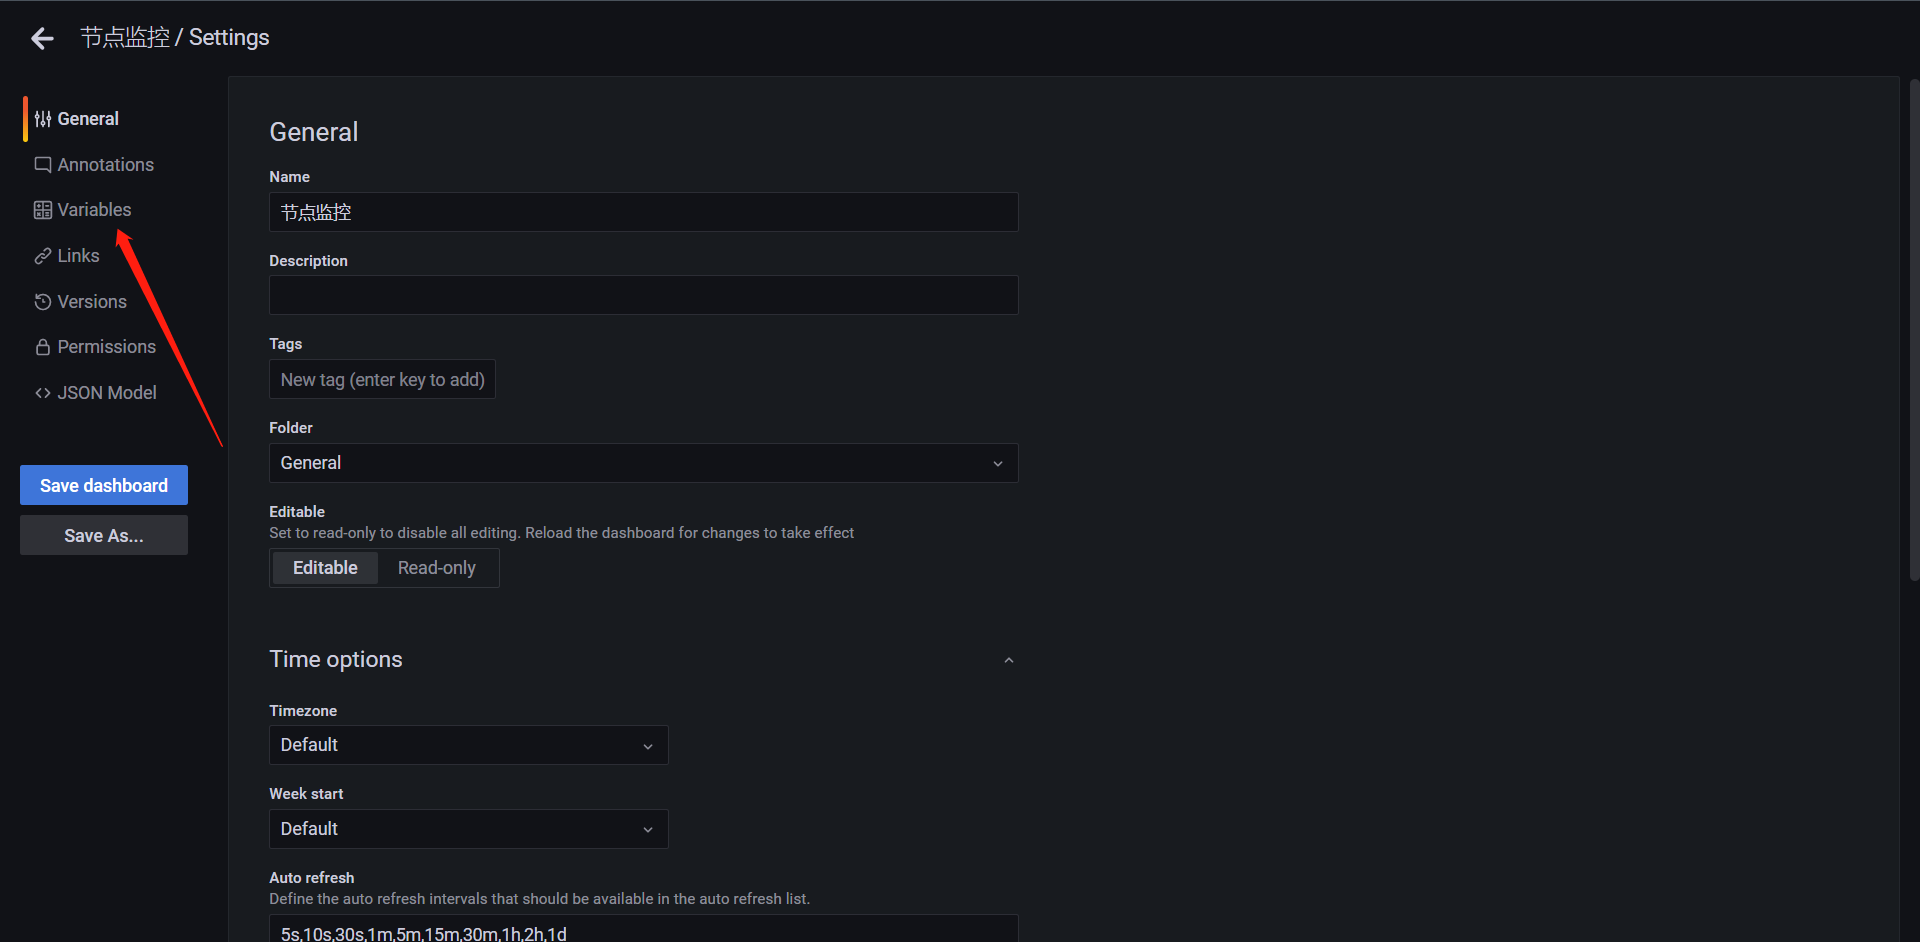
简单介绍一下这里的内容:

1:Name:变量名
2:Type:变量类型
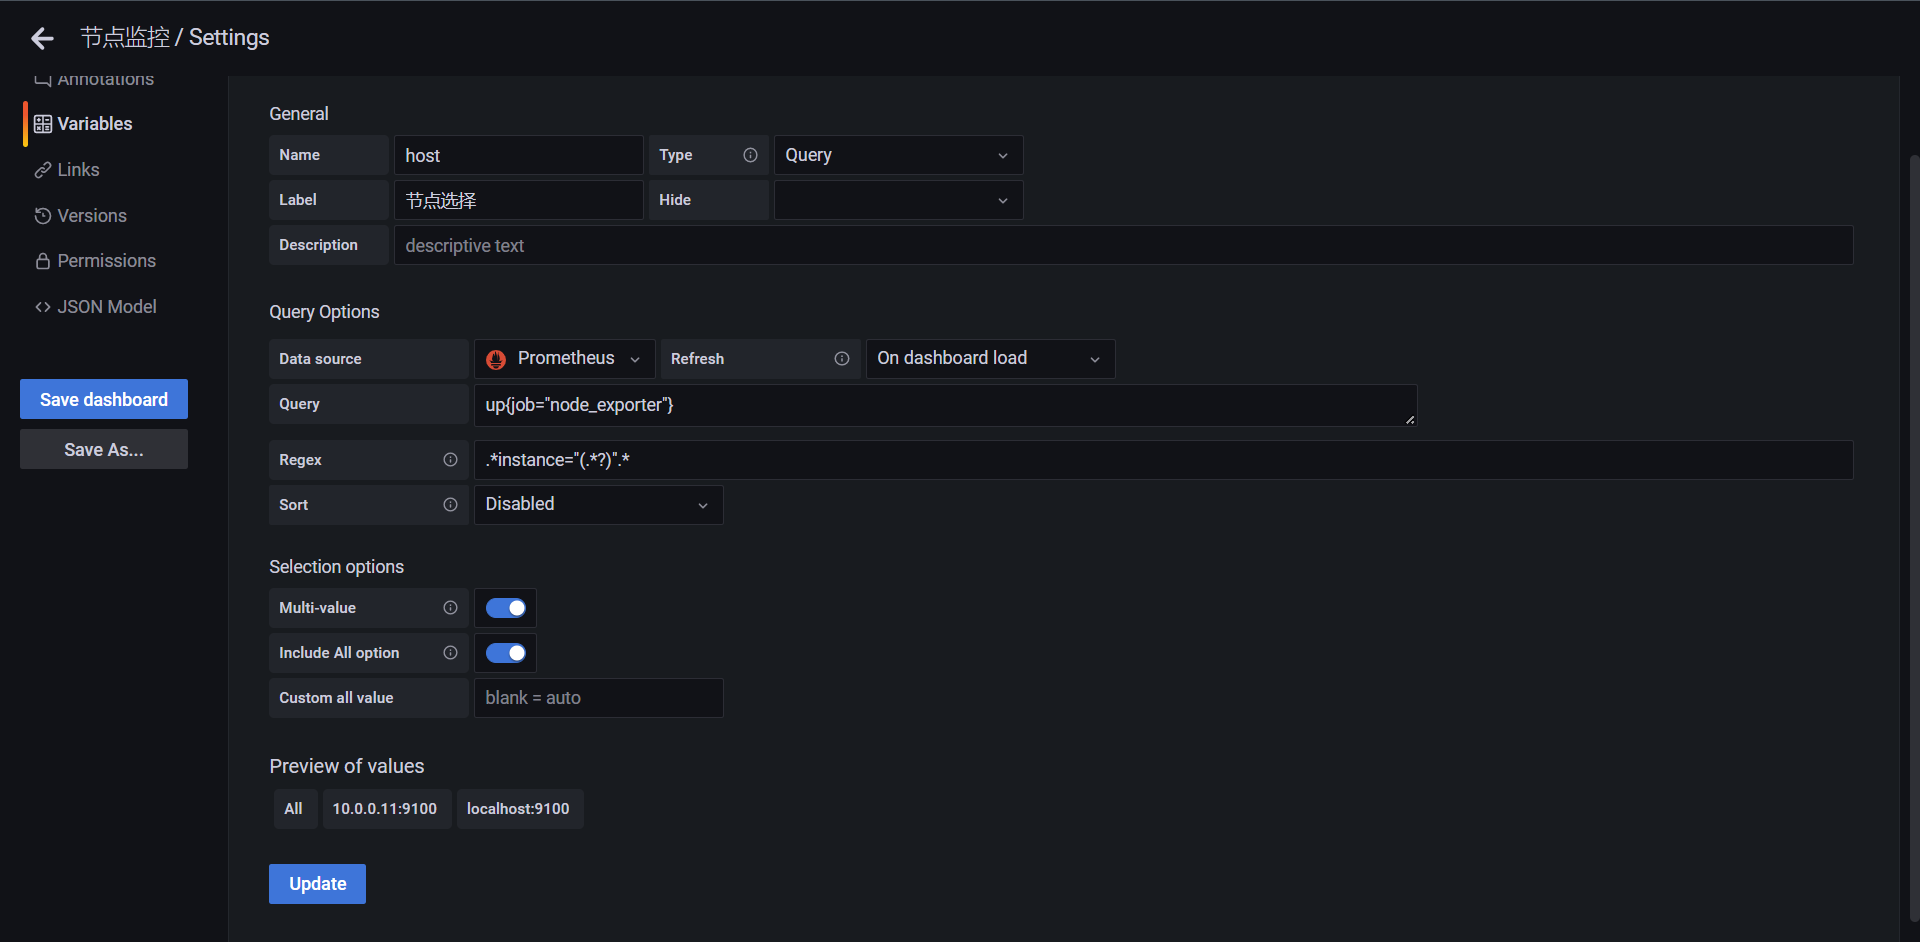
这里有两种获取主机的方式:
1:使用up{job="node_exporter"}过滤主机,然后使用regex正则匹配.*instance="(.*?)".*
2:直接使用函数label_values取标签label_values(up{job="node_exporter"}, instance)
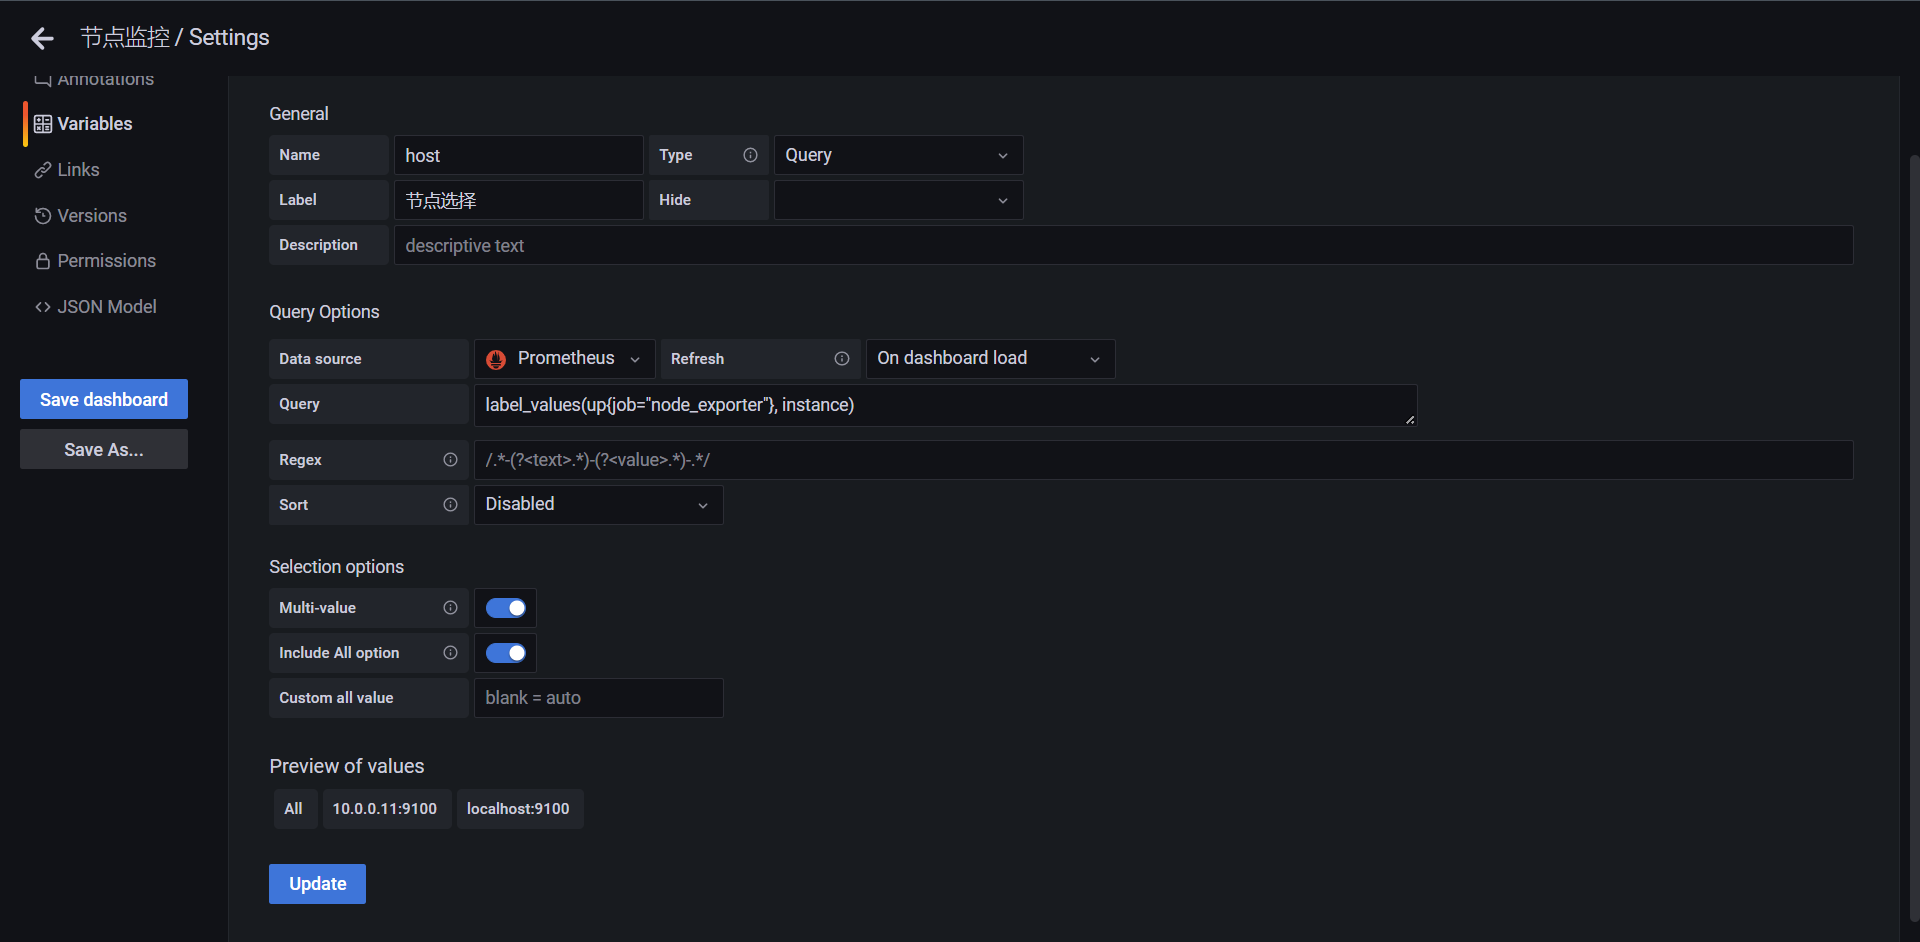
可以看到结果是一样的
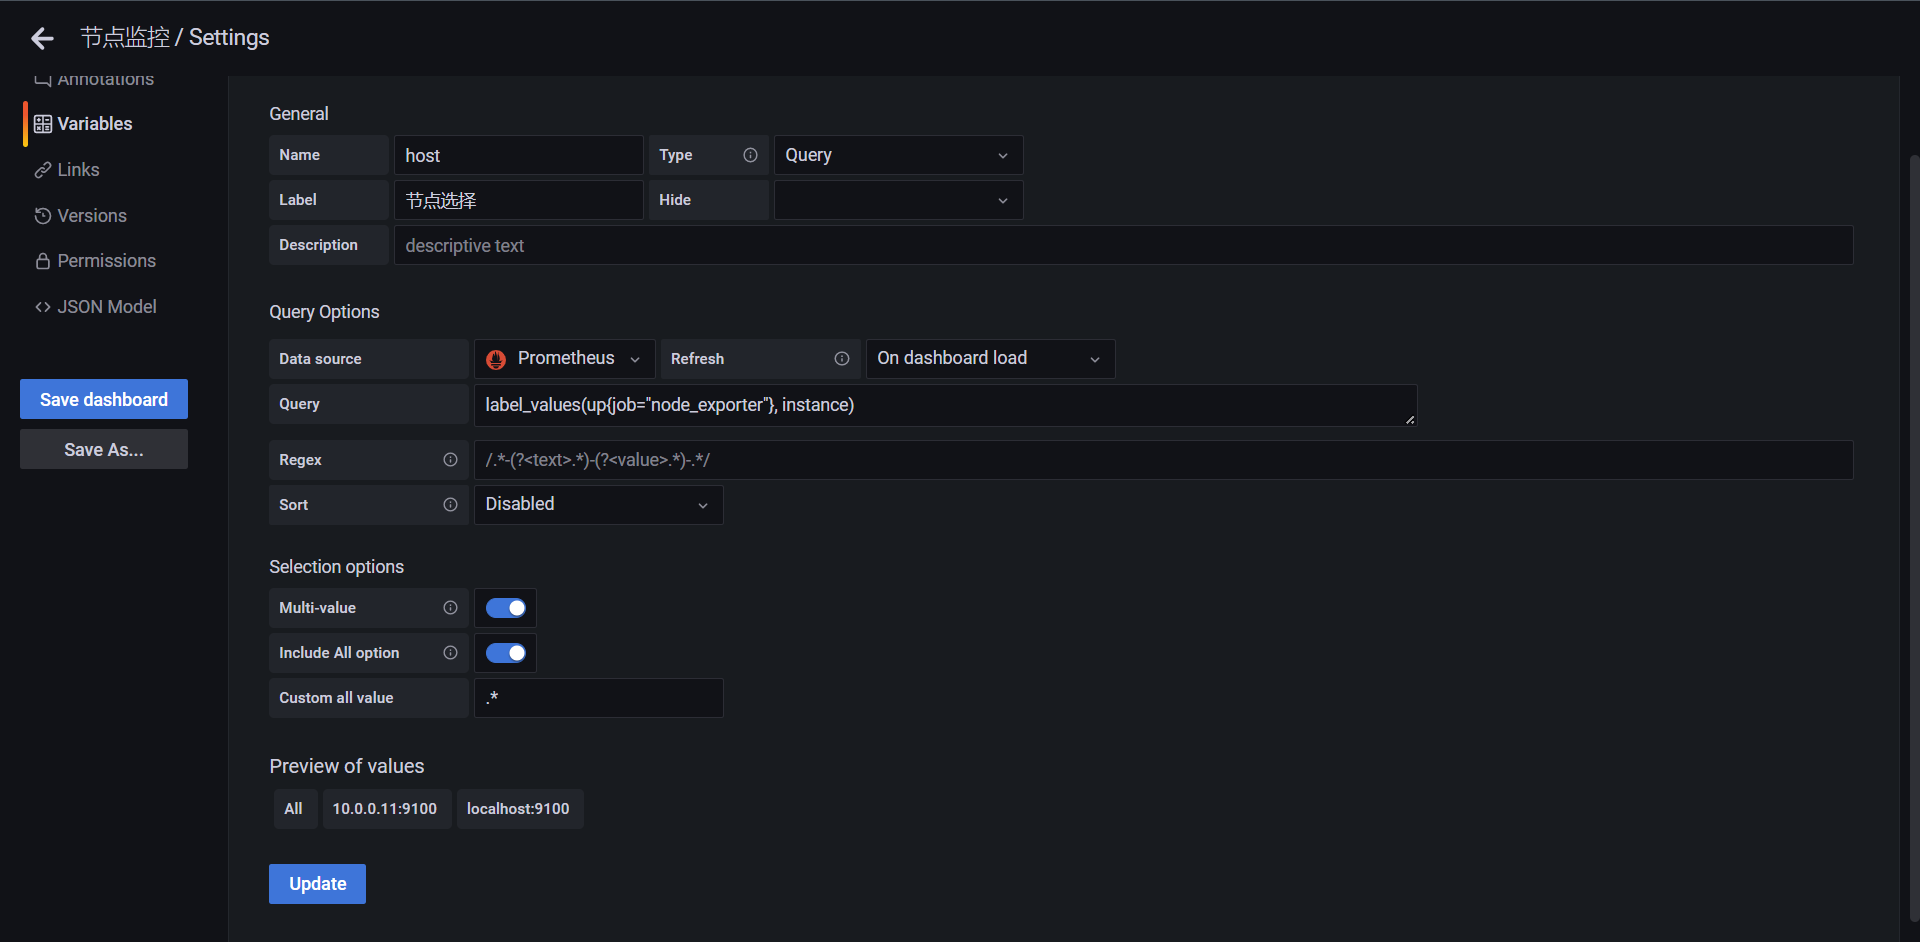
整体配置下来就是这样子了,点击update
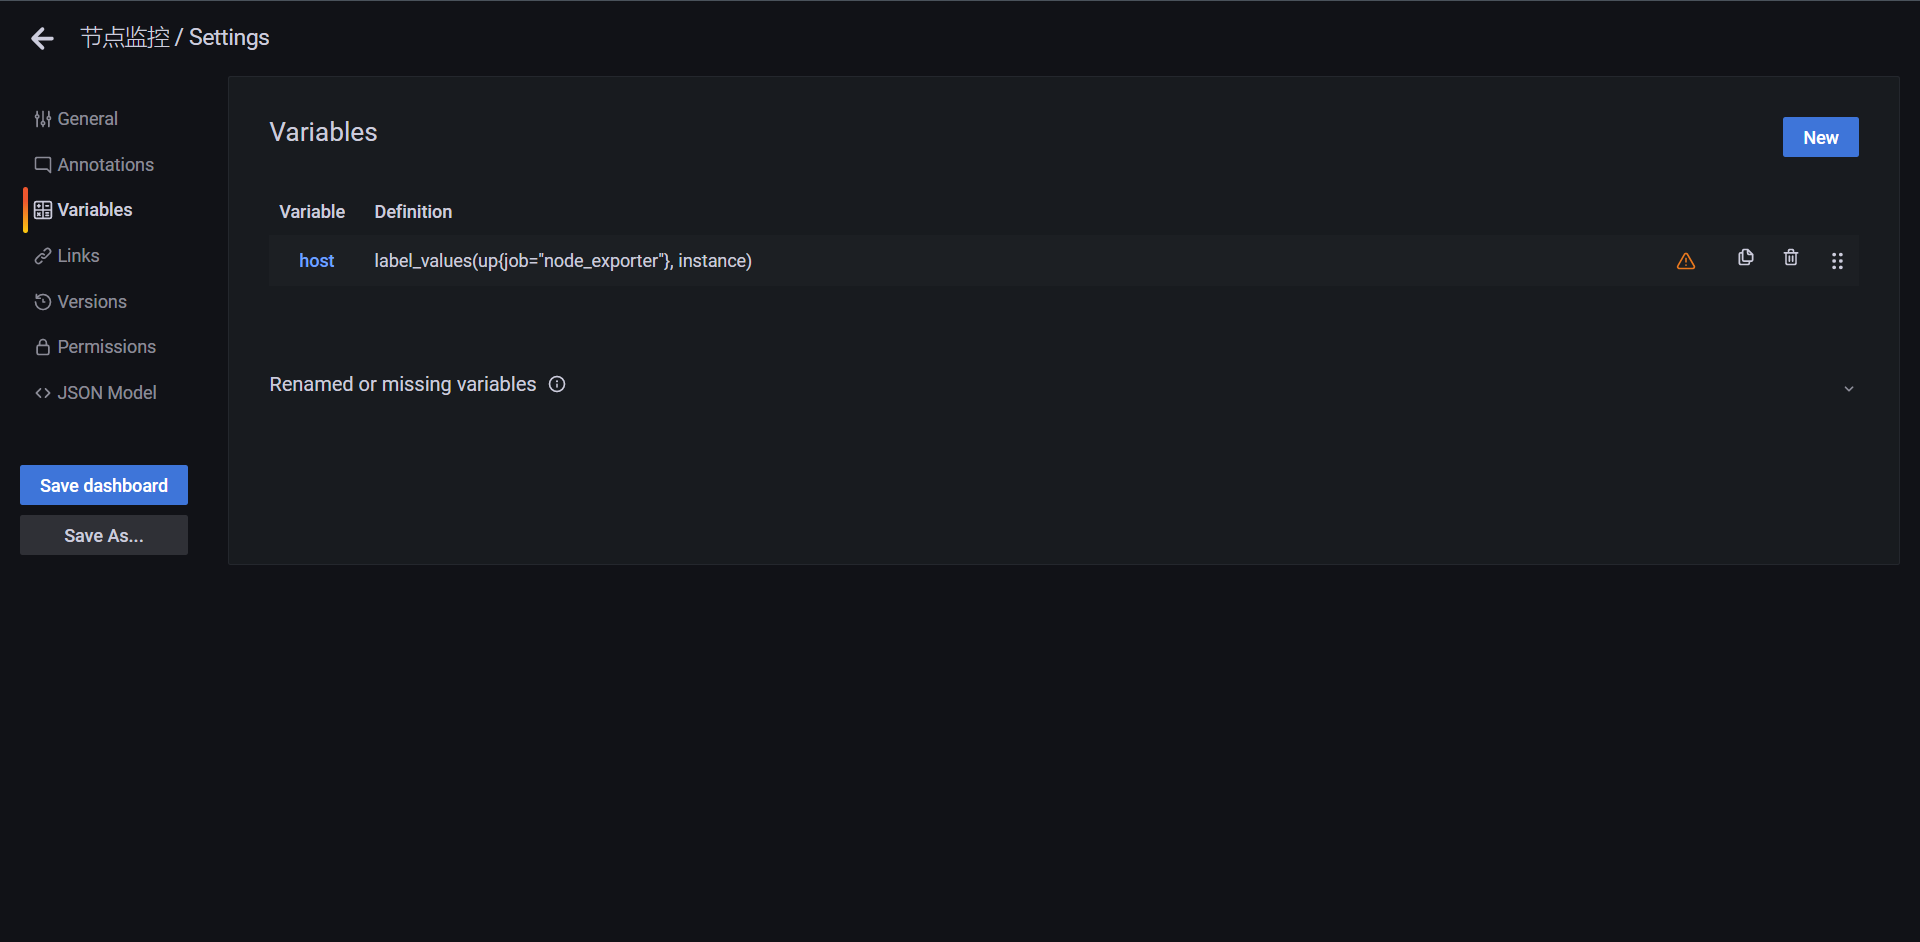
回到首页查看可以看到我们多了个选择器
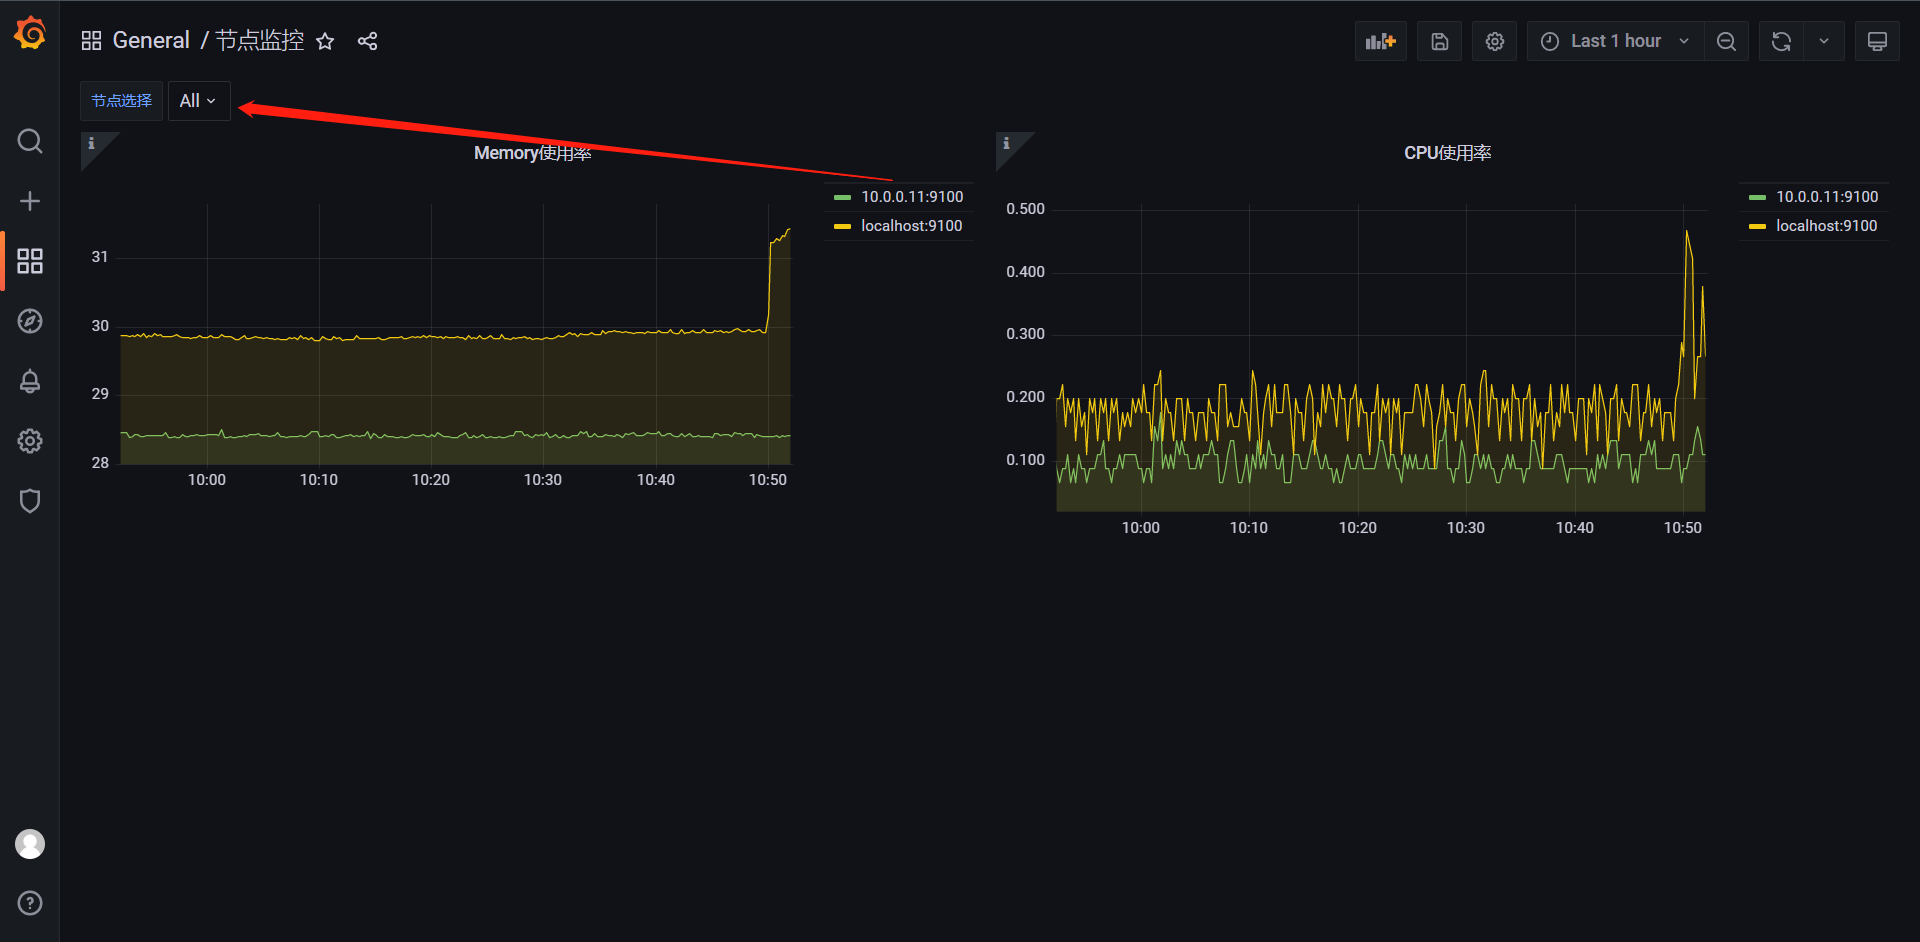
但是现在的选择其实还是不会生效的,是因为我们的Panel并没有应用这个变量,所以我们需要去应用一下这个变量
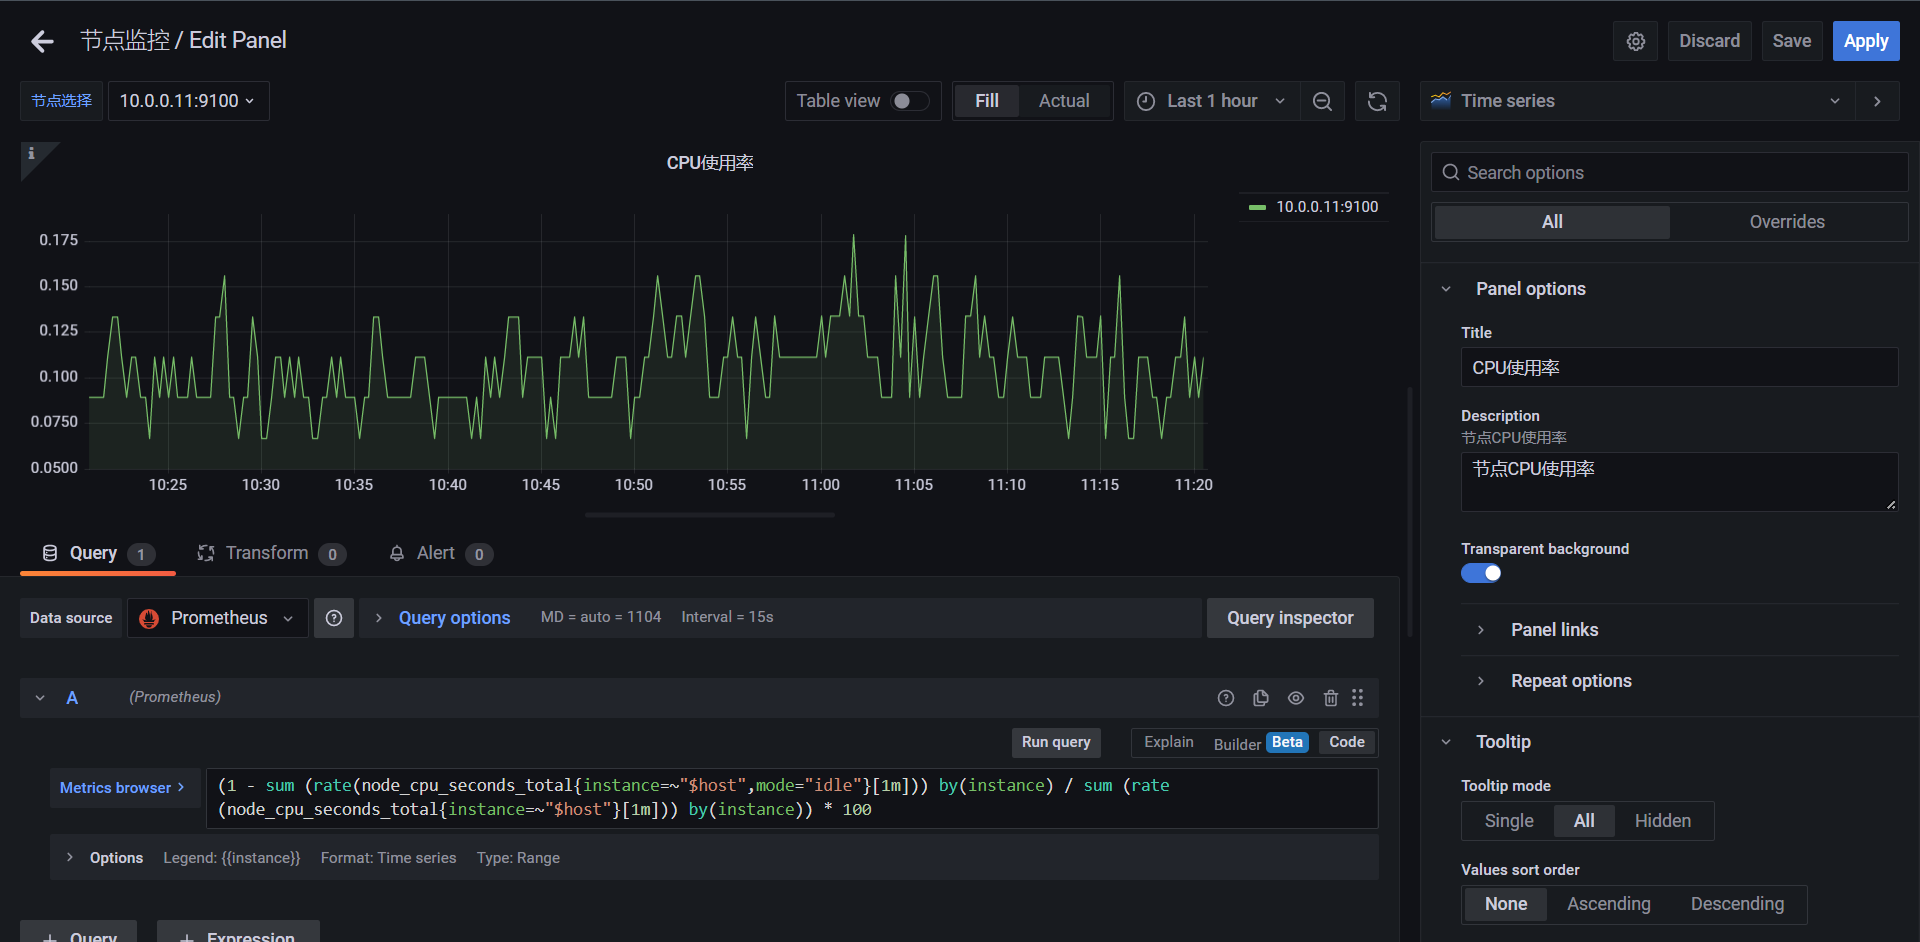
当我们把过滤标签替换成变量之后我们上上面选择的是哪儿个它就会给我们把变量传递到PromQL进行查询
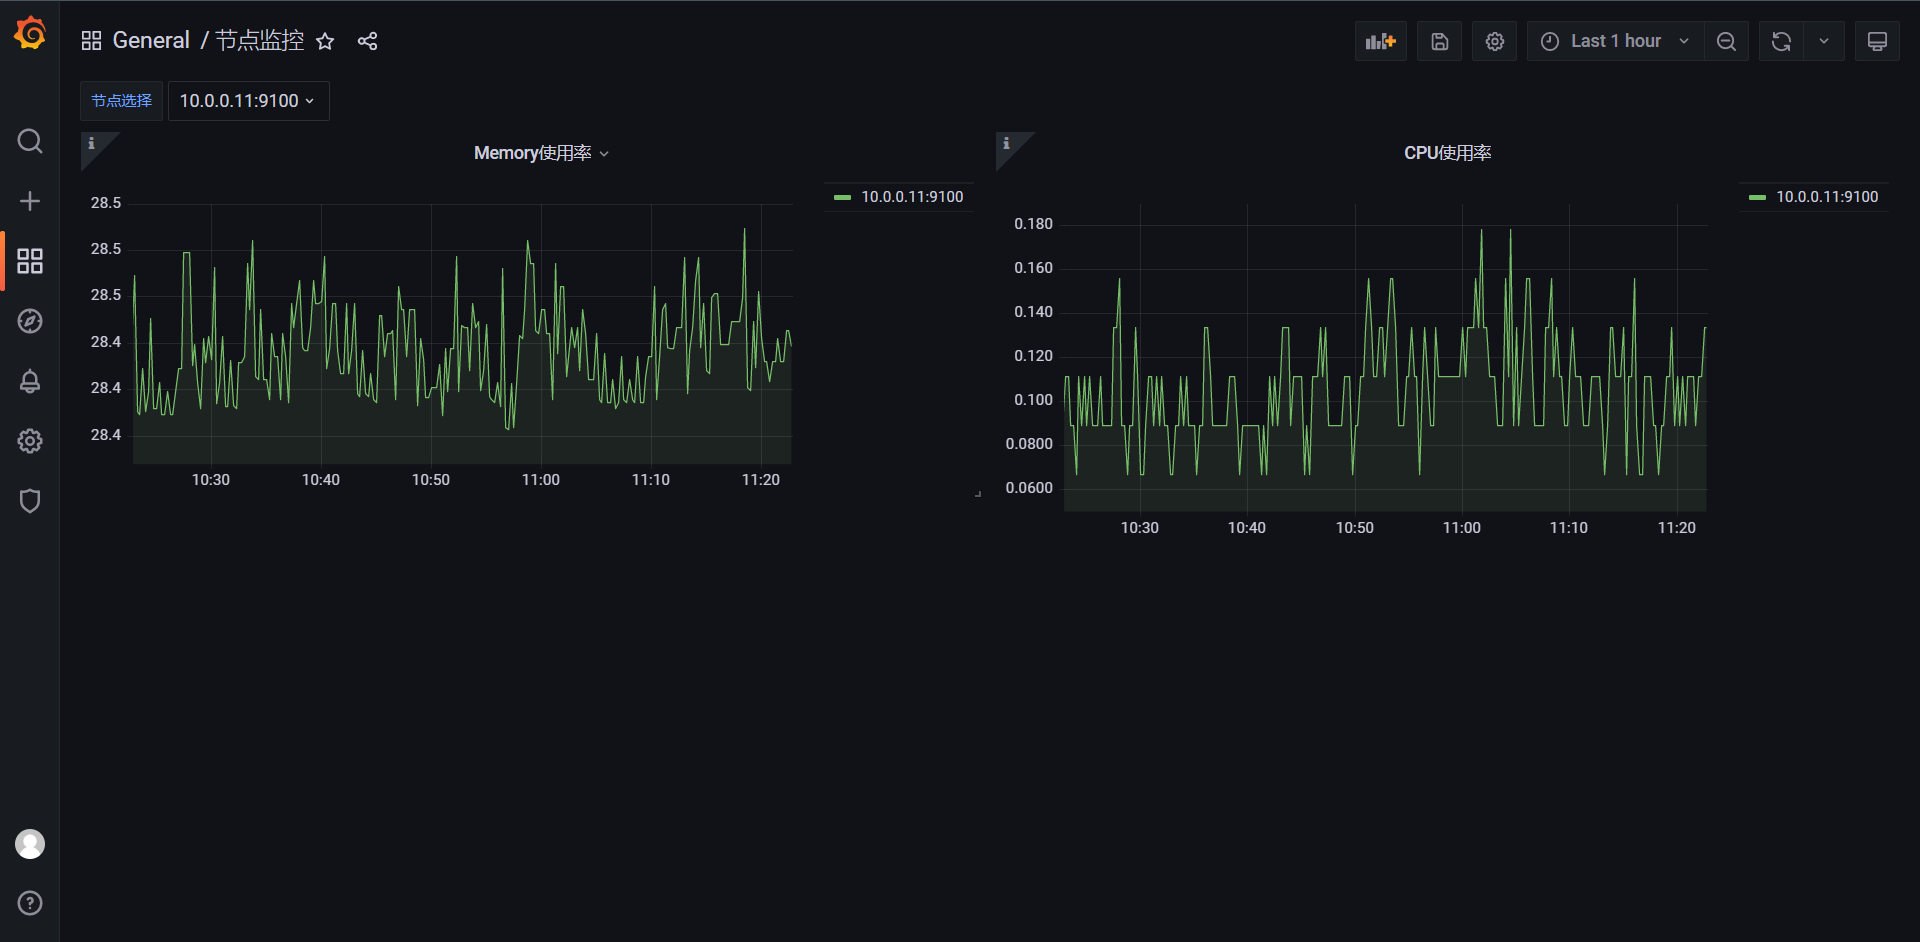
这样我们的参数就替换好了
14.3:图形高级定制
我们有的时候还有需求就是把多个查询聚合在一个Panel内,那么我们来看下如何操作
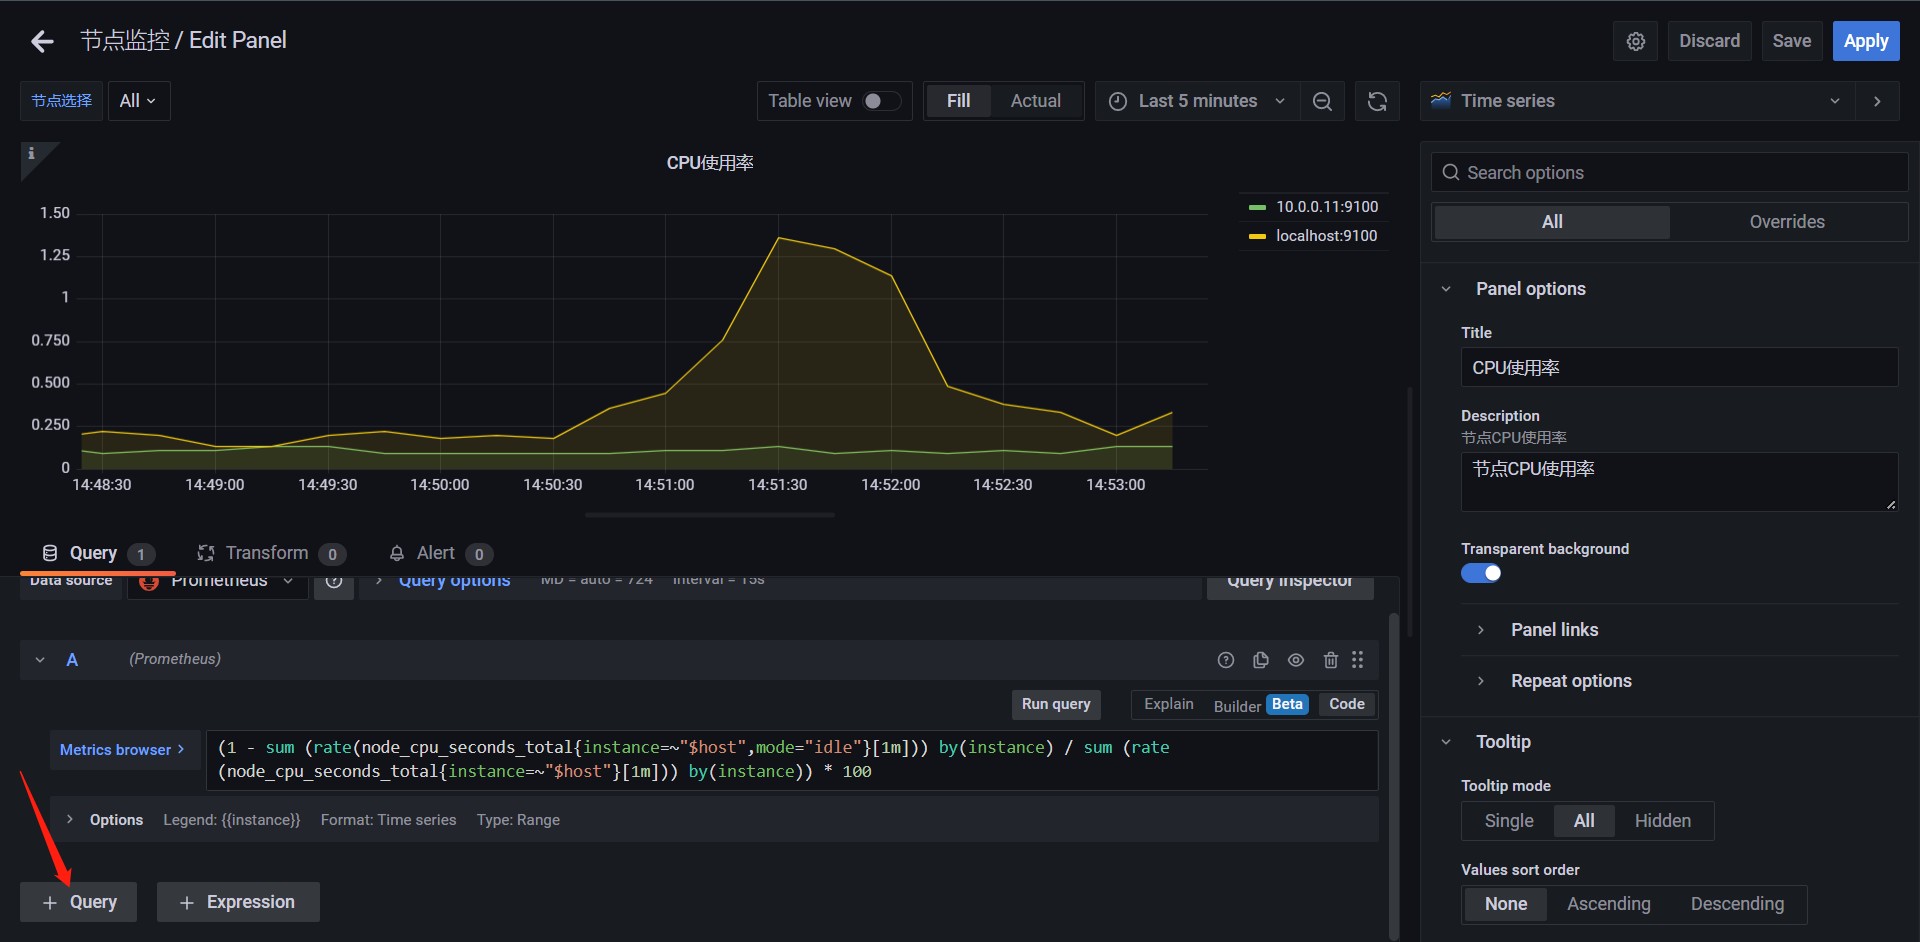
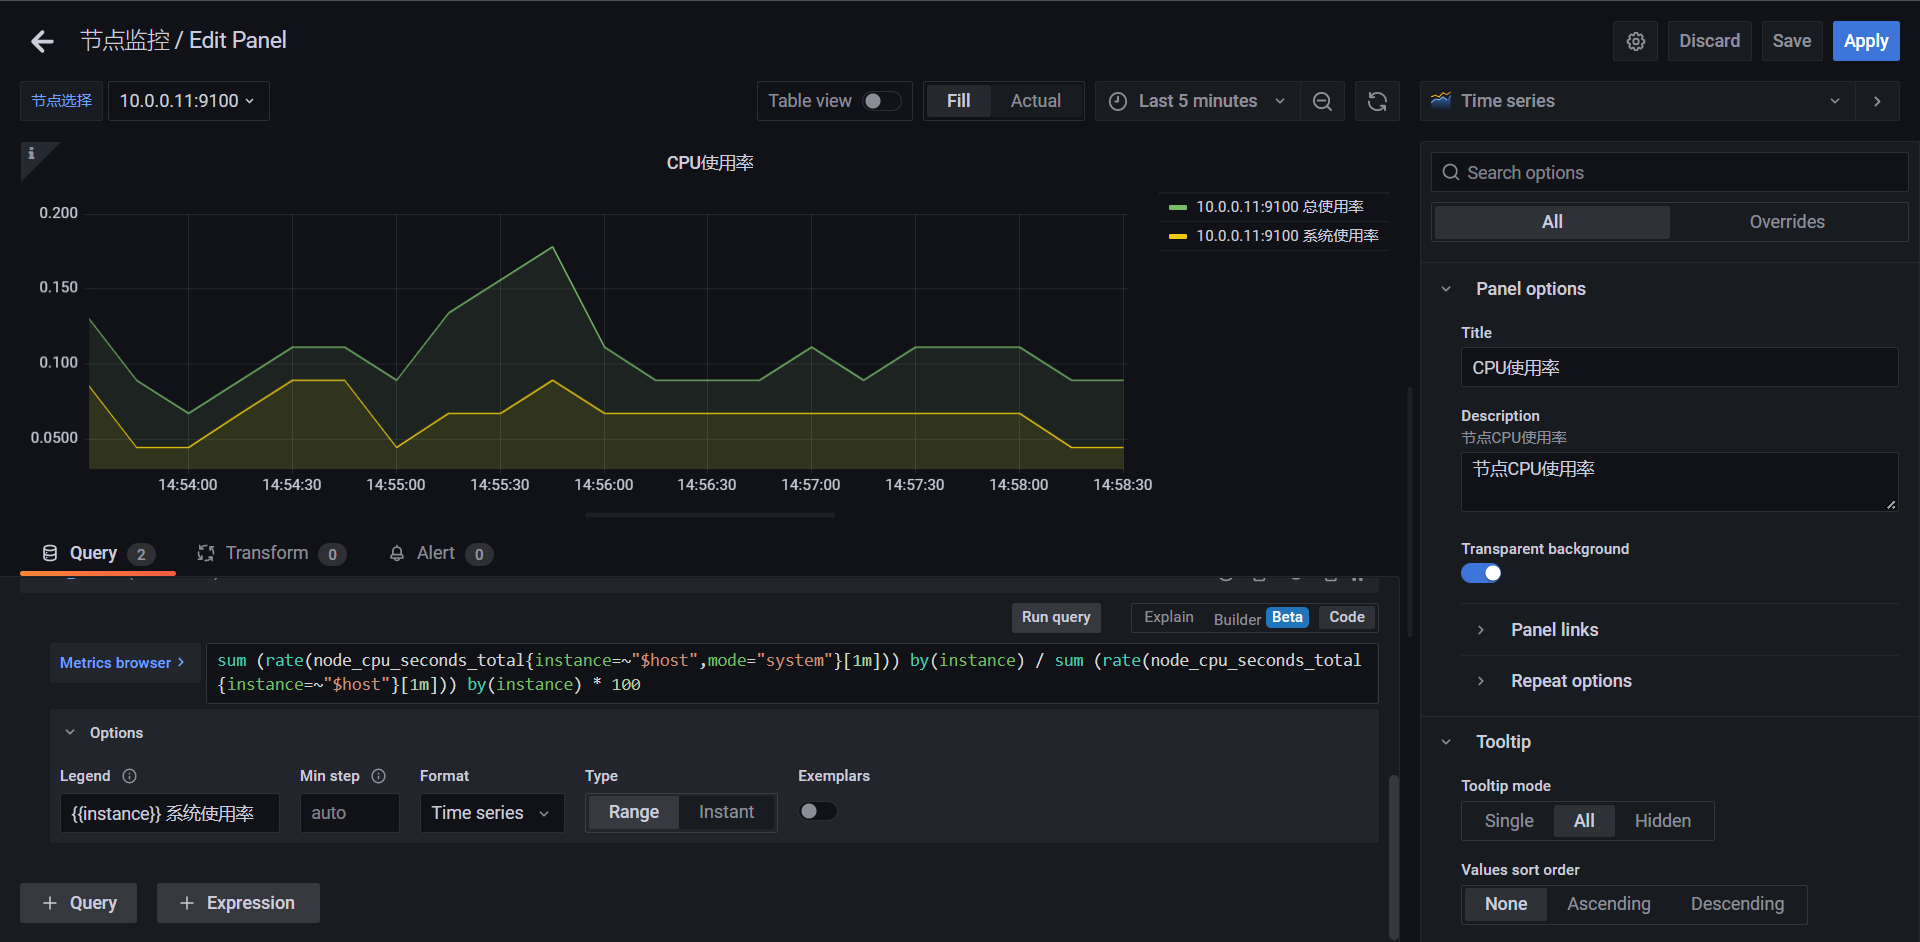
这样配置之后我们会发现这里就会出现我们想要的结果了,接下来我我们来完善一下
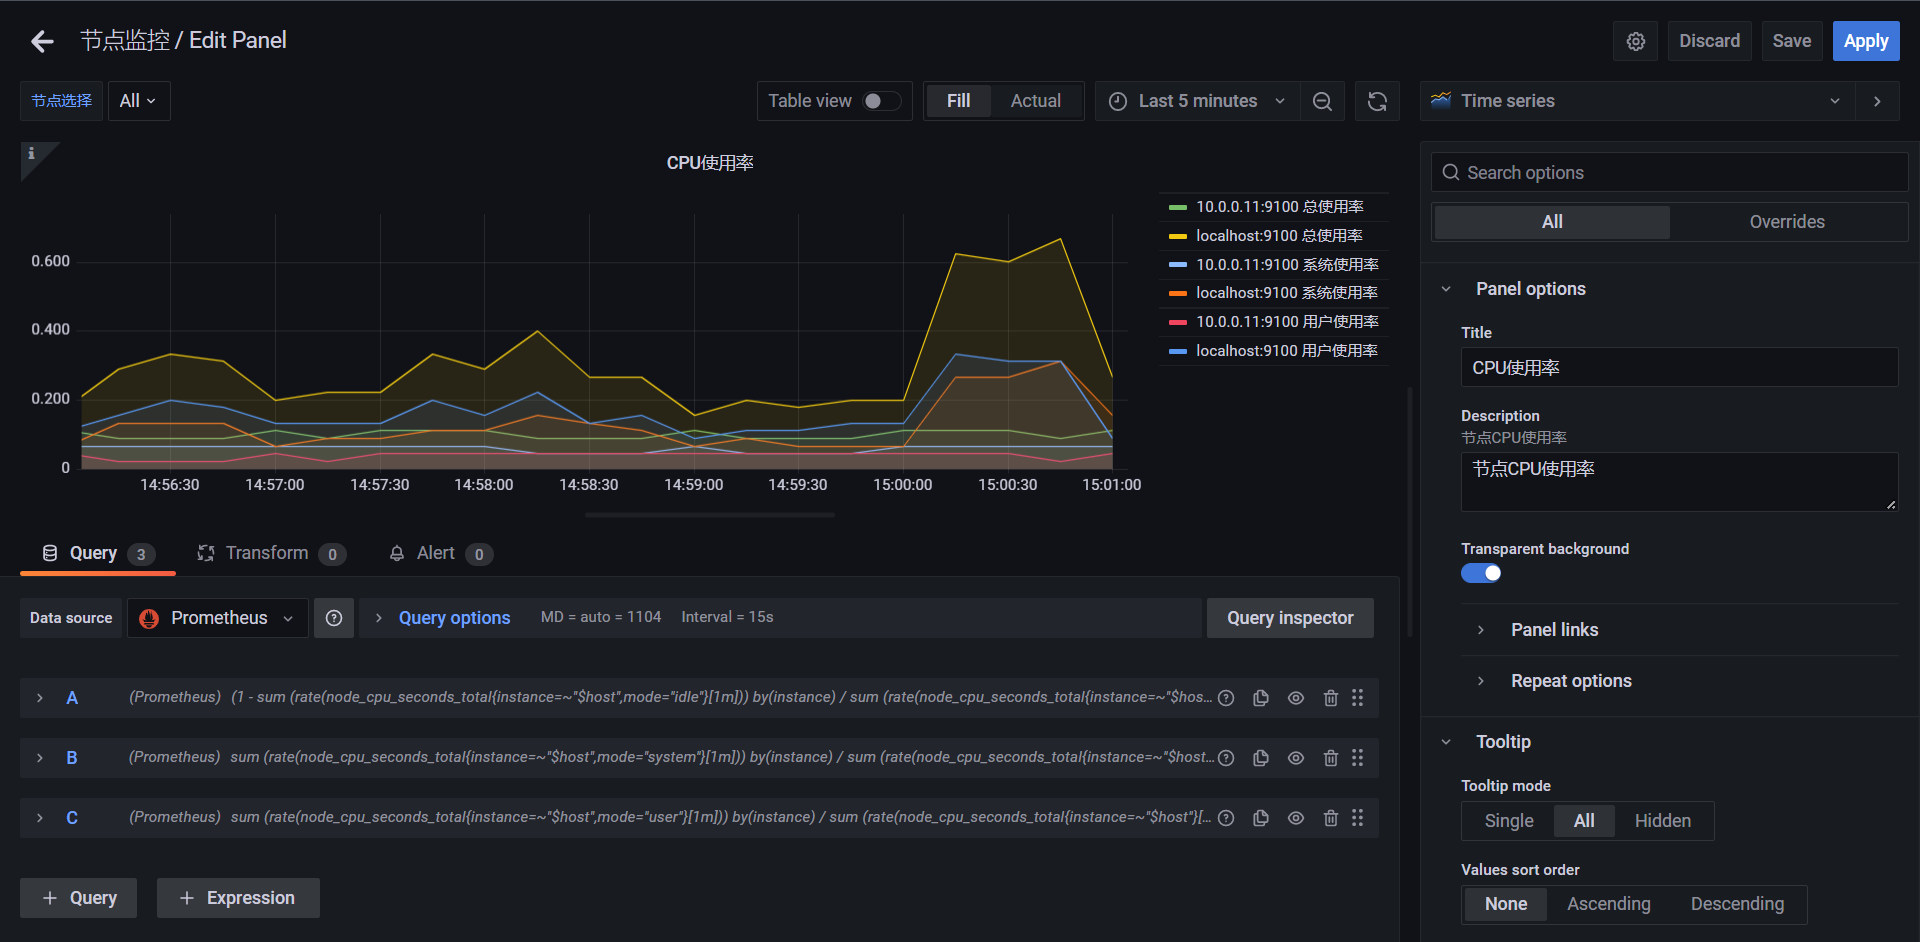
这里就可以很清晰的看到我们的每个节点的数据了,但是通过上图我们好像发现,主机为什么都带着端口呢。貌似对我们也没什么作用,那么我们如何去掉它呢?接下来我们来操作一下

Transform:它支持我们的数据在展示之前多数据进行操作。
这里我们用到了 Rename by regex 来重命名我们的数据
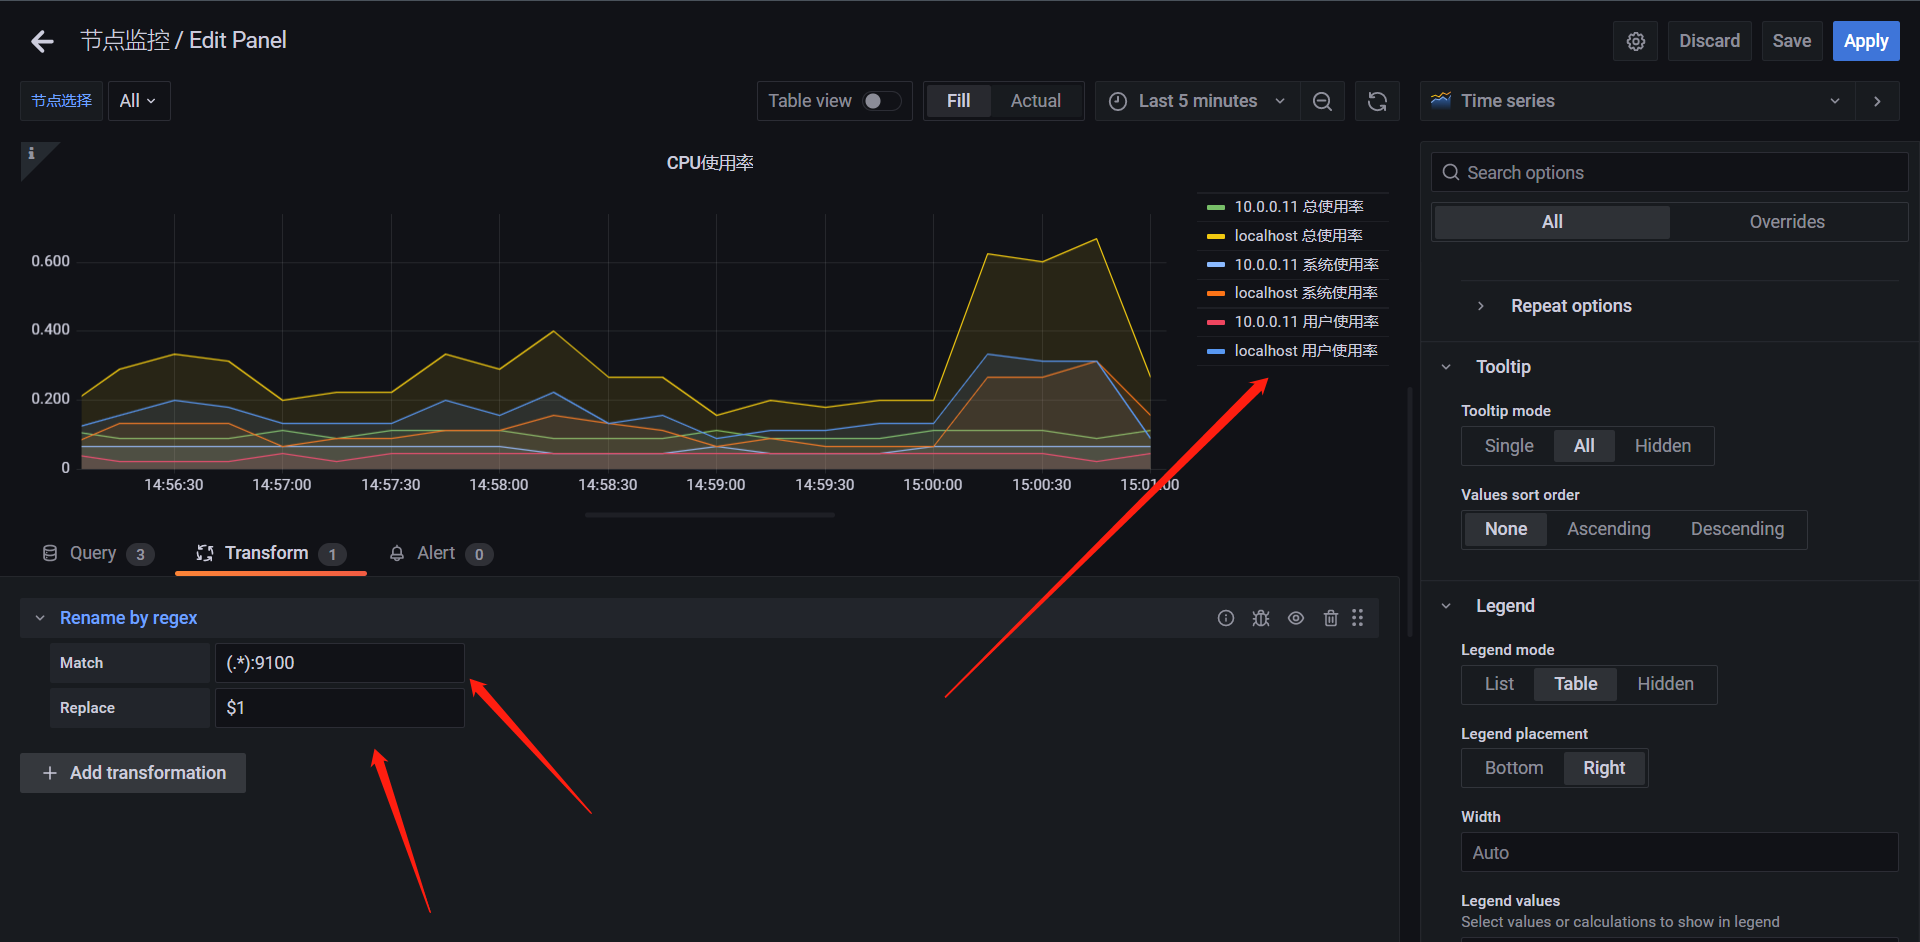
这里主要是我们匹配:9100这个数据然后$1就是我们的主机名,意思就是他会把匹配到的9100的所有的值全部替换成$1也就是我们的主机名。

我们都知道我们在计算的时候其实cpu的使用率都乘100了,那么我们其实还可以做一下配置

在右侧选择Standard options ---> Unit ---> Misc ---> Percent(0-100)(百分比)
Decimals (保留小数的最小位数)
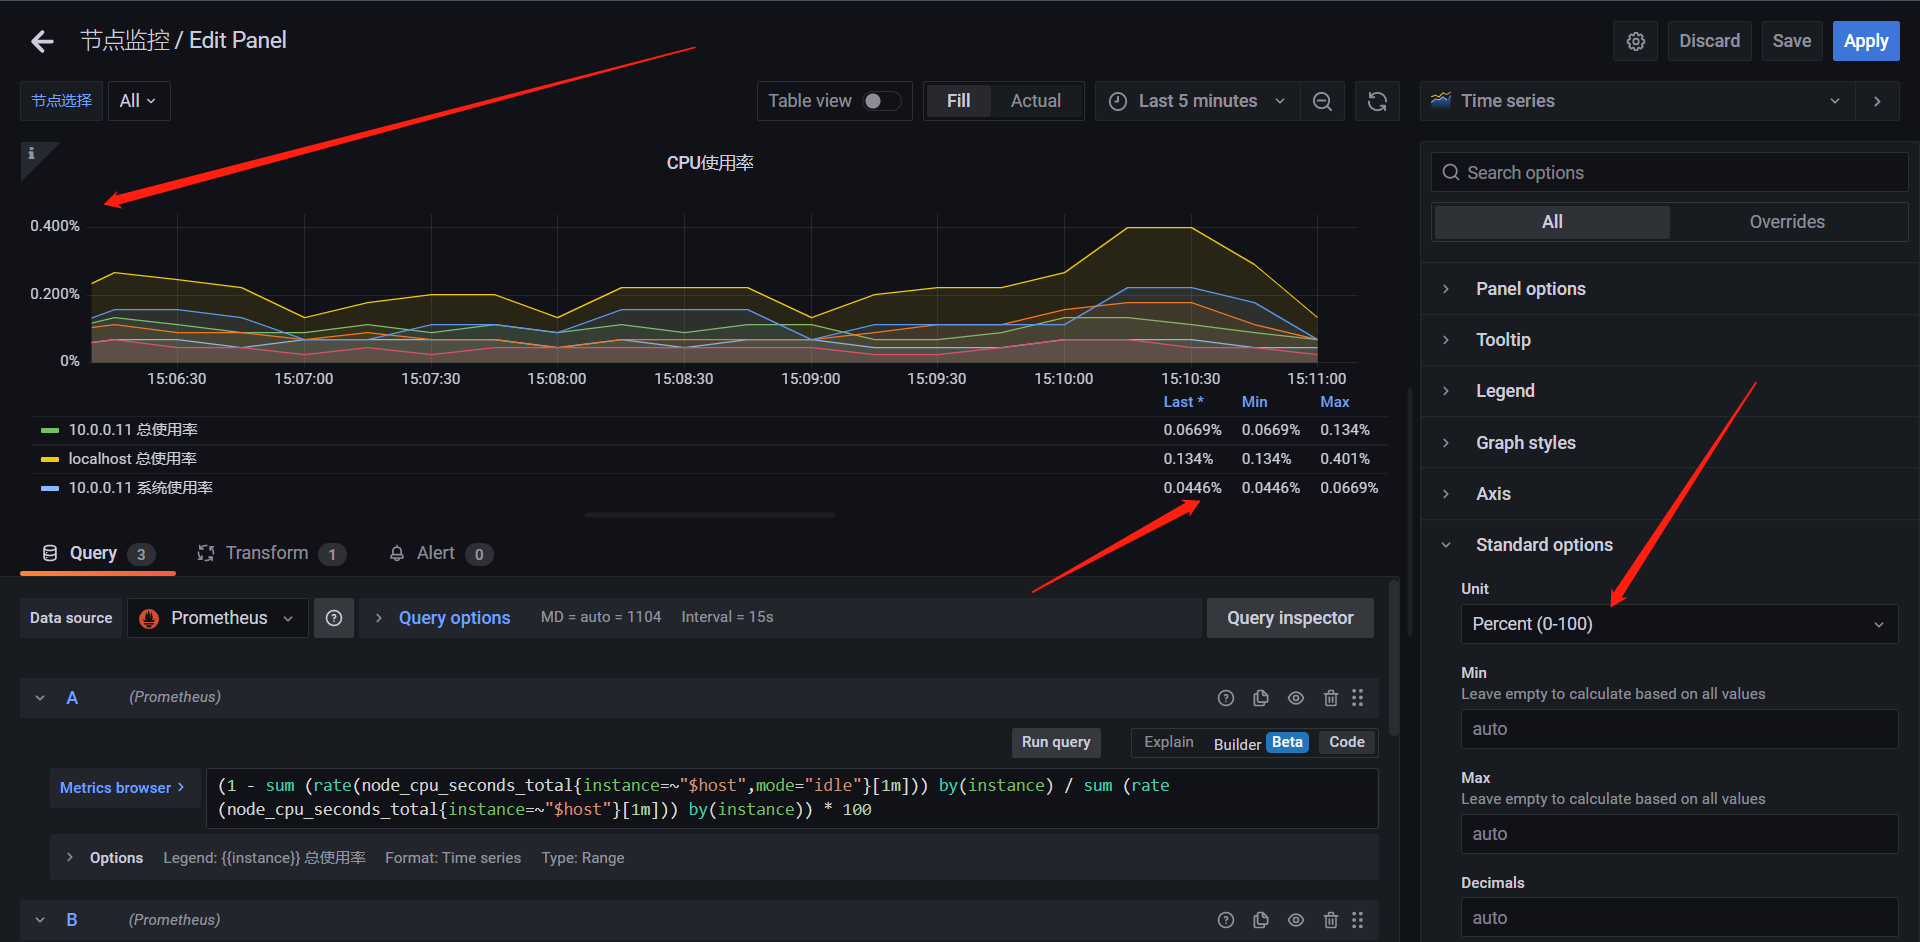
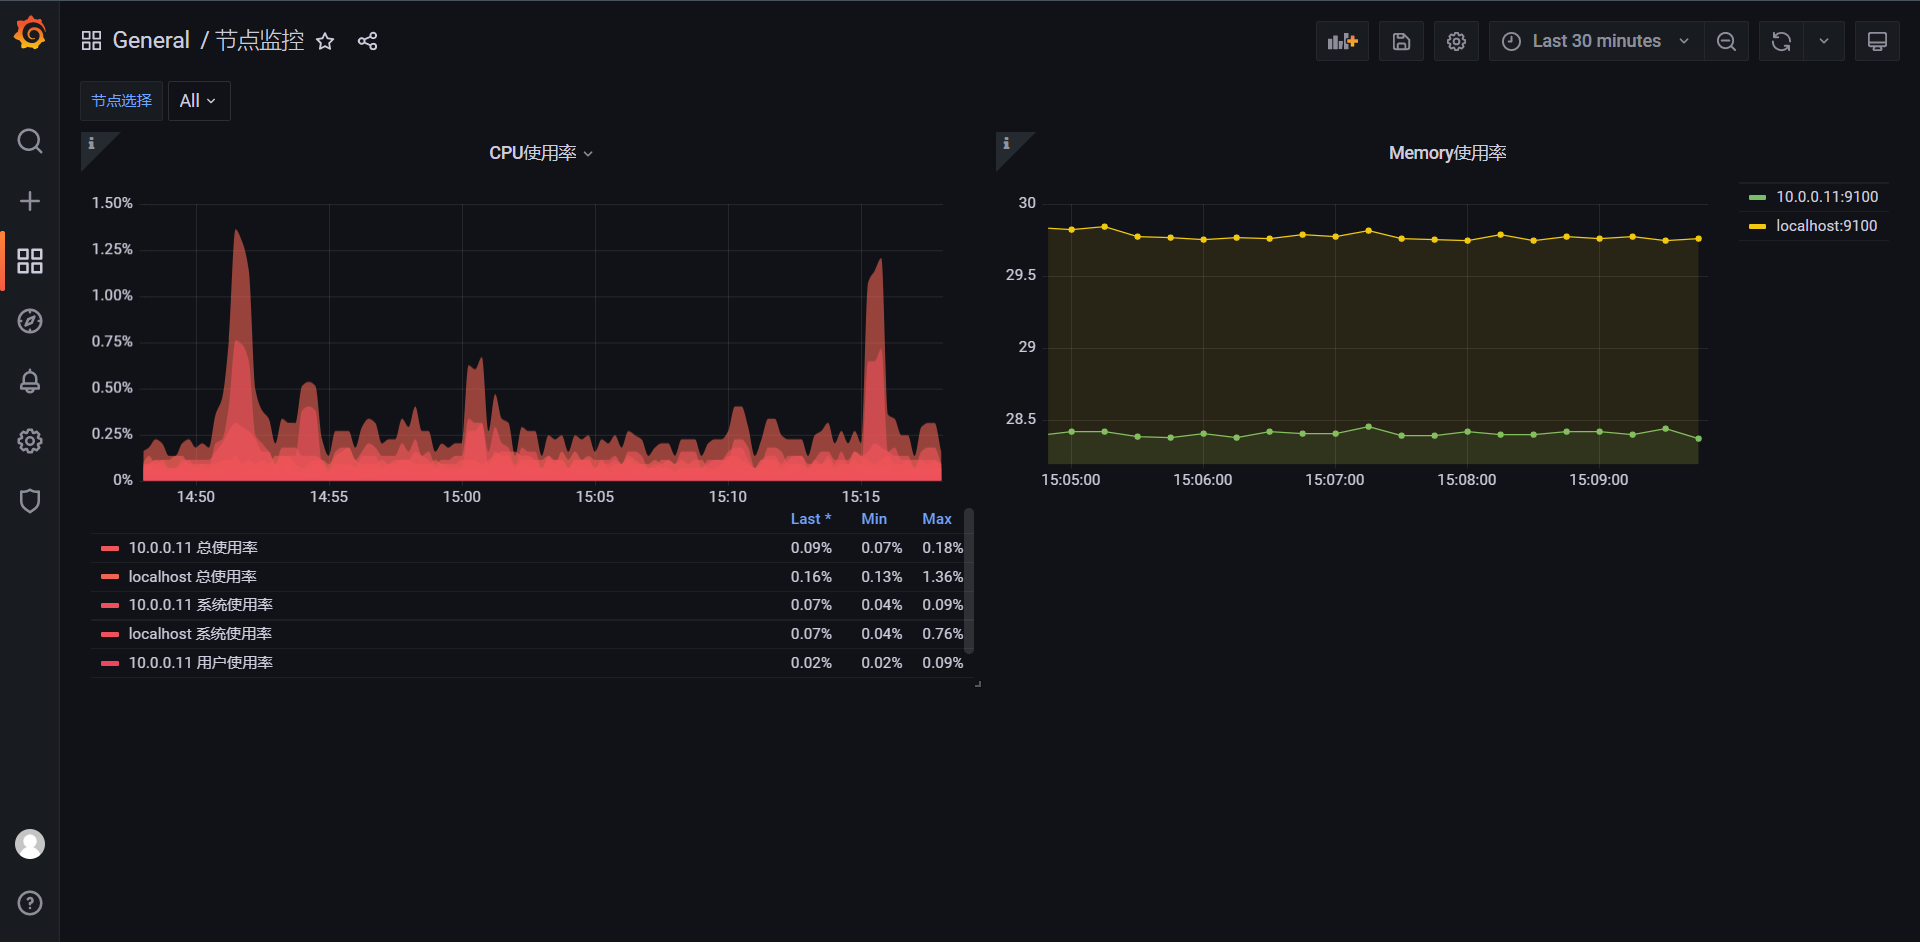
整体调整完成是这样子的。


在这里面还有一个问题,就是我们在执行图形的查询的时候区间向量都是一分钟,但是有的时候我们需要查询的不只是一分钟,所以我们需要把这个数值改成参数的形式,和host类似的写法
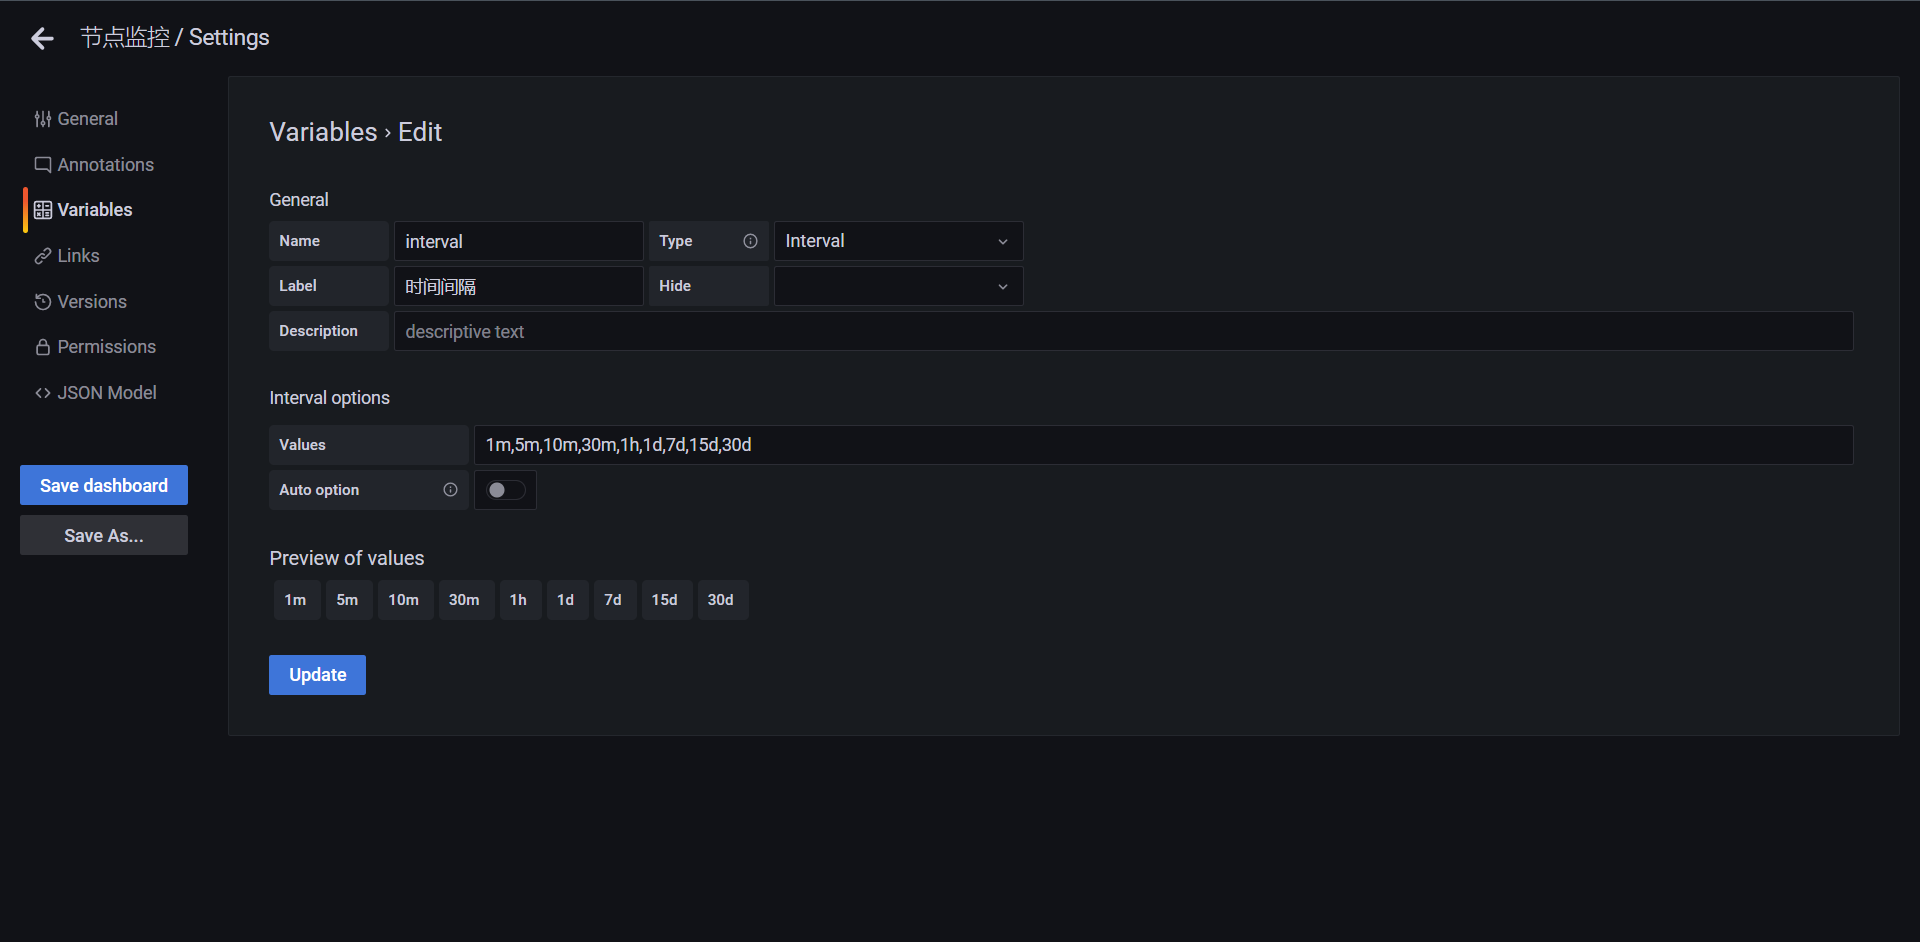
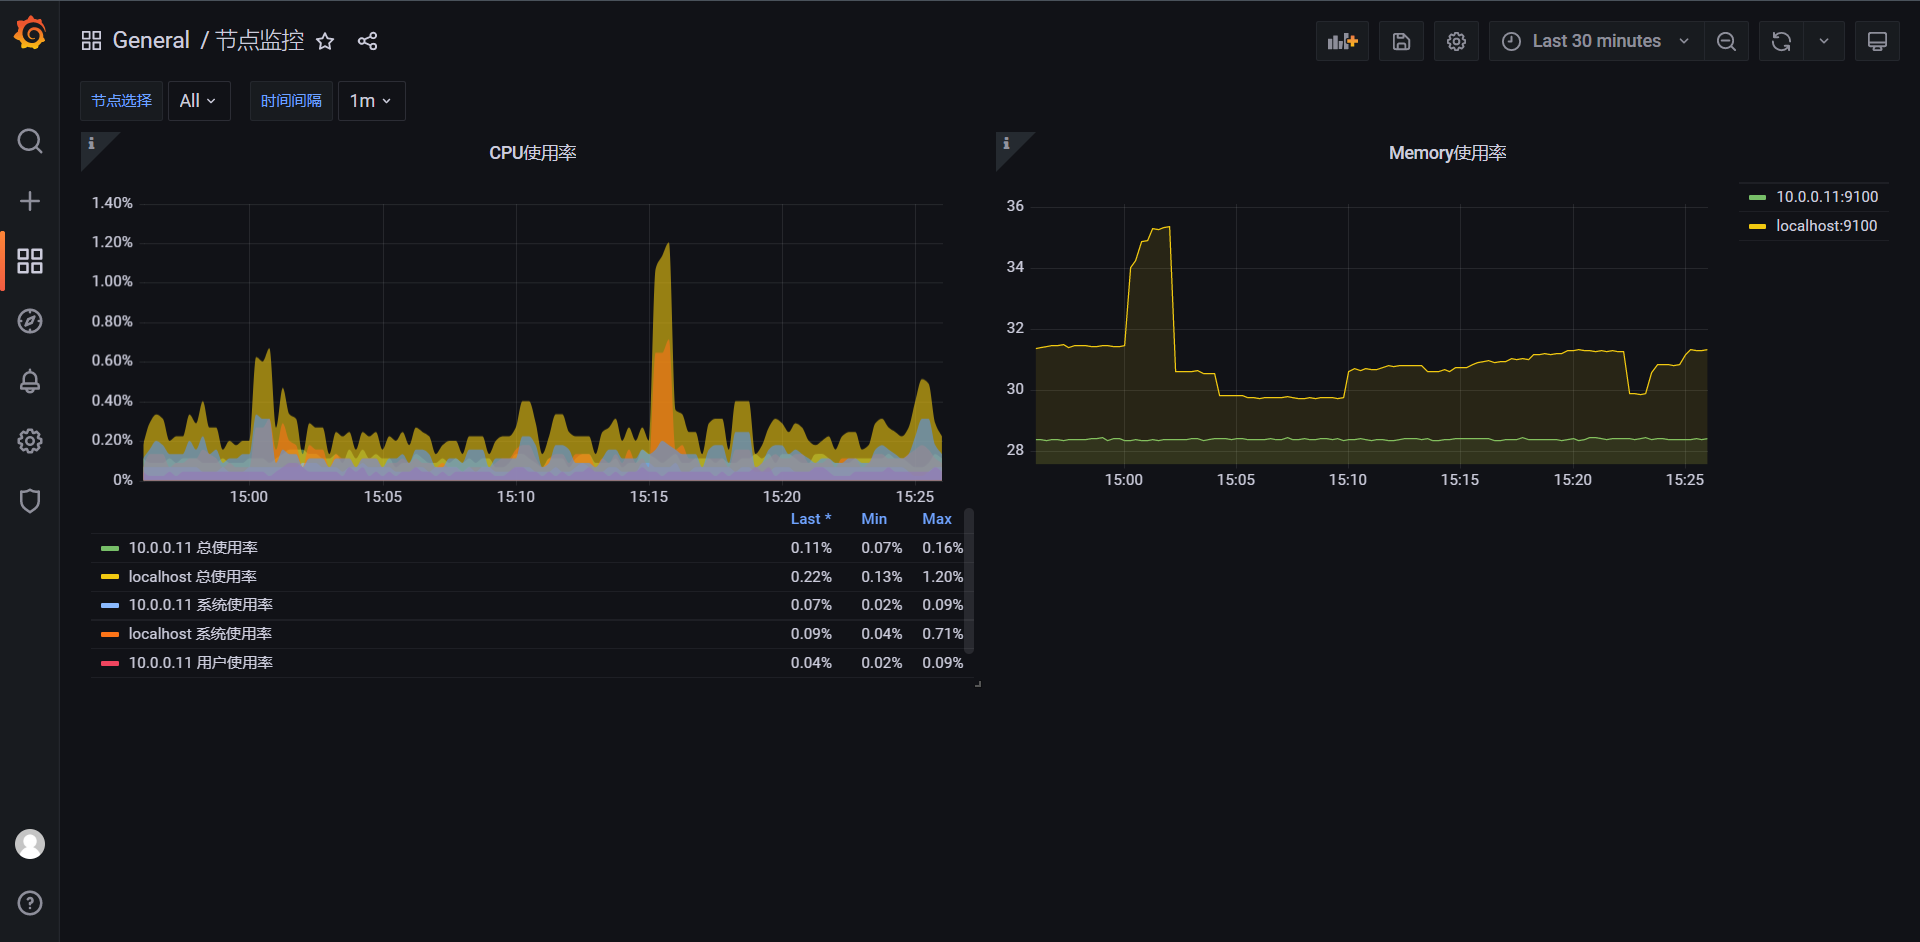
遵循host的替换规则,我们也把interval替换上去,然后上图就是替换好的一个样子了
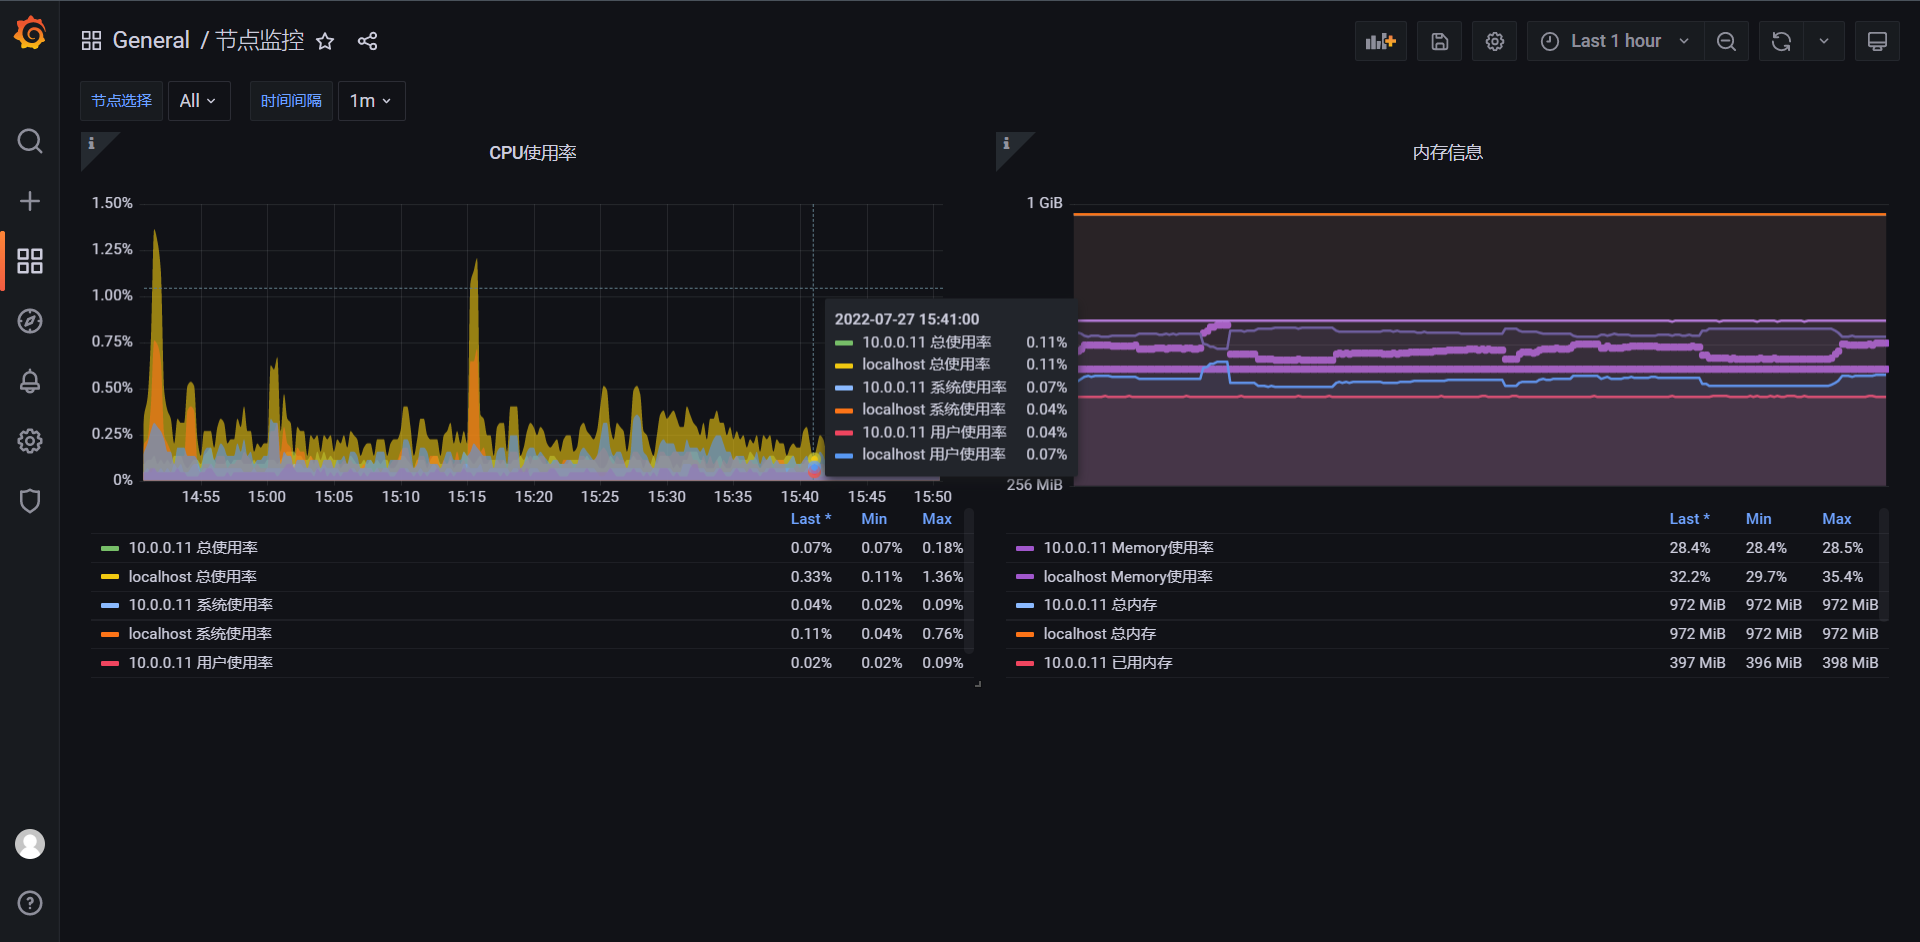
最终我们得到的一个图形就是这样子的。
14.4:表格面板
表格面板可视化非常的灵活,支持时间序列和表格和原始json数据的多种样式,此面板还提供日期格式,值格式和着色选项,

接下来我们演示一下统计服务器资源为例使用表格面板进行说明,在Dashboard中添加一个空的Panel面板进入面板后选择Table面板
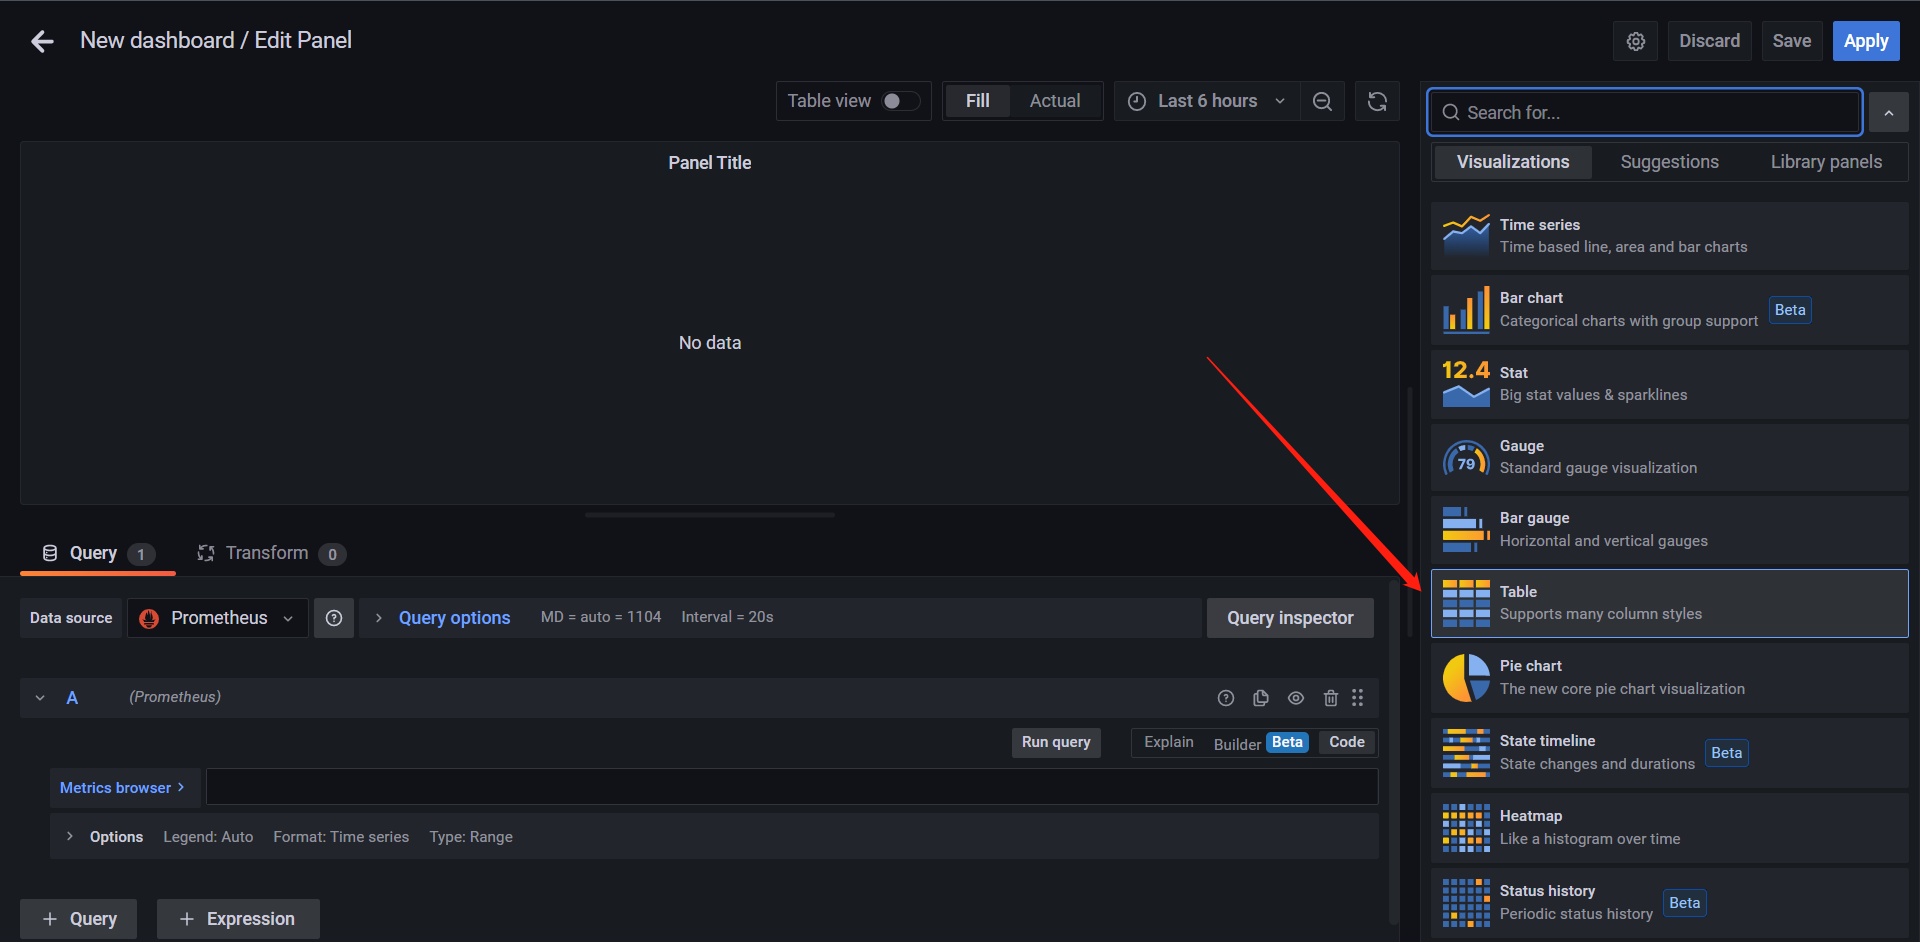
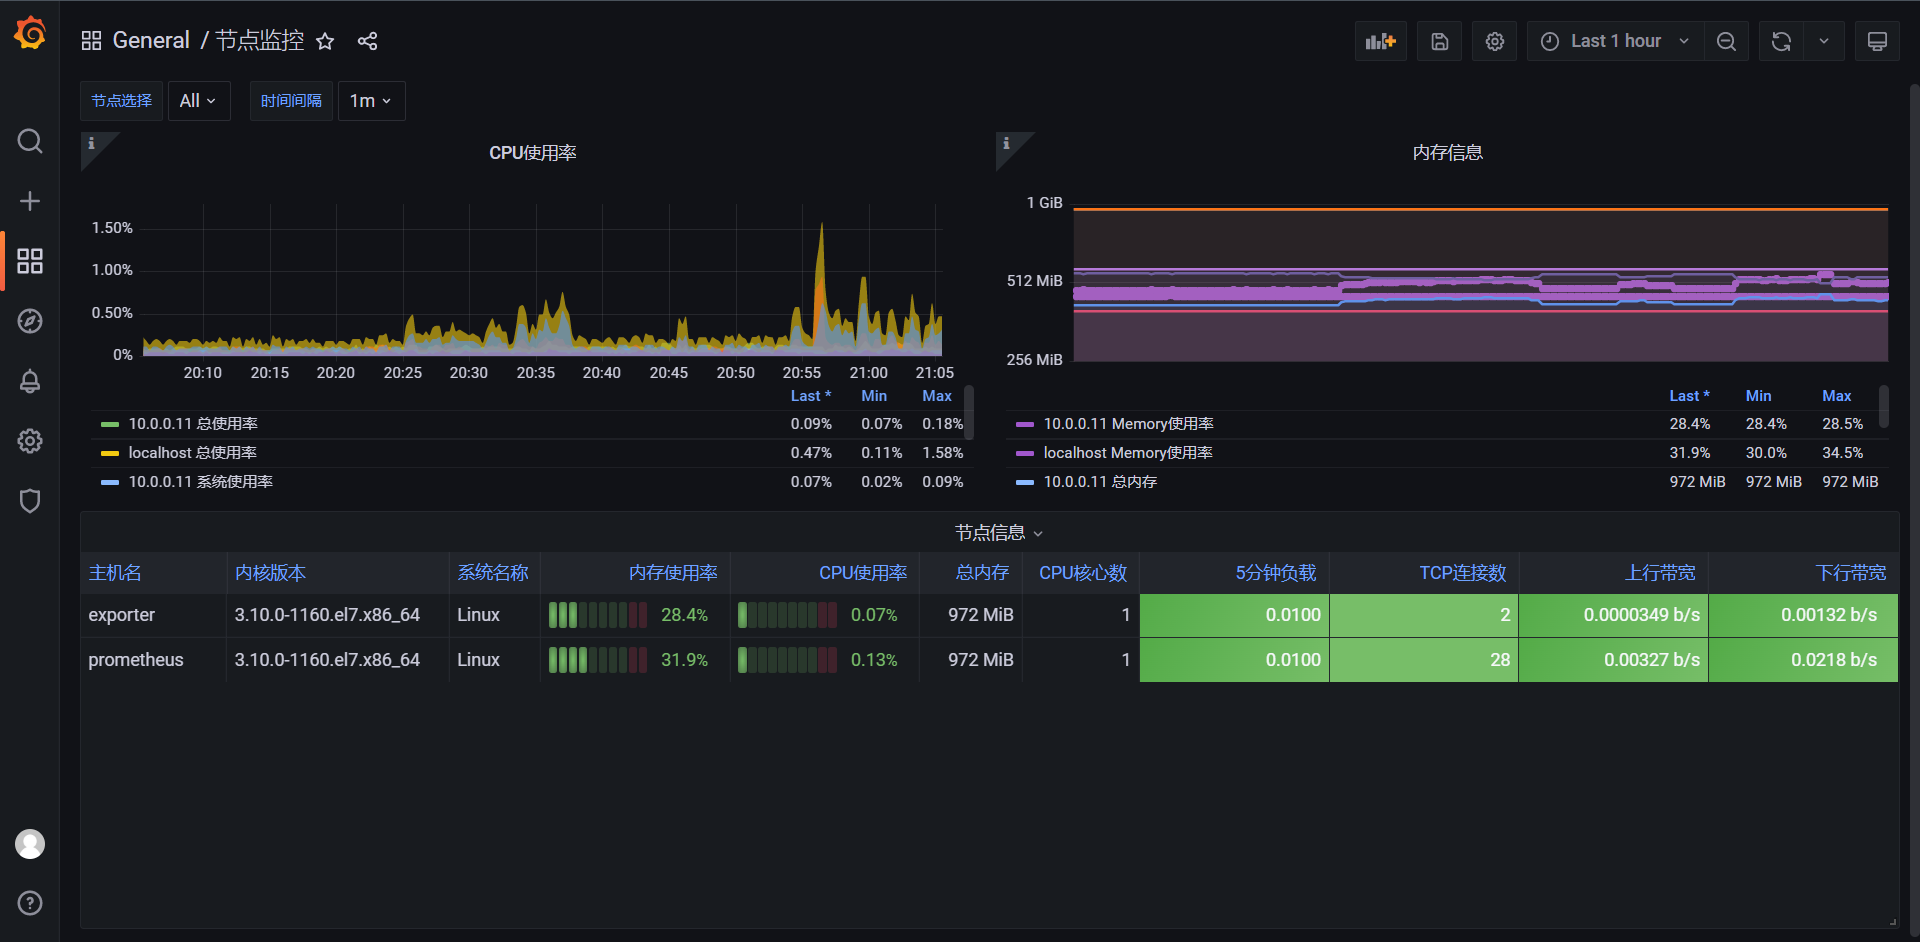
整体的样式就是上图这个样子
14.5:仪表盘
如果想展示最大值与最小值相关的数据,我们可以选择使用仪表盘面板,比如我们用一个仪表盘面板来展示内存使用率
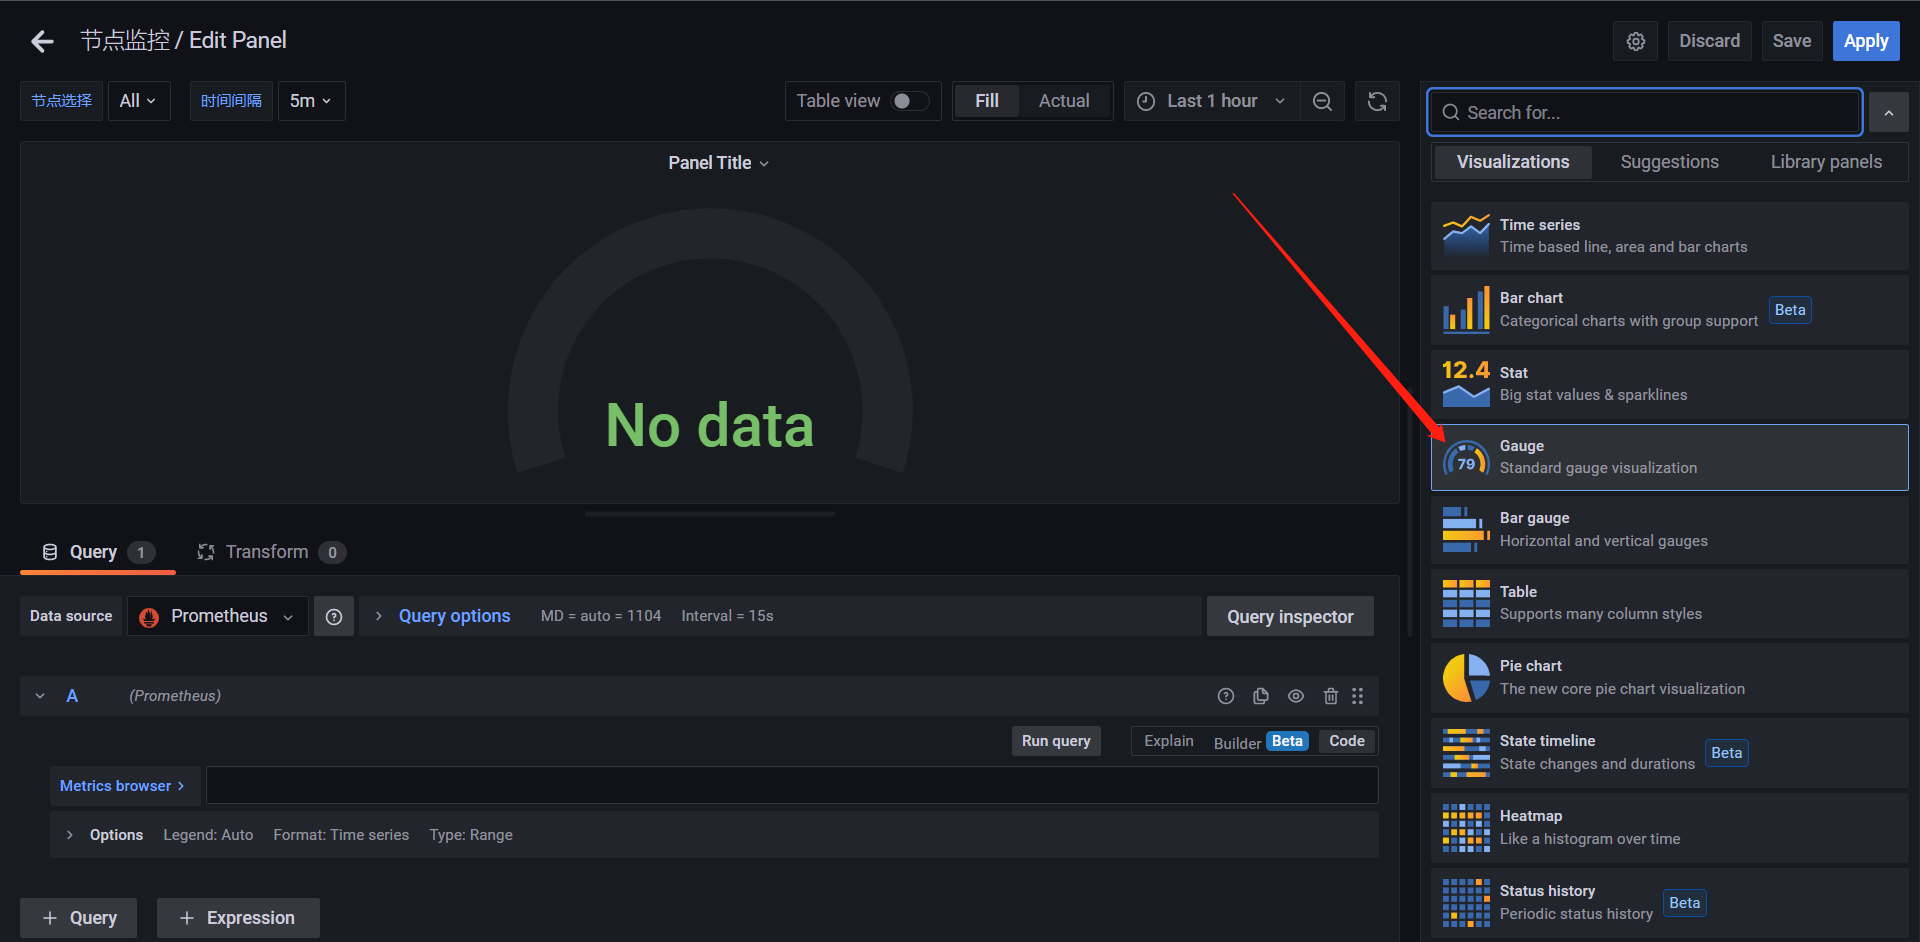
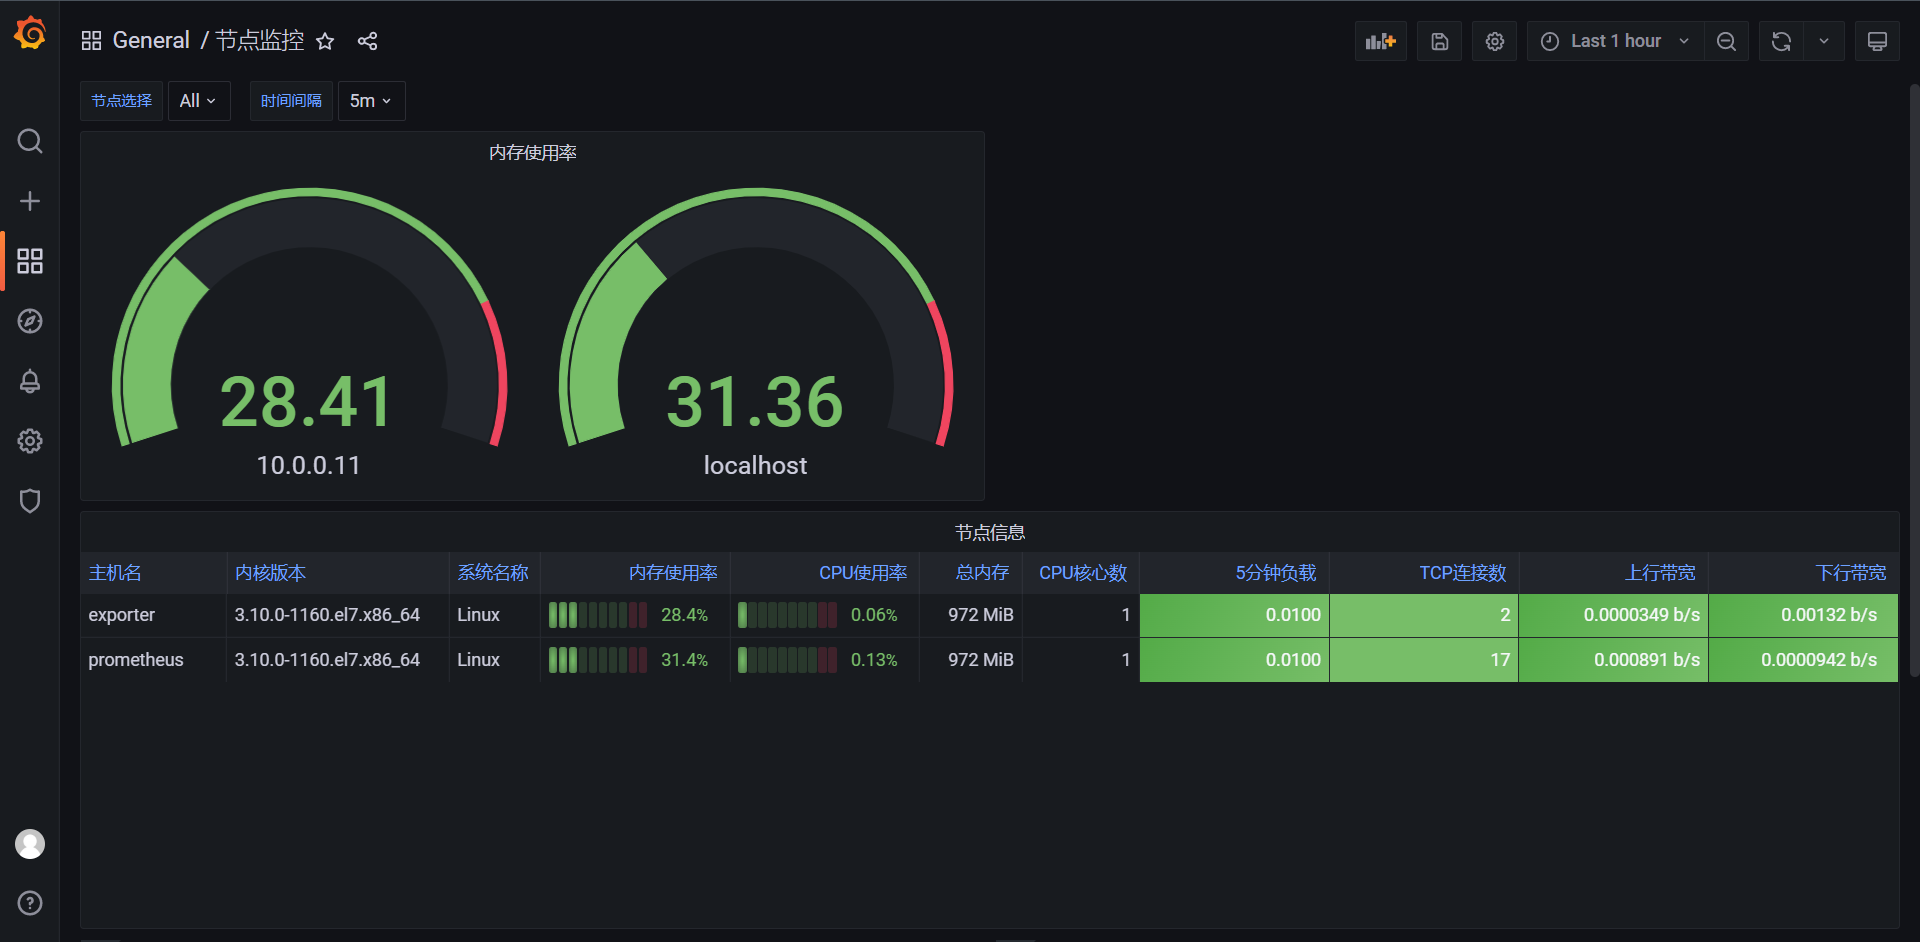
做好如上图


除了上面瞄准的仪表盘外,还有条形式仪表盘,该面板可以显示一个或多个条形仪表,同样我们可以用来展示CPU使用率内存使用率等
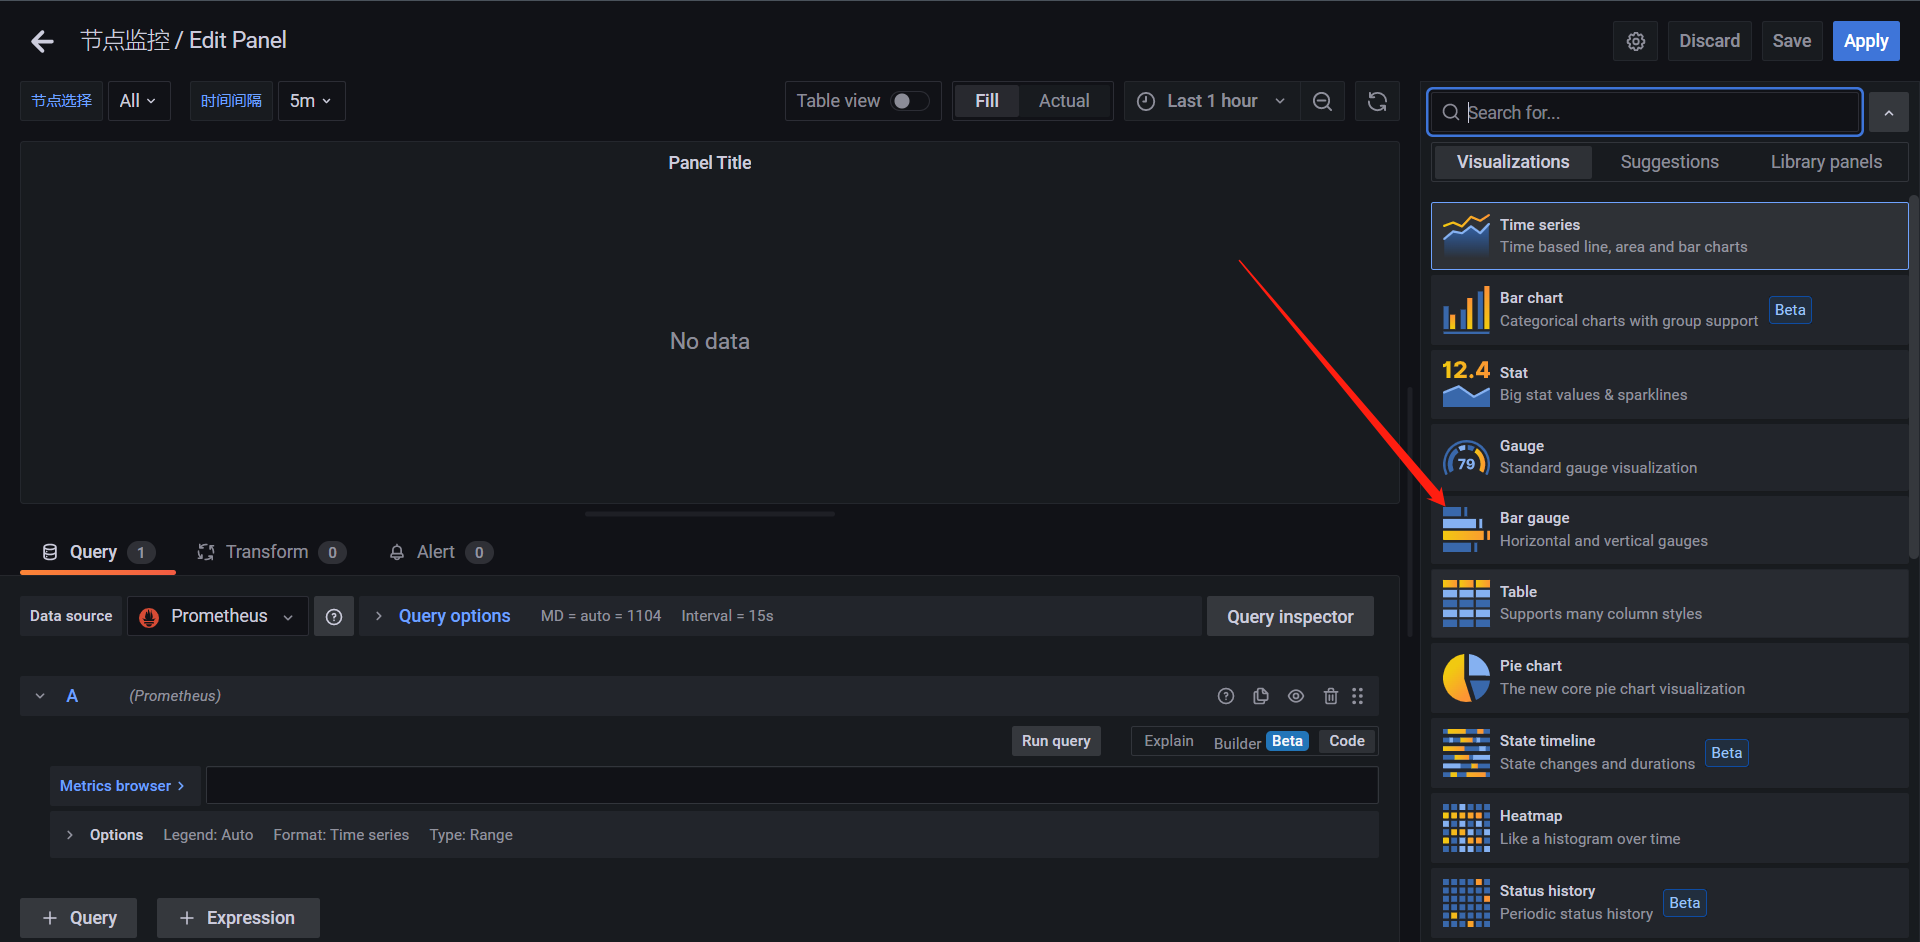
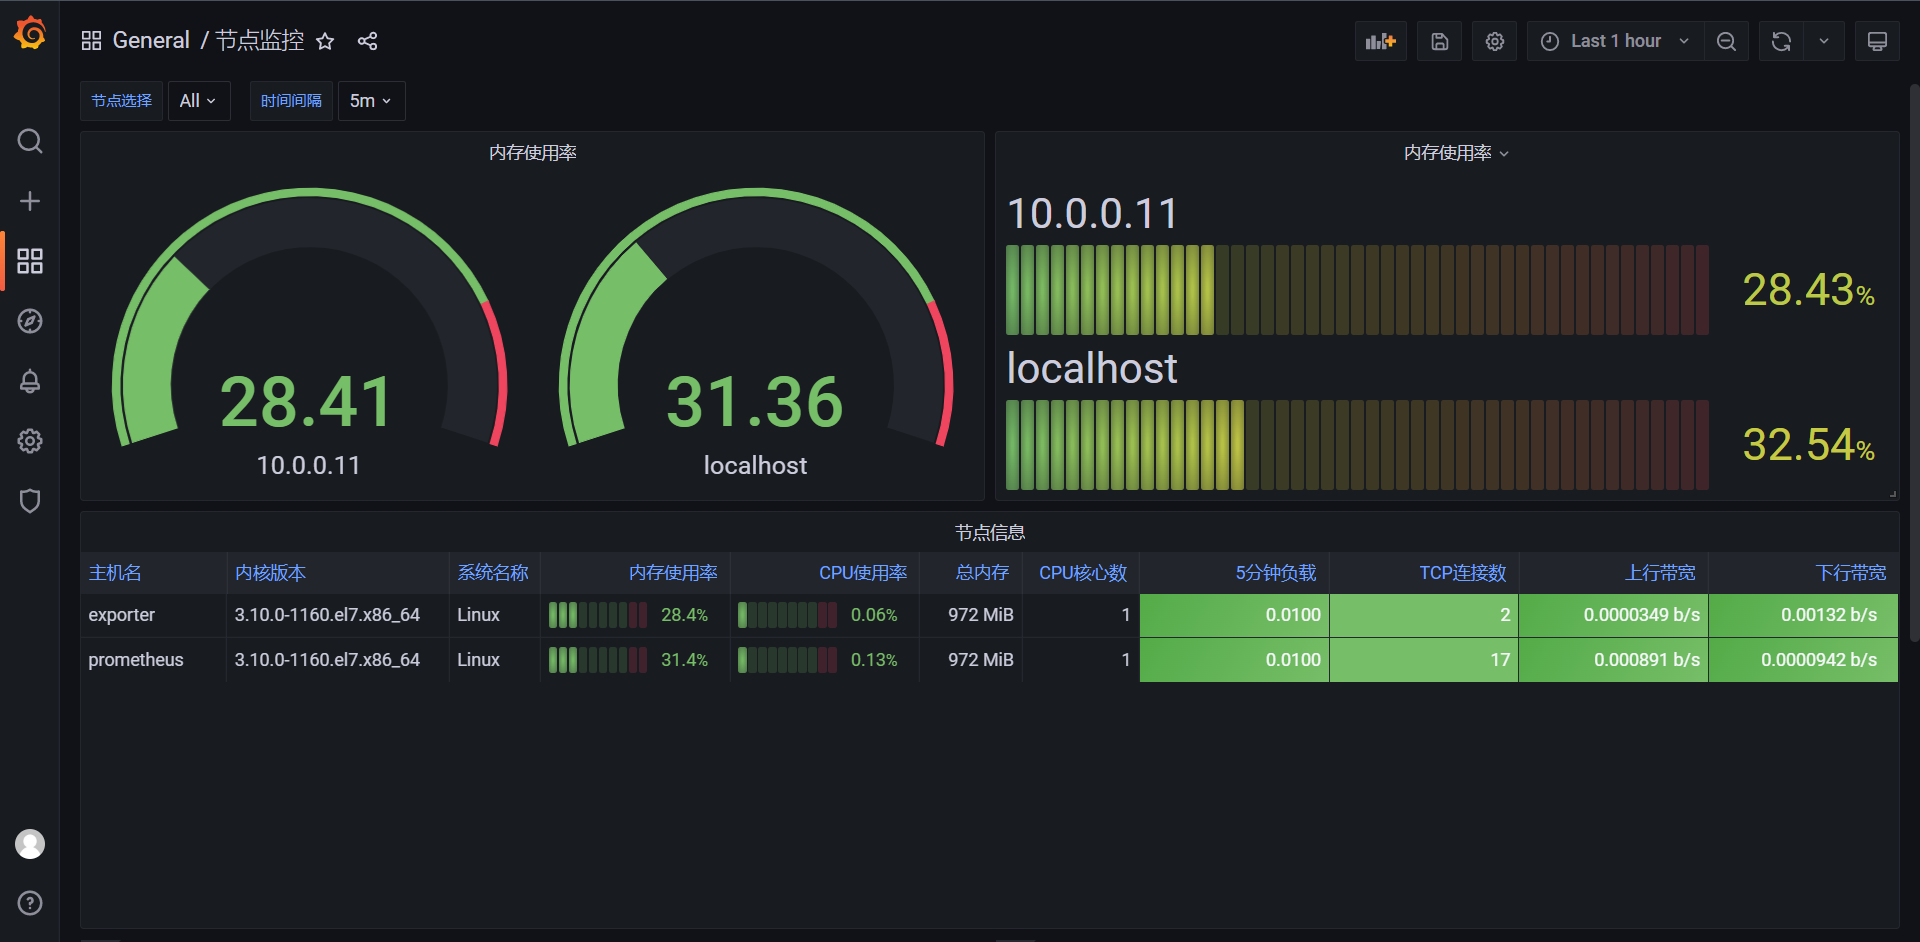
这是另一种方式的Guage
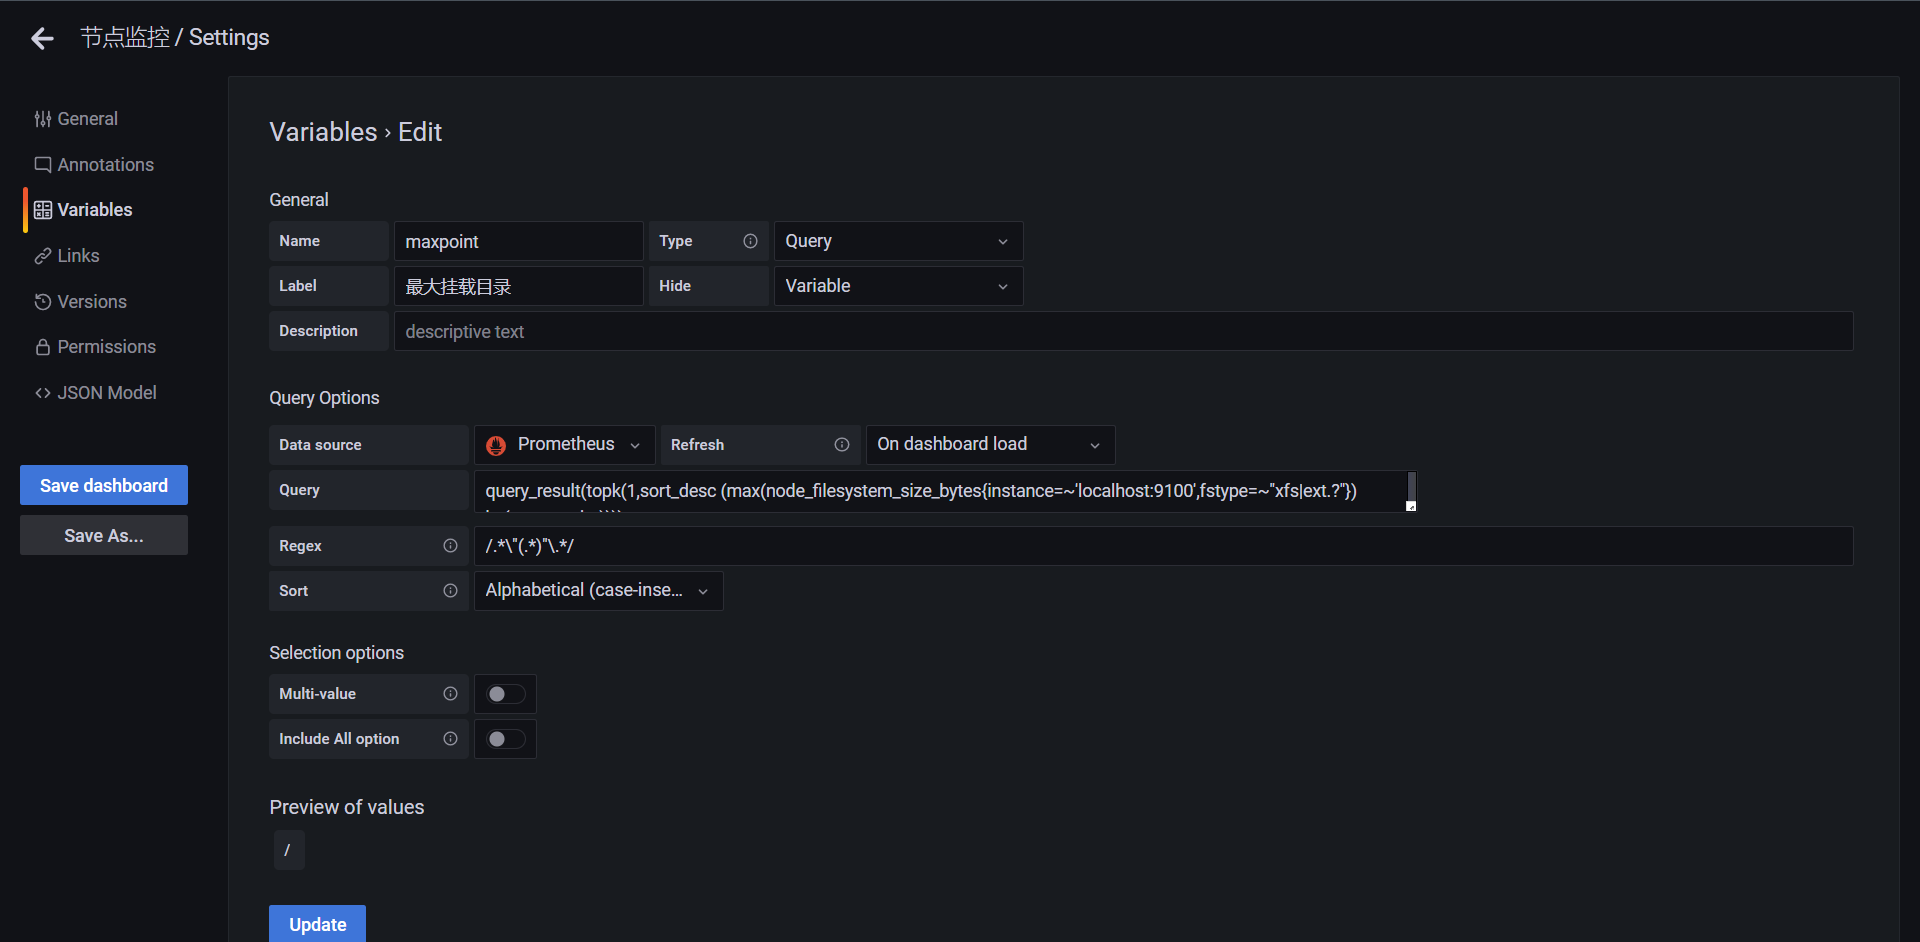
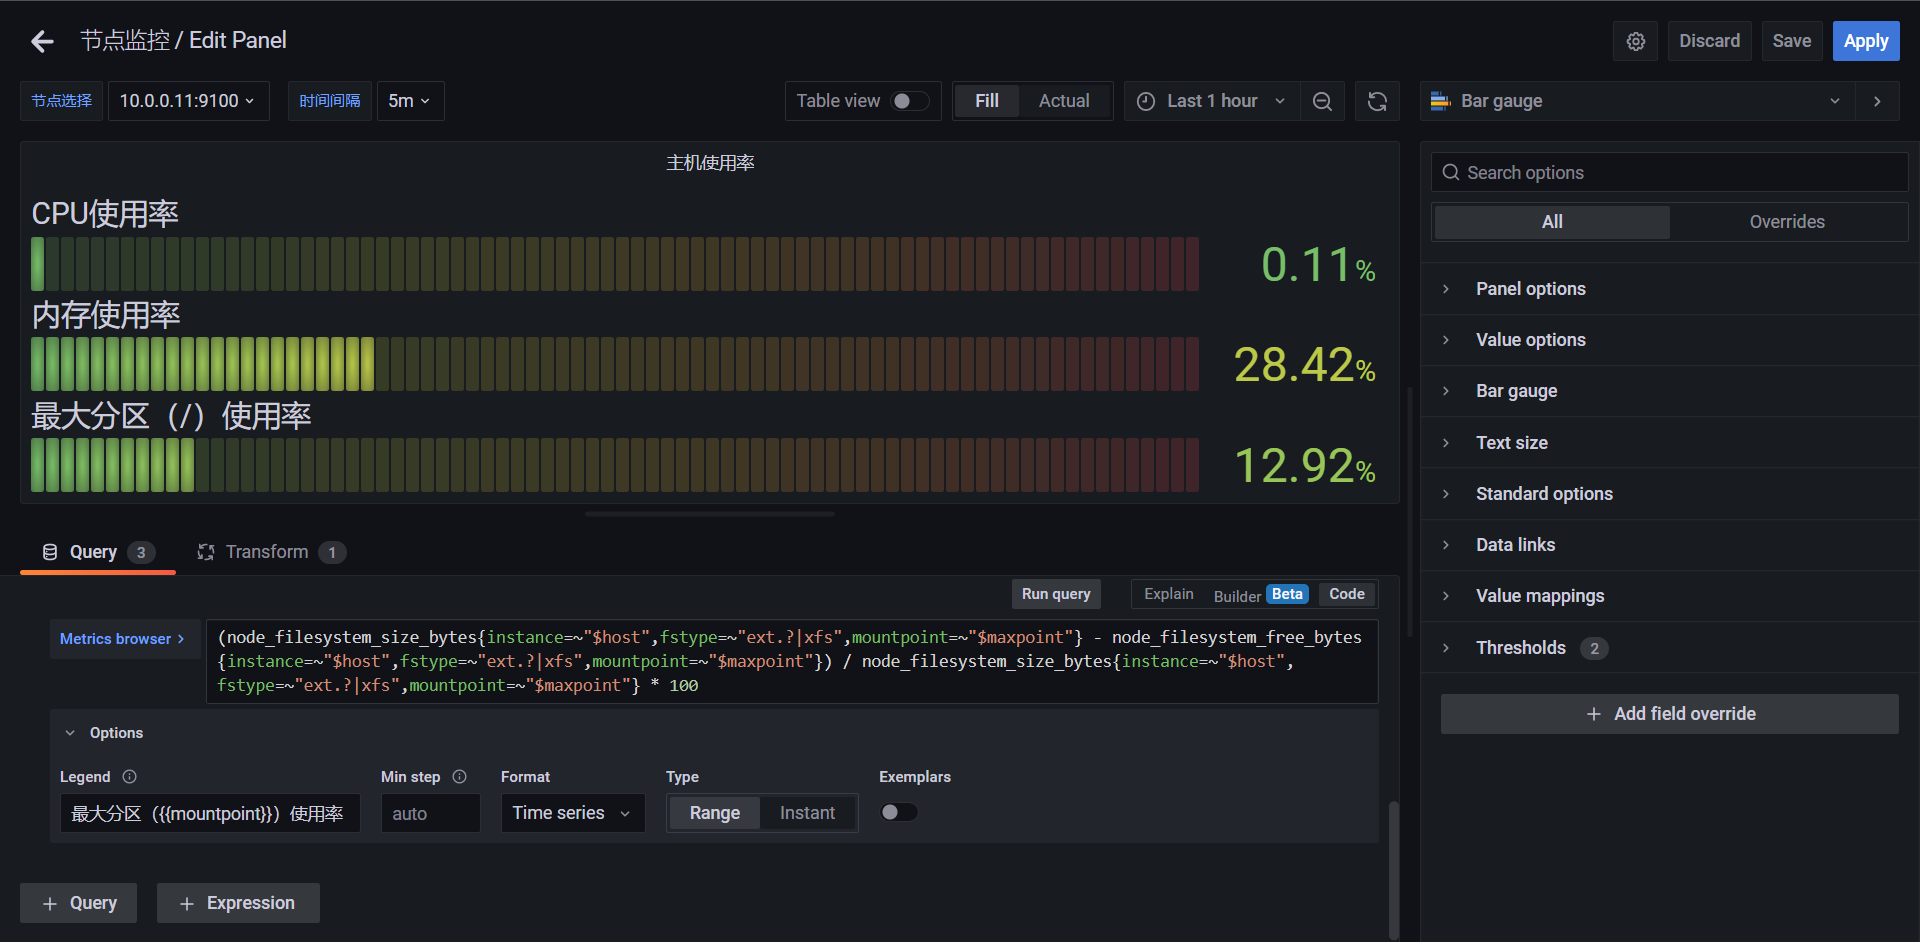
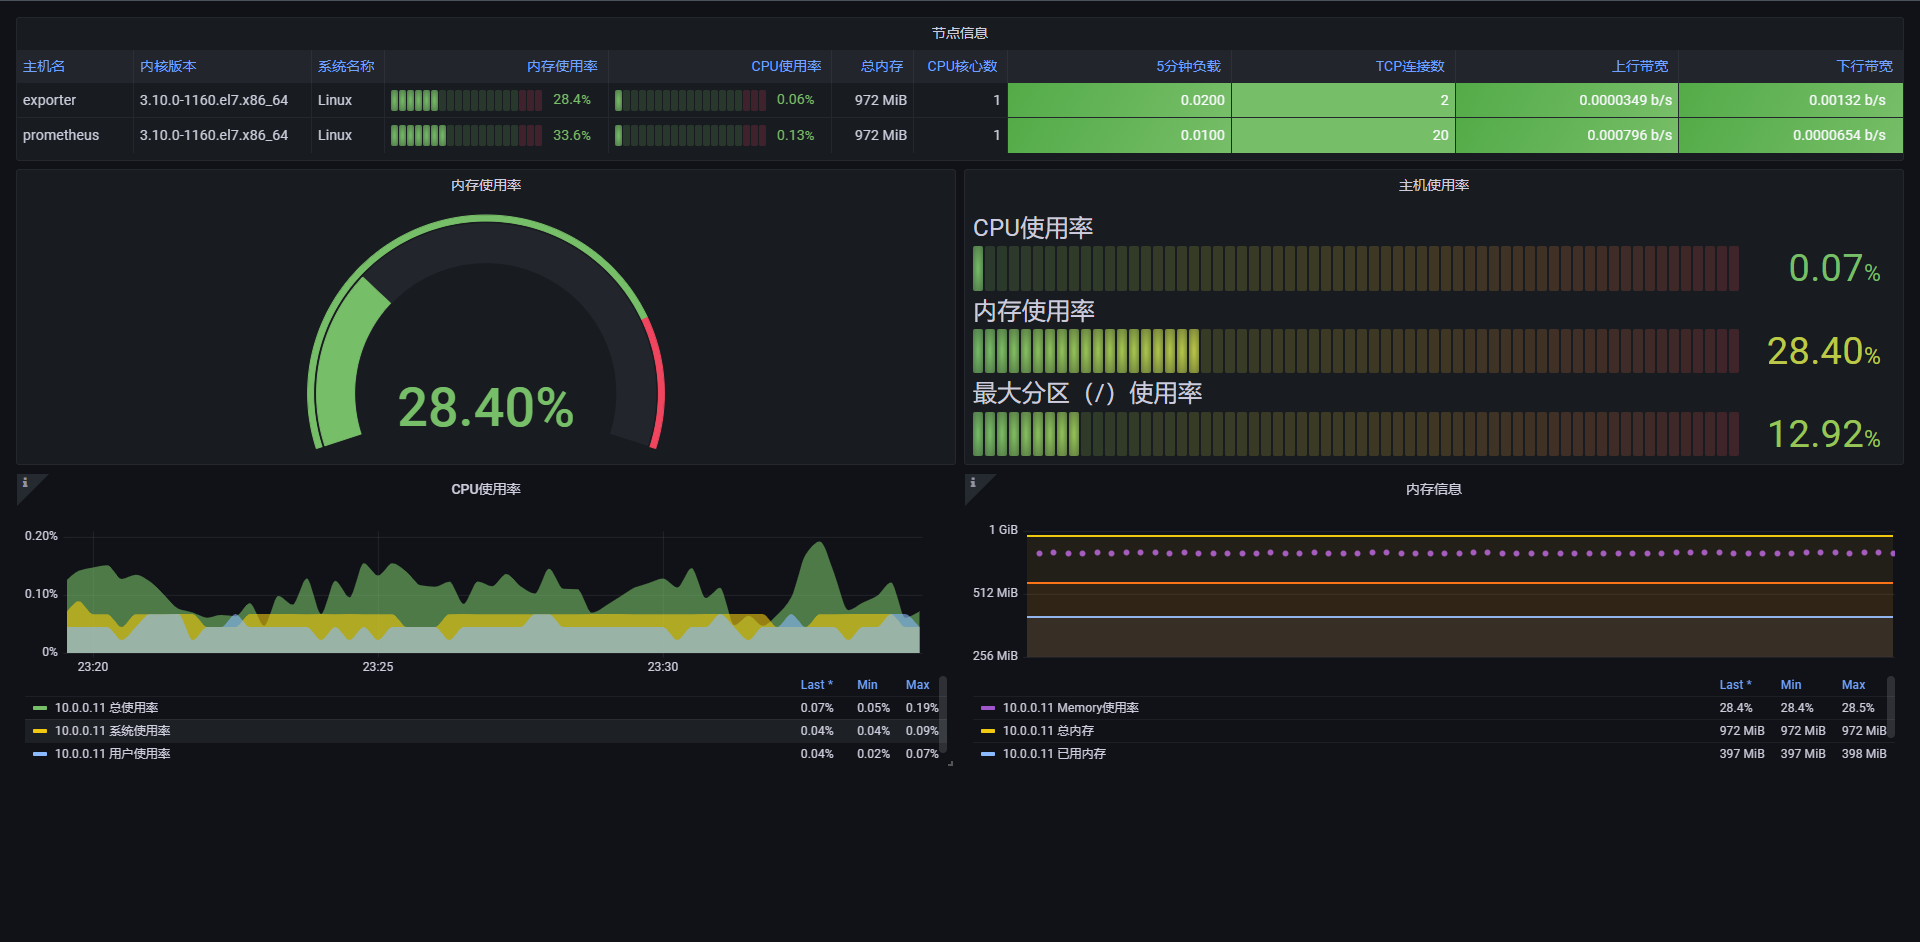
最终效果,这里完全是靠自己怎么去排版的,这个谁说了也不算,只能看自己如何配置面板
14.6:统计面板
统计面板可以用于显示一个大的统计值和一个可选的背景色,我们可以使用阈值来控制背景色或者颜色值,但该版面已经取代了Grafana 7.0中弃用的Singlestat,接下来我们使用该面板来统计几个监控数据,比如节点运行时间,CPU核心数,总内存大小等等
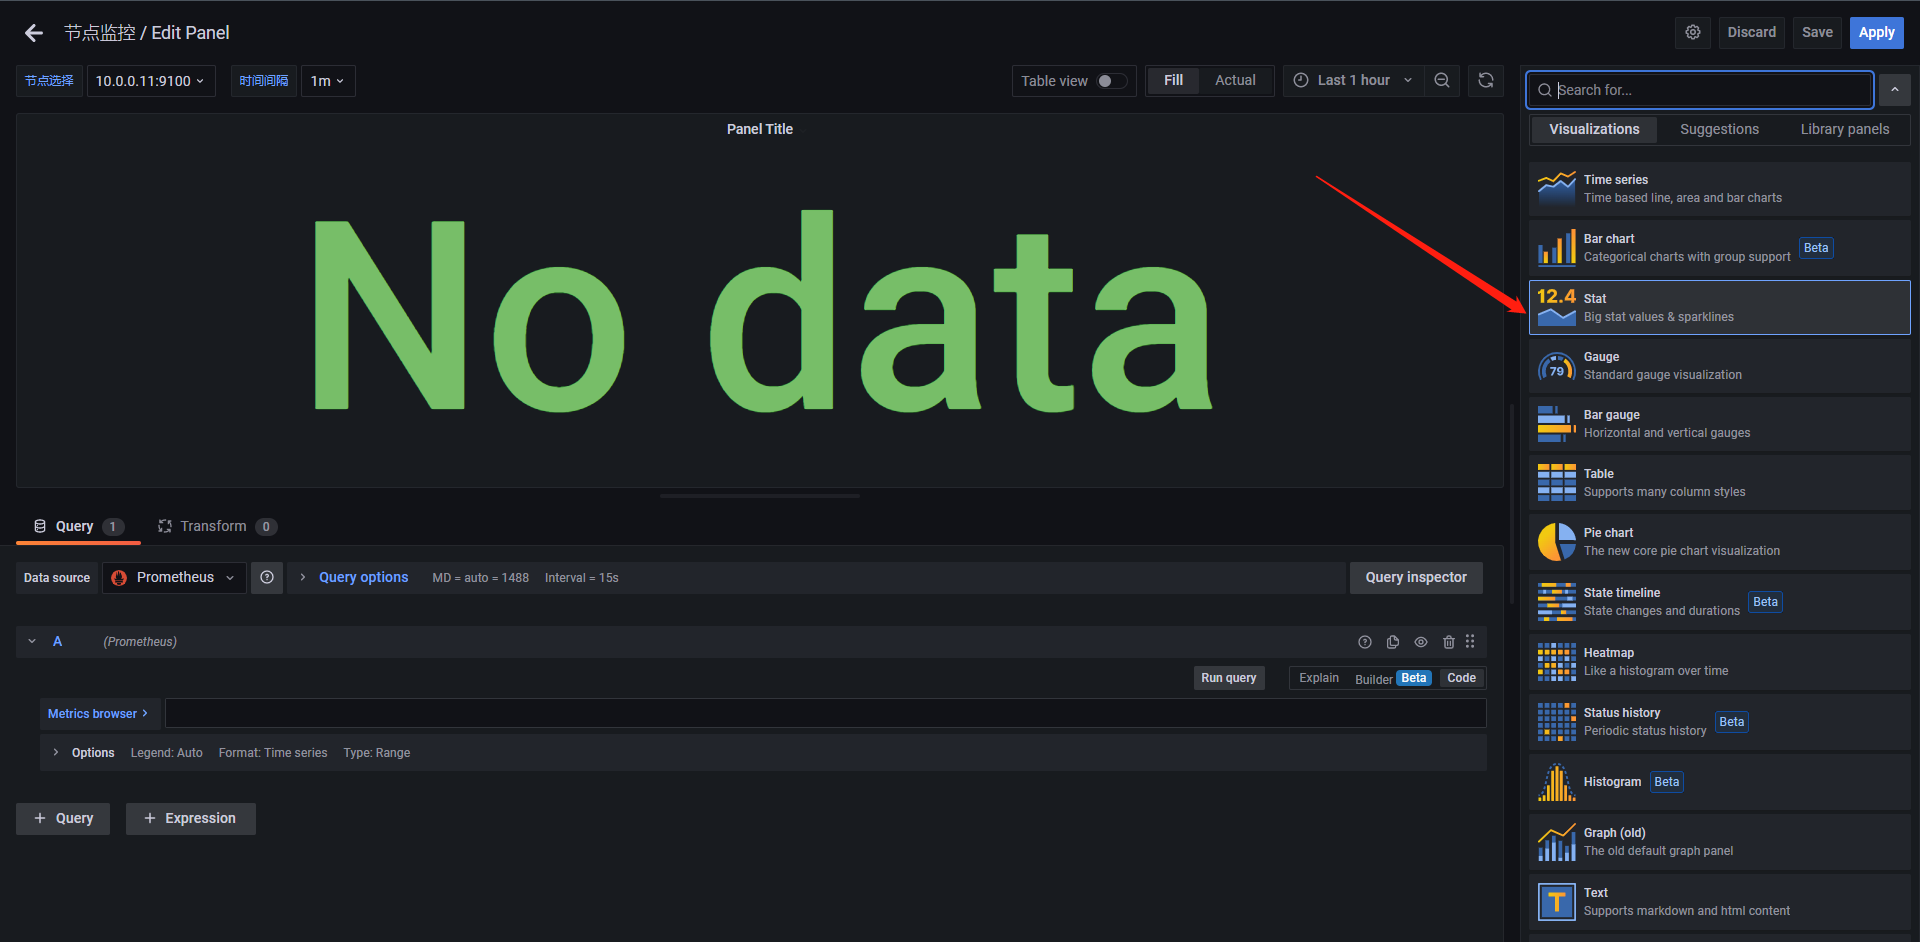
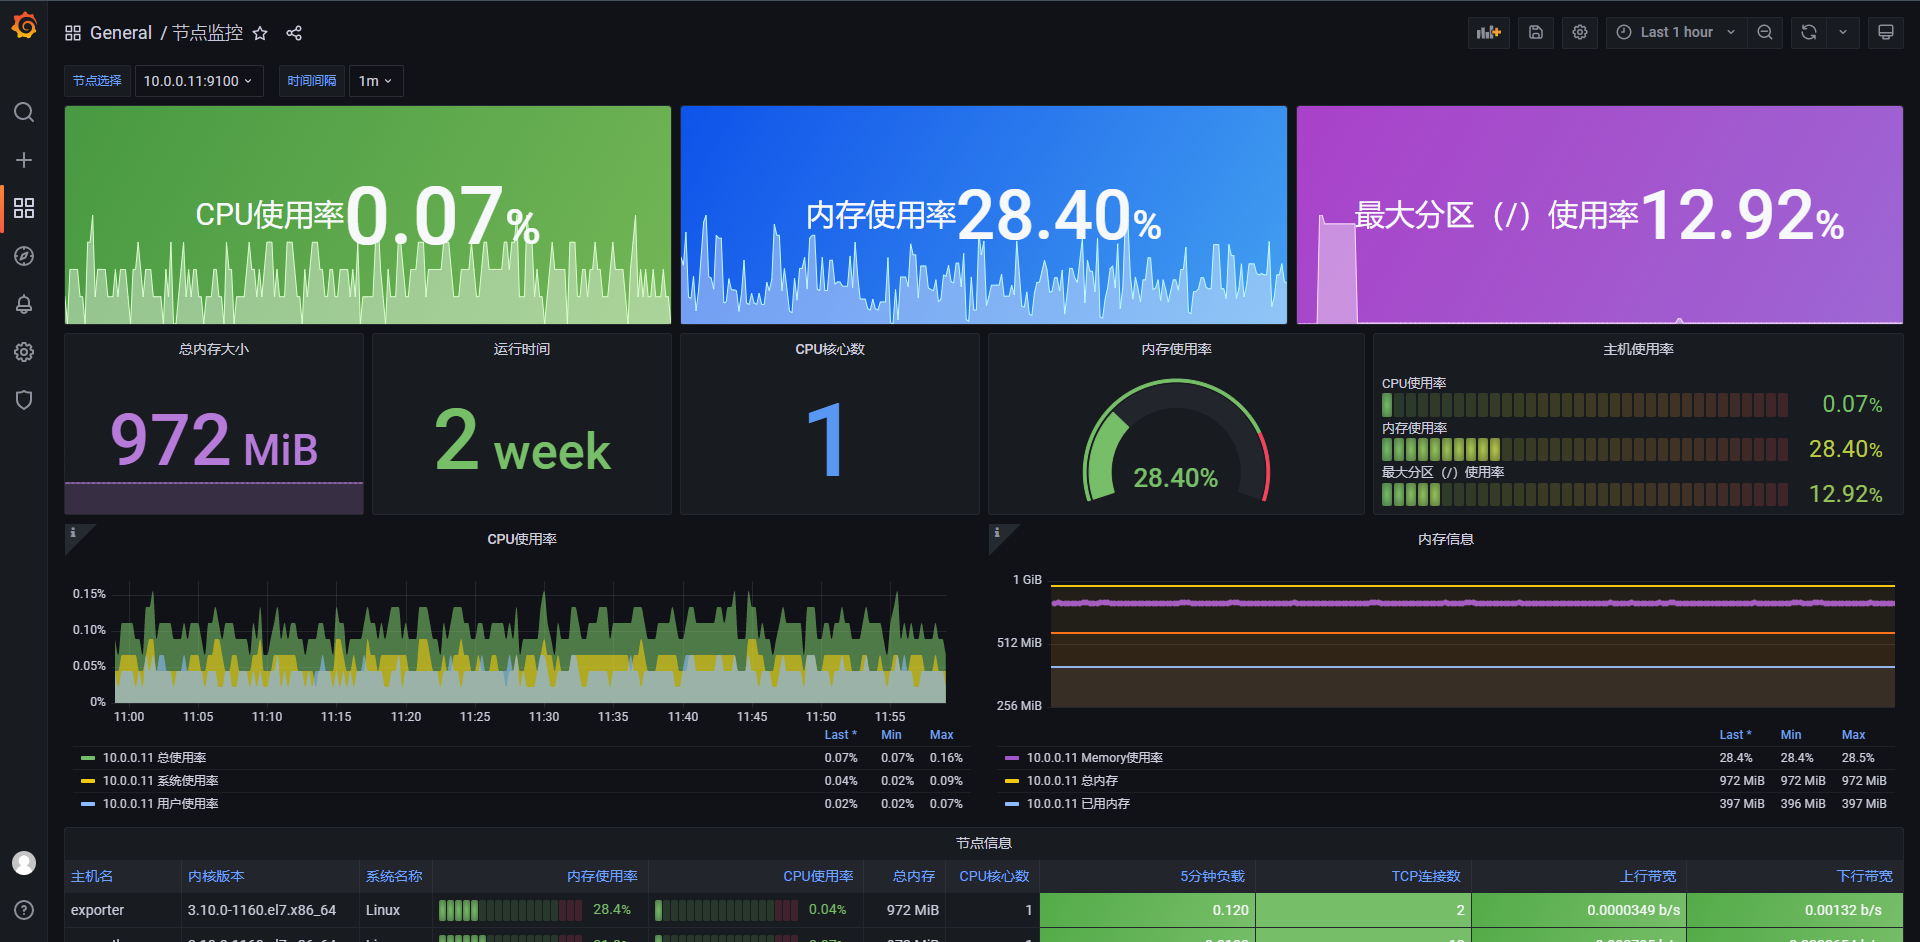
整体的Dashboard完成后就是这样子的,我这里其实数据都是重复的,大家可以完全根据需求去定制自己的仪表盘。
14.7:文本面板
前面我们学习了一些面板基本上都是通过查询来获取数据进行展示的,这里给大家另外一个面板:文本面板,该面板不需要查询语句,直接用来展示文本信息,而且是支持 Markdown 和 HTML 两种格式,这就为我们提供了很大的定制灵活性。

文本面板的使用非常简单,直接选择使用 Markdown 还是 HTML 来设置文本样式即可,然后在面板编辑器的文本框中输入内容即可。比如很多公司业务太大太多,需要监控的 Dashboard 非常多,操作管理起来非常麻烦,这个时候我们就可以使用文本面板来做一个导航页面进行归类。

那么接下来我们来实战一下
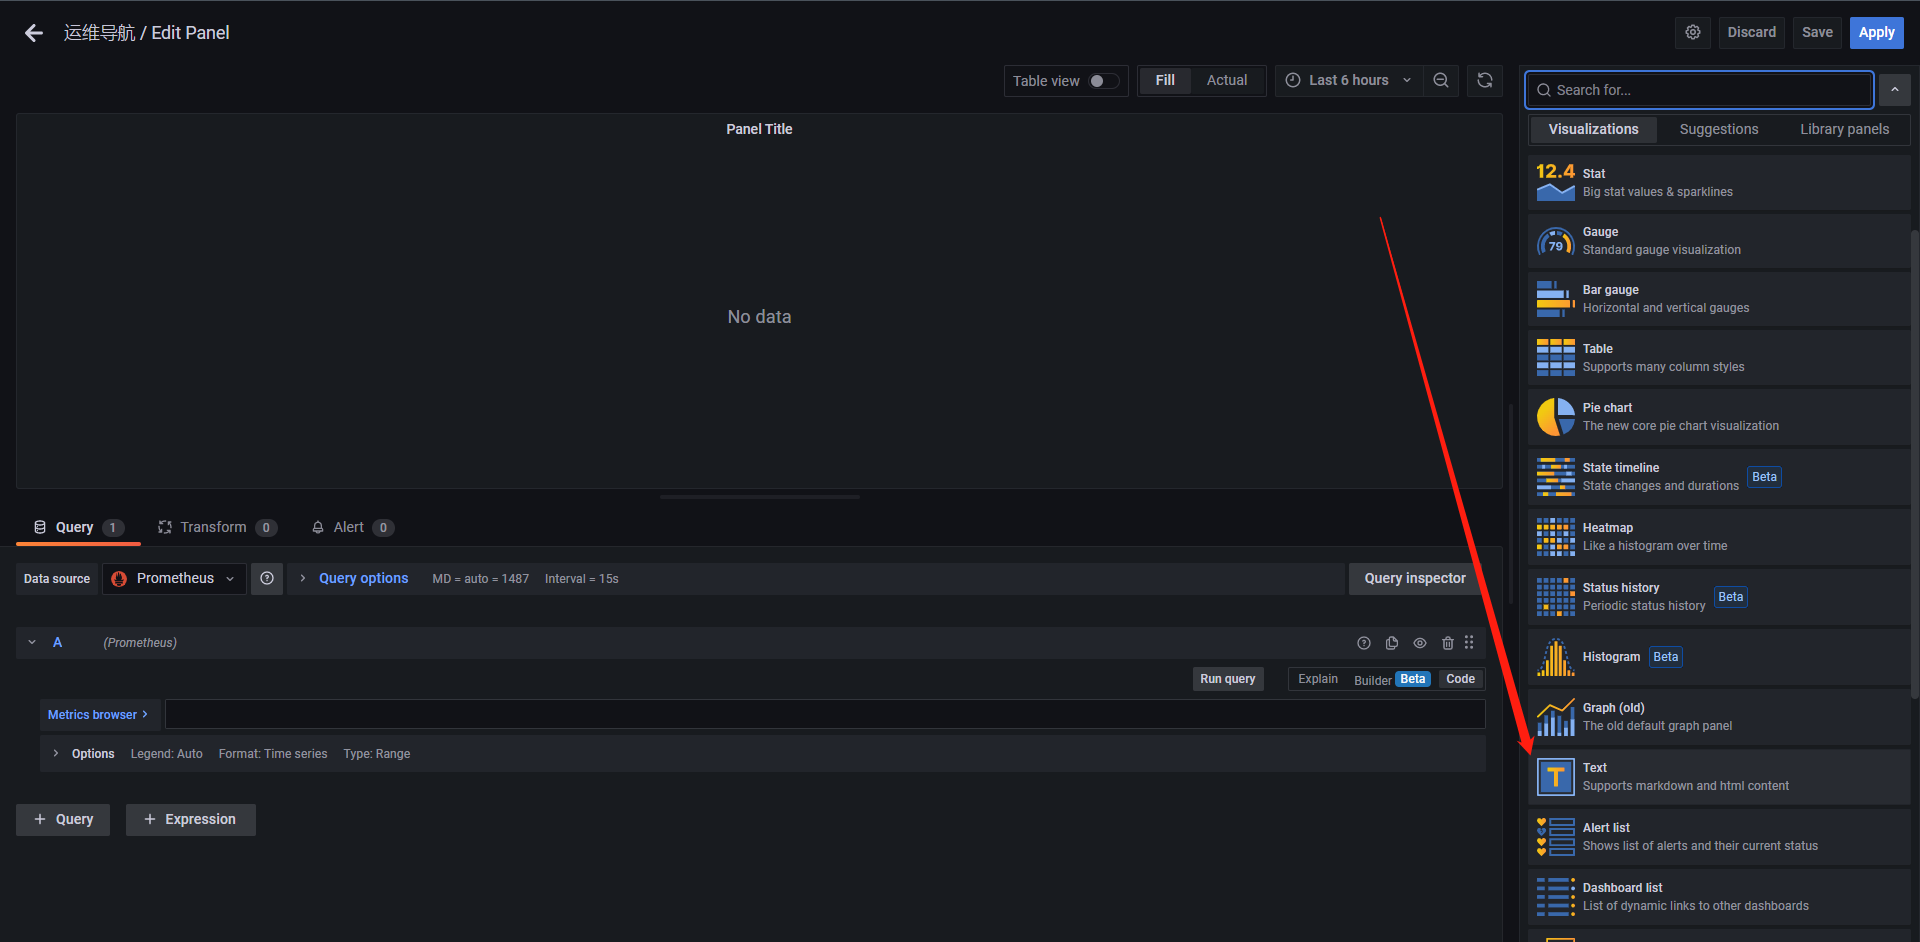
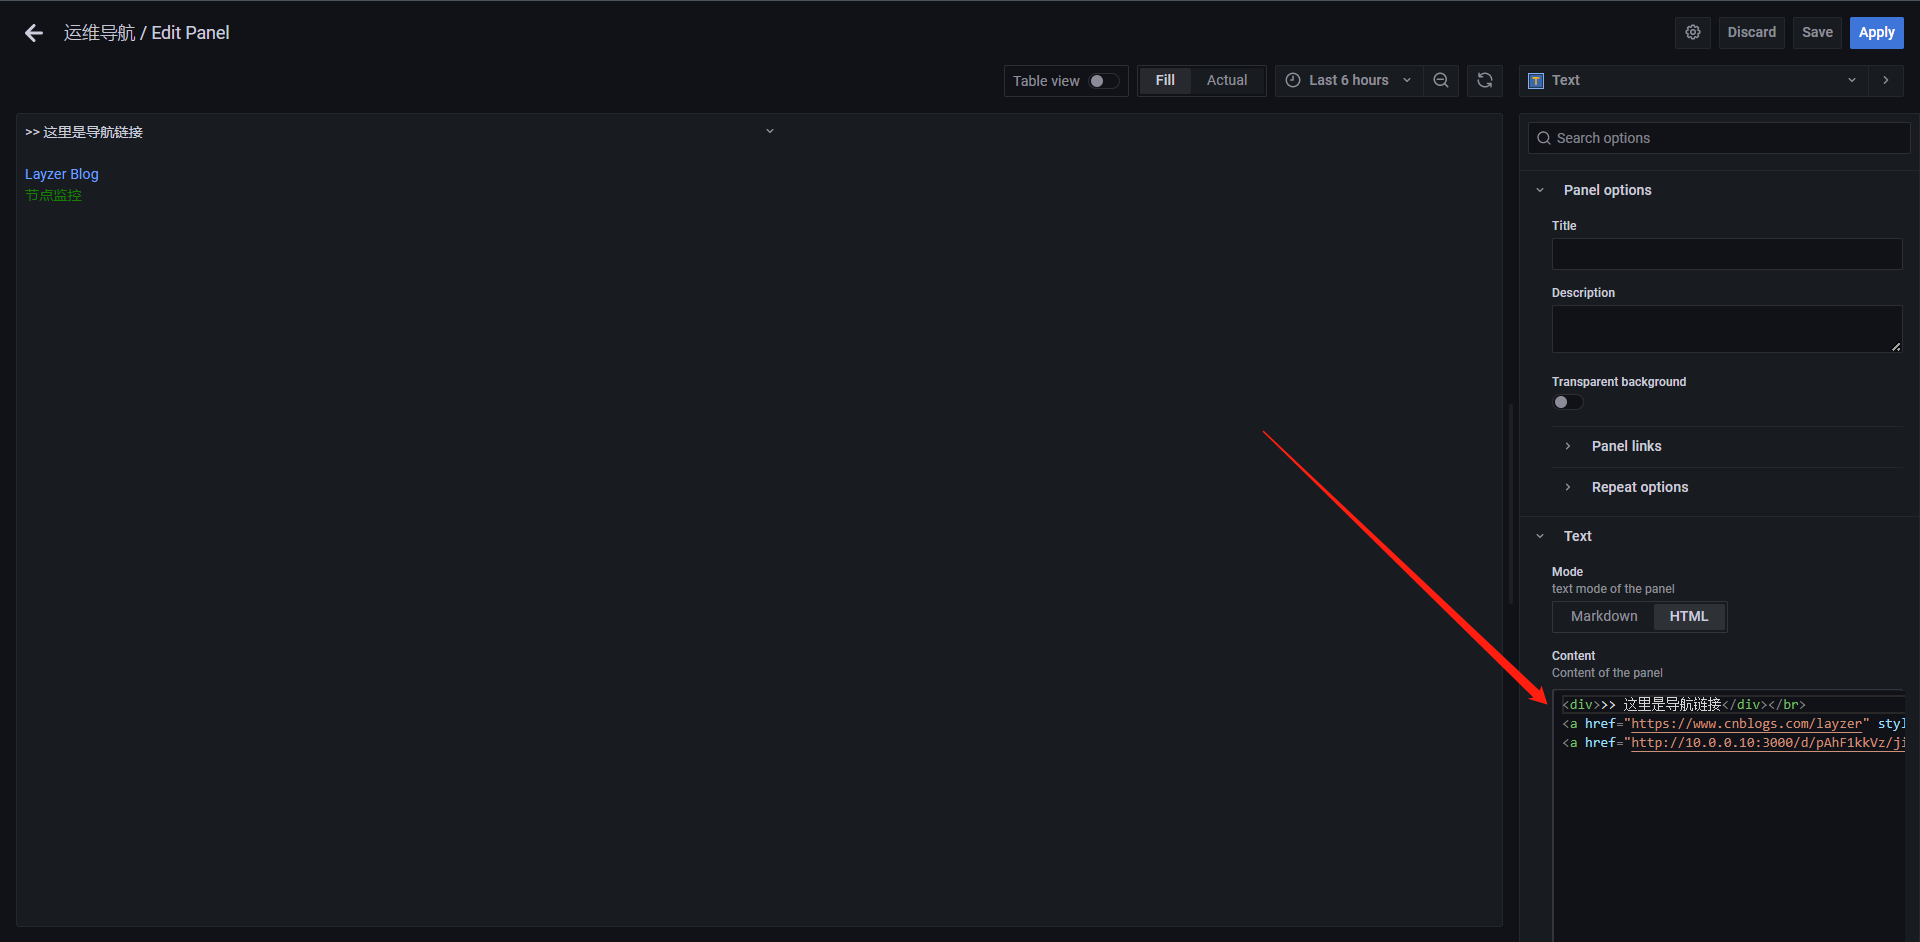
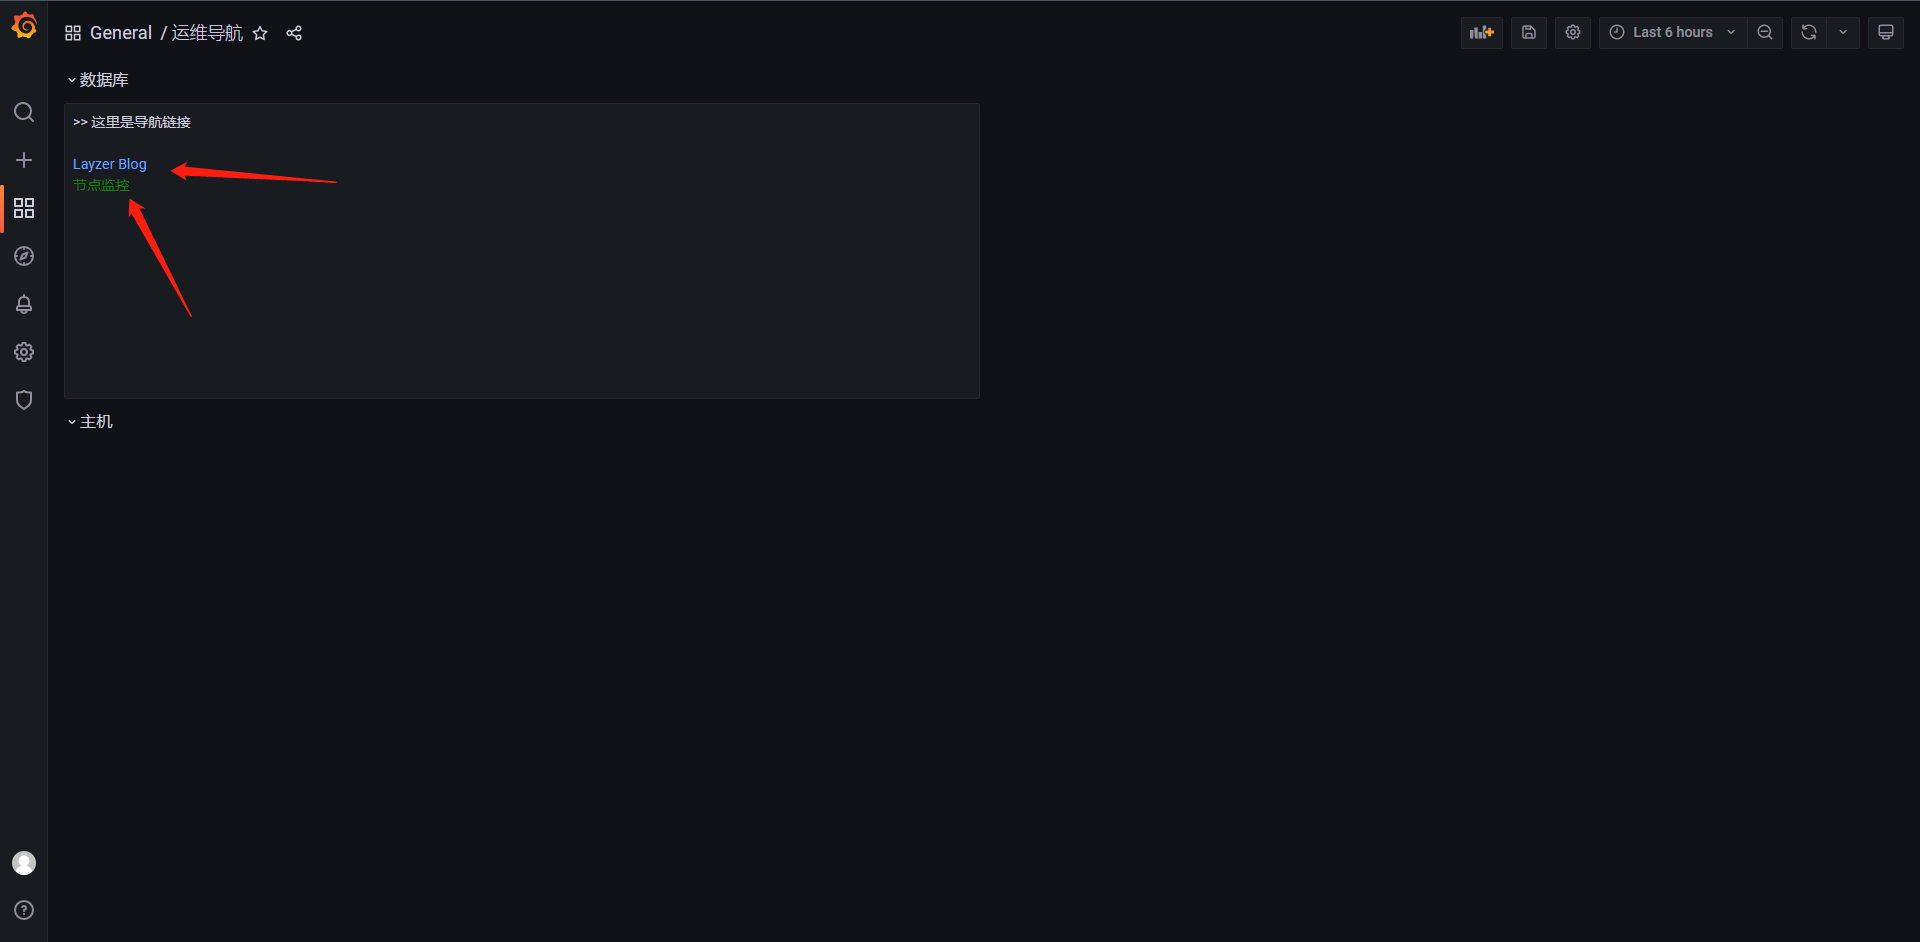
当然了这里支持HTML与MarkDown的语法,我这里使用的是html语法来写的一个简单的页面,我们完全可以把它当作一个html页面来使用,它就可以实现点击跳转。
14.8:注解(annotations)
Grafana其实还提供了一个Annotations的注解方法,通过该方式可以在图形上标记一个点,当鼠标悬停在上面的时候,可以获取该注解的具体信息,我们可以在Panel面板中某一个点标记注释,也可以在某一个区域添加注释

Grafana带有本地注释存储,并且能够直接从图形面板或通过HTTP API添加注释事件。

在某一个点添加注释,我们只需要按住ctrl/cmd点击鼠标左键,当然也可以直接点击左键然后点击弹出的 `add annotations`添加注解,当然了标签是可以添加多个的,当添加区域注释时我们可以按住ctrl/cmd并选择区域来创建注释
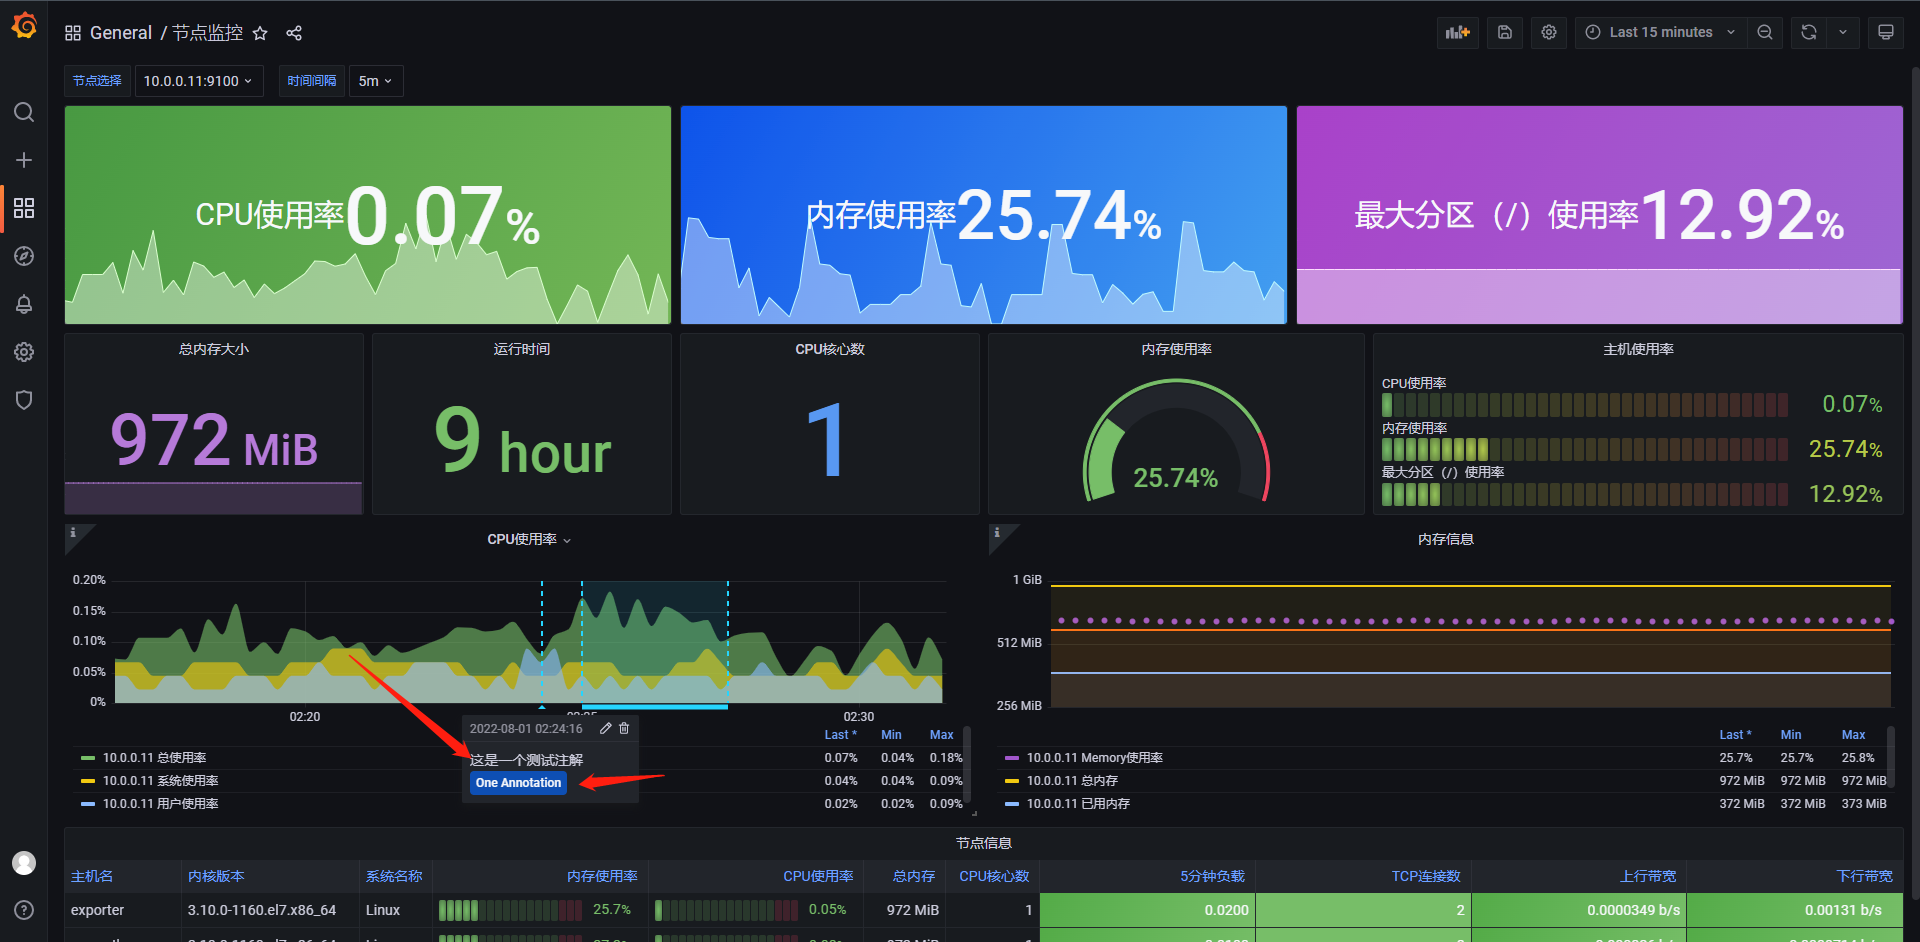
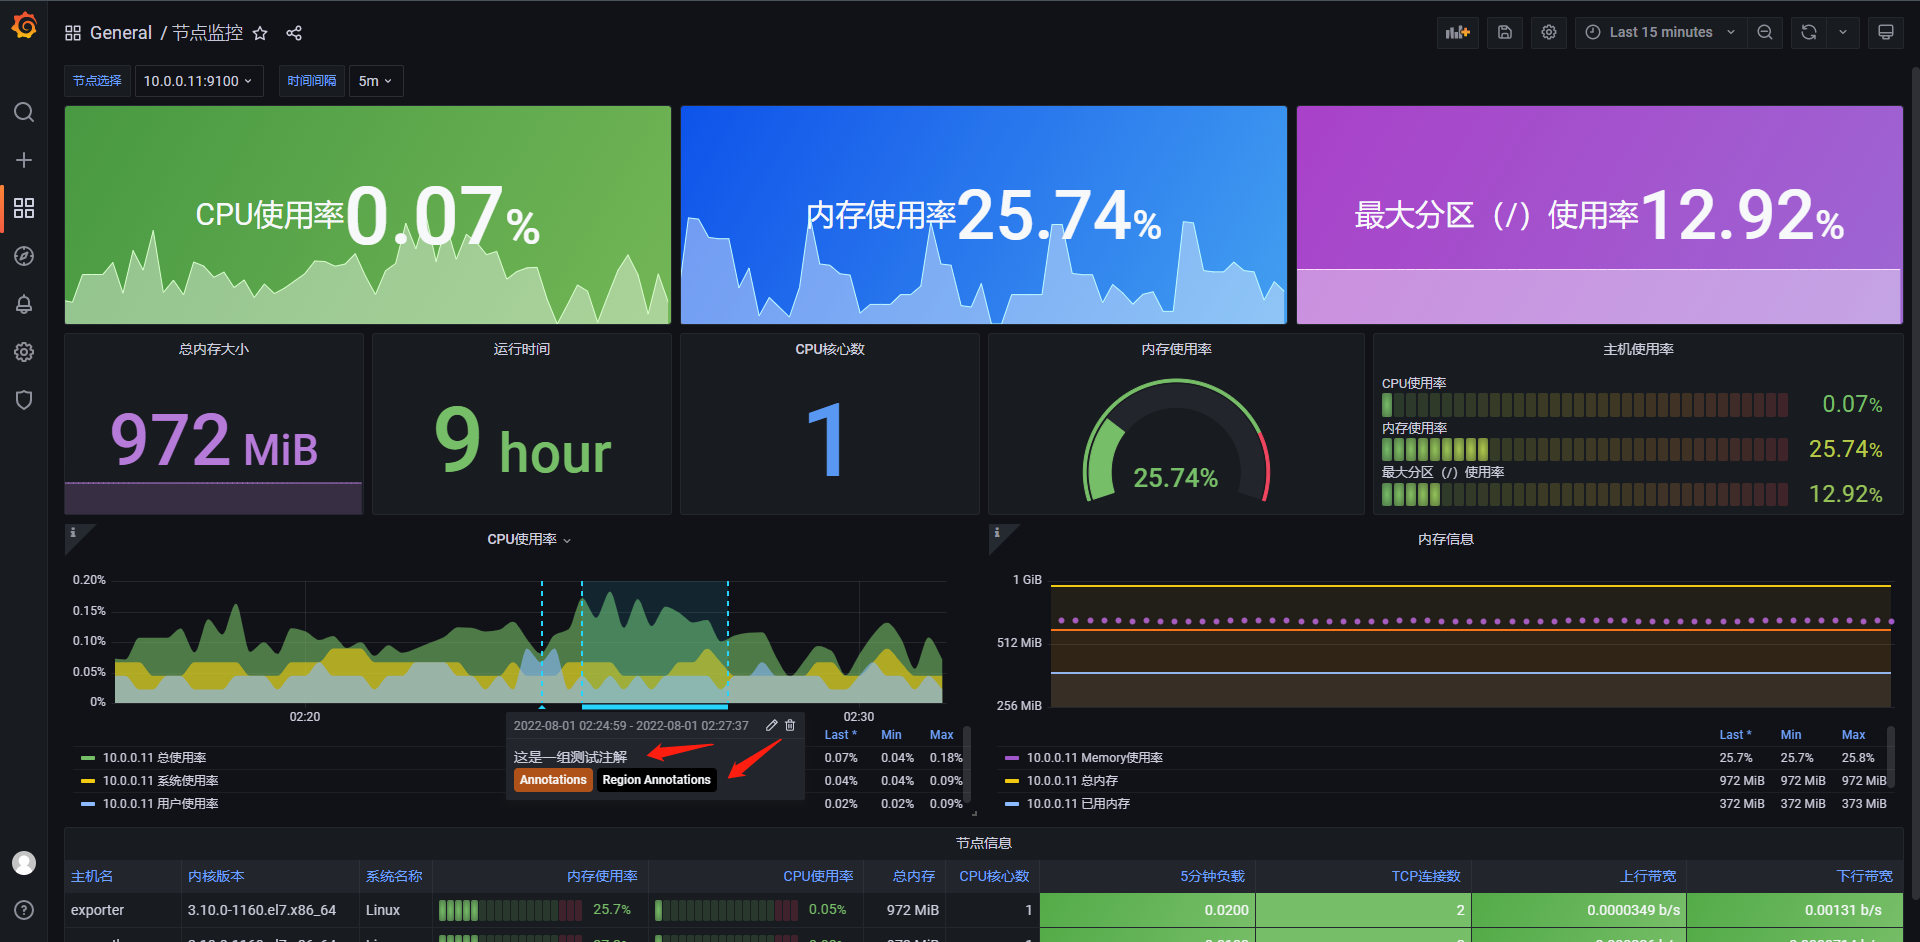
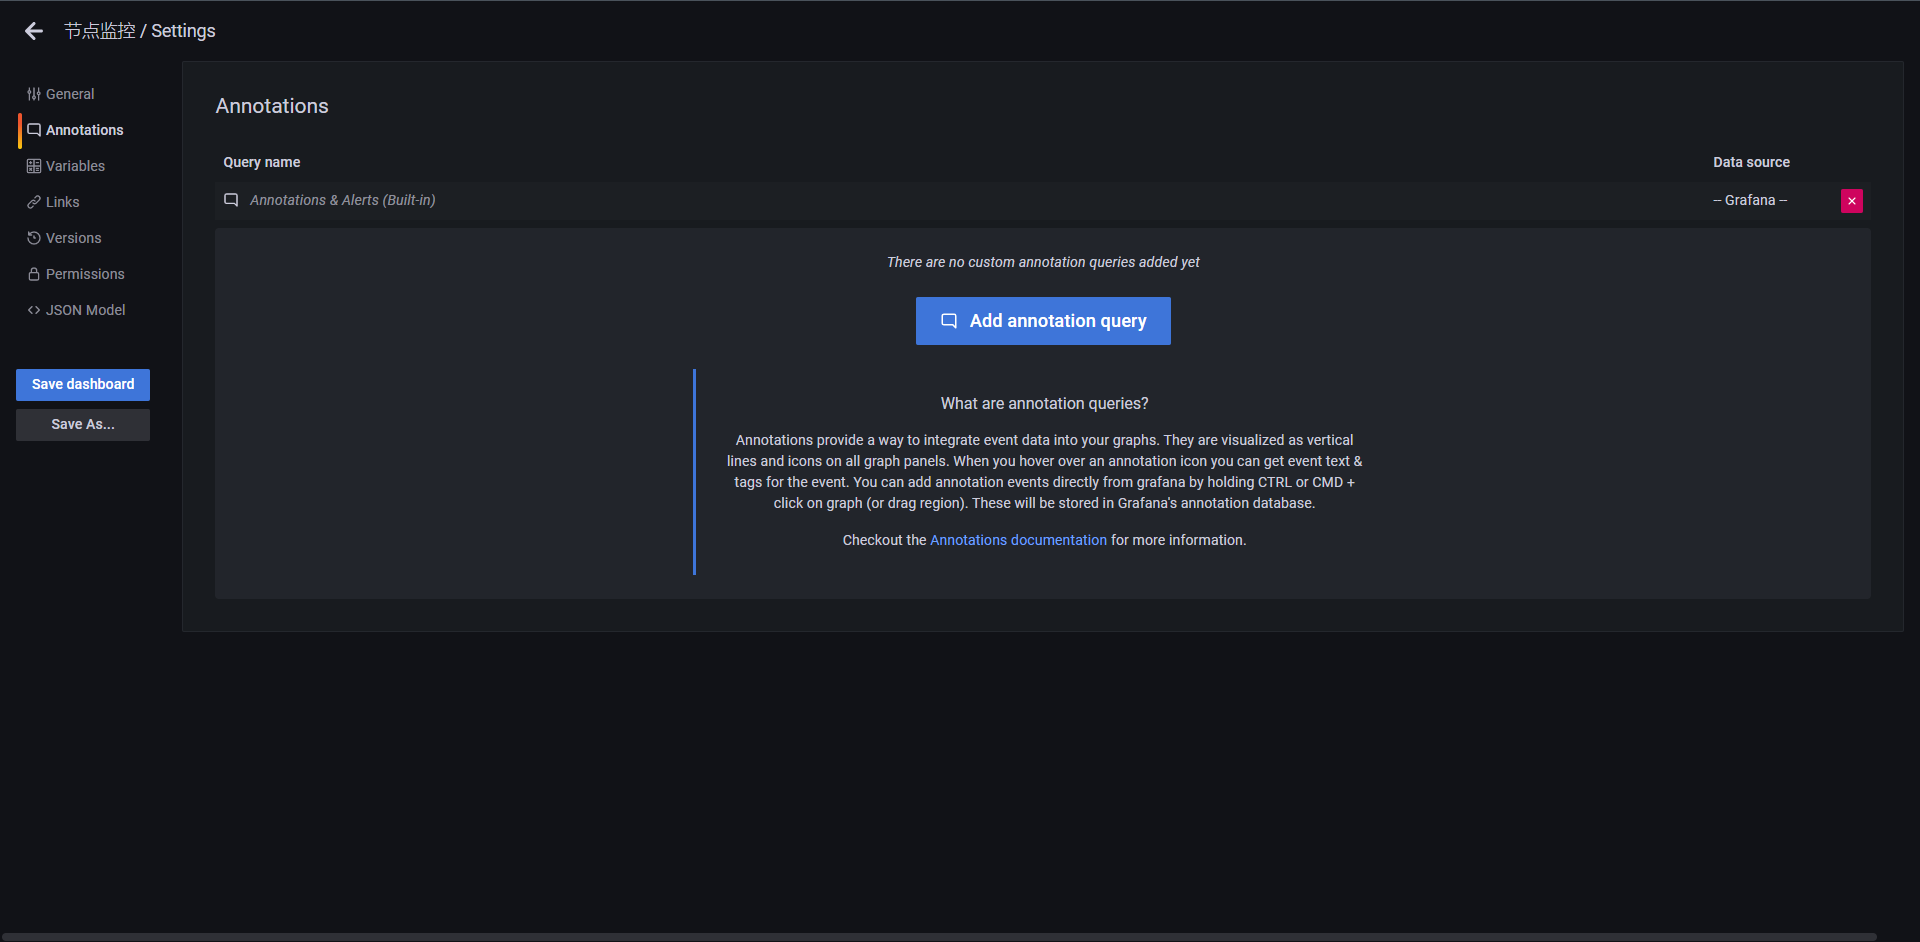
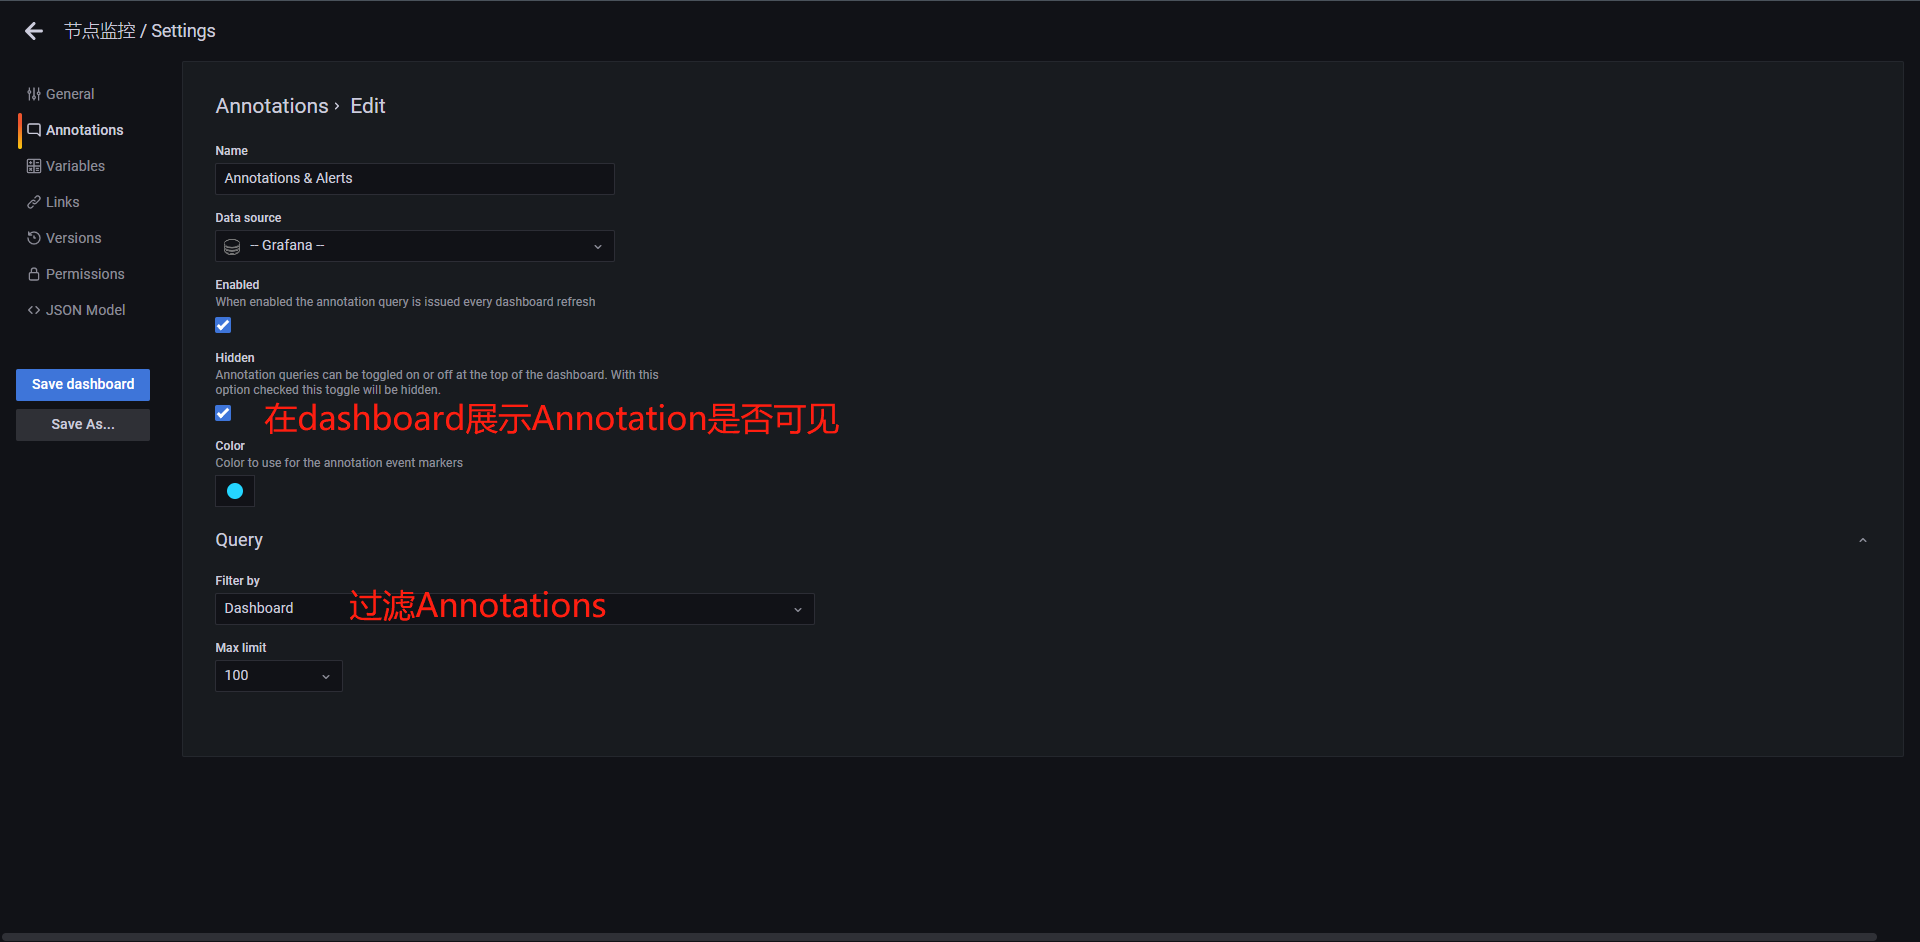
14.9:告警渠道
Grafana除了支持丰富的数据源和图表功能之外,还支持告警功能,该功能也使得Grafana从一个数据可视化工具成为一款真正的监控利器,Grafana可以通过Alerting模块的配置把监控数据中的异常信息进行告警,告警的配置可以直接基于现有的配置数据图表进行,在告警的时候也会把出现异常的图表进行通知,使得告警更加的友好。

# 渠道

Grafana Alerting支持多种告警渠道,比如钉钉,Discord,Email,Kafka,Pushover,Telegram,WebHook等等,我们这里可以使用Email进行展示。

# Email

Email是我们最常见的告警接入方式,通过Grafana告警需要在Grafana的配置文件中配饰SMTP服务,在配置/etc/grafana/grafana.ini中,大概在626行,开启告警 820行左右
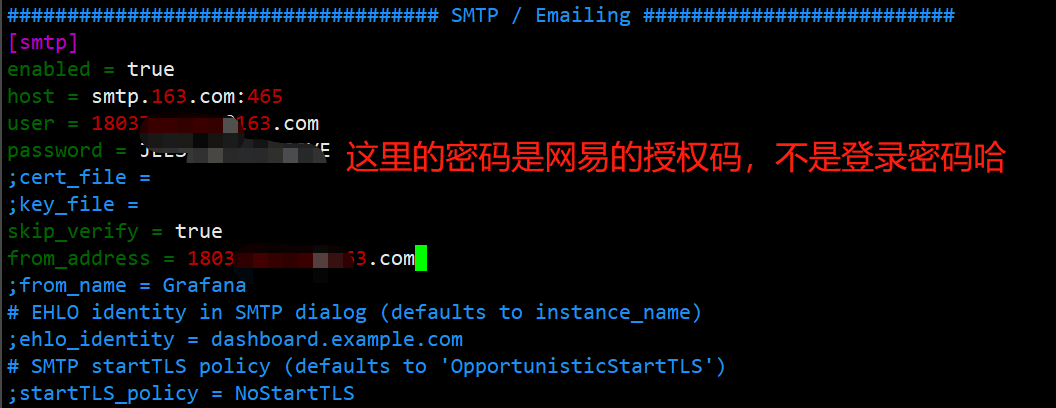
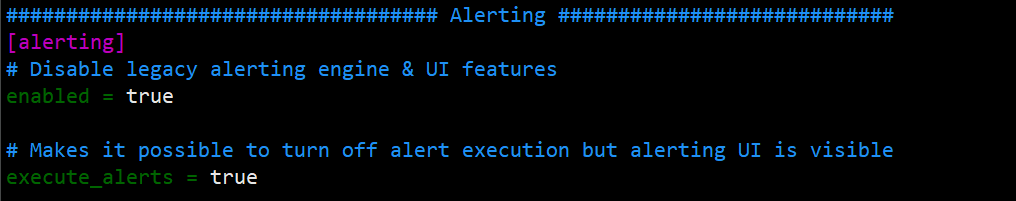
重启Grafana

[root@prometheus ~]# systemctl restart grafana-server.service

重启完成后我们接下来图解操作
14.9.1:配置通知渠道
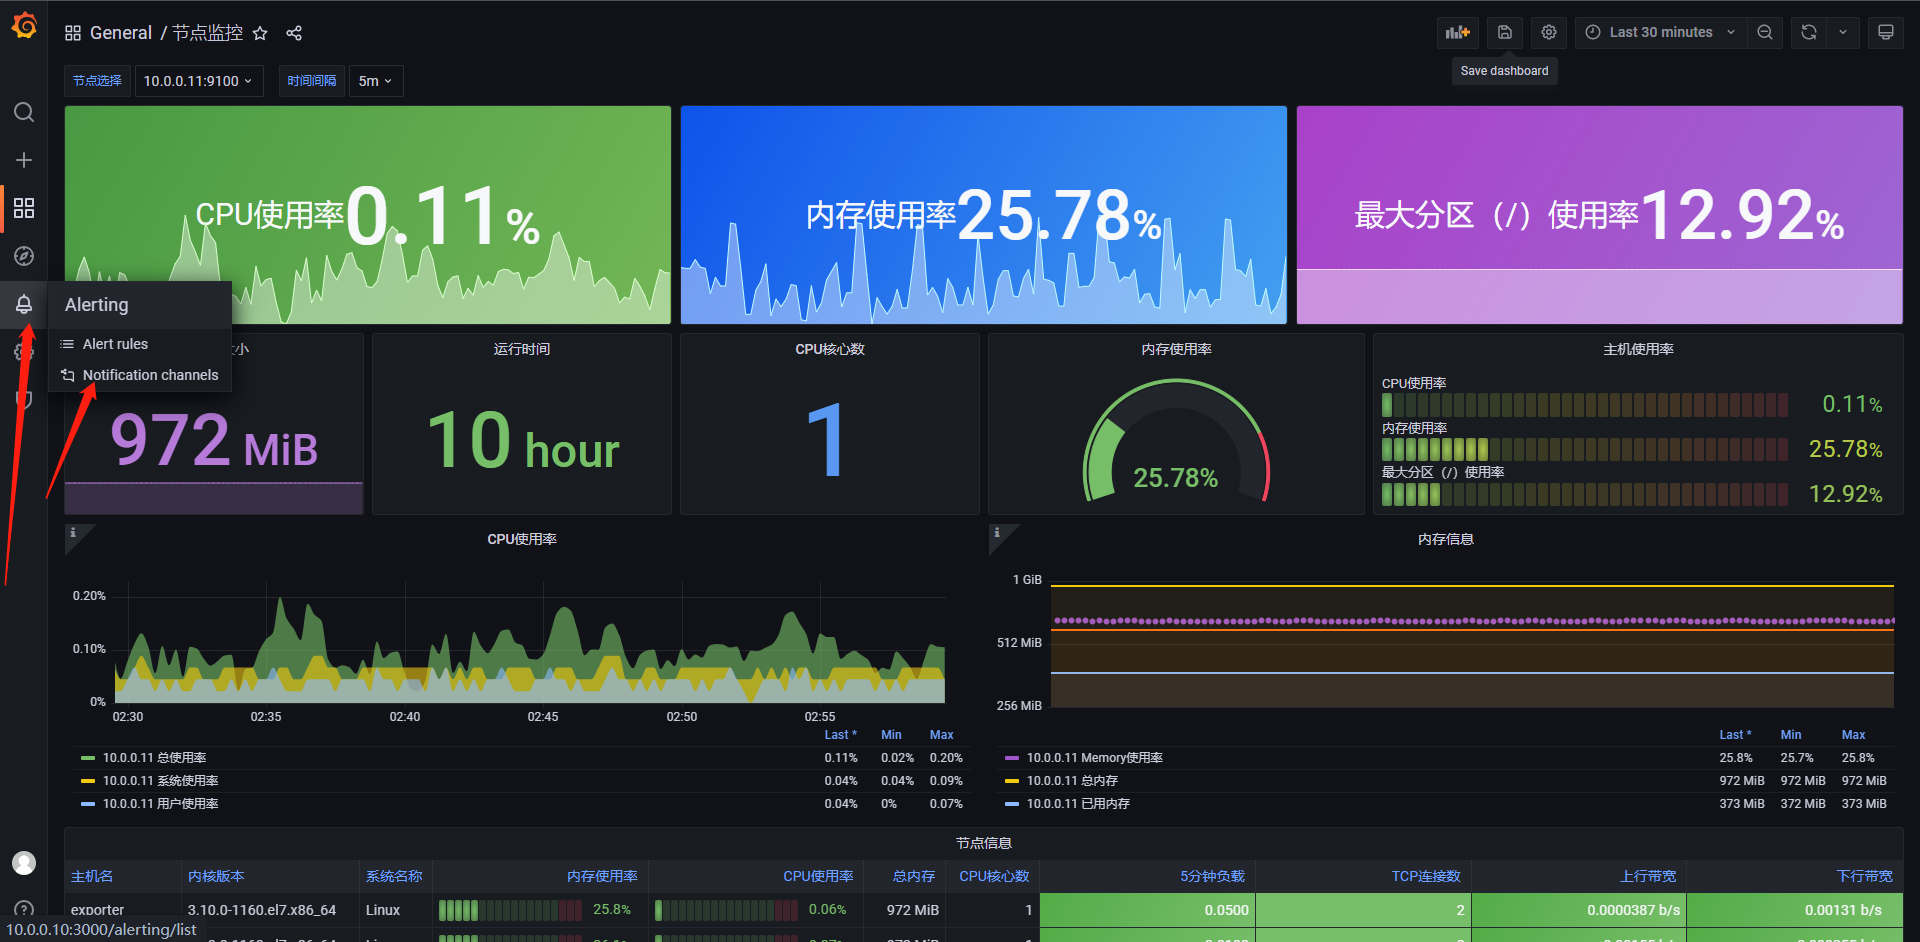
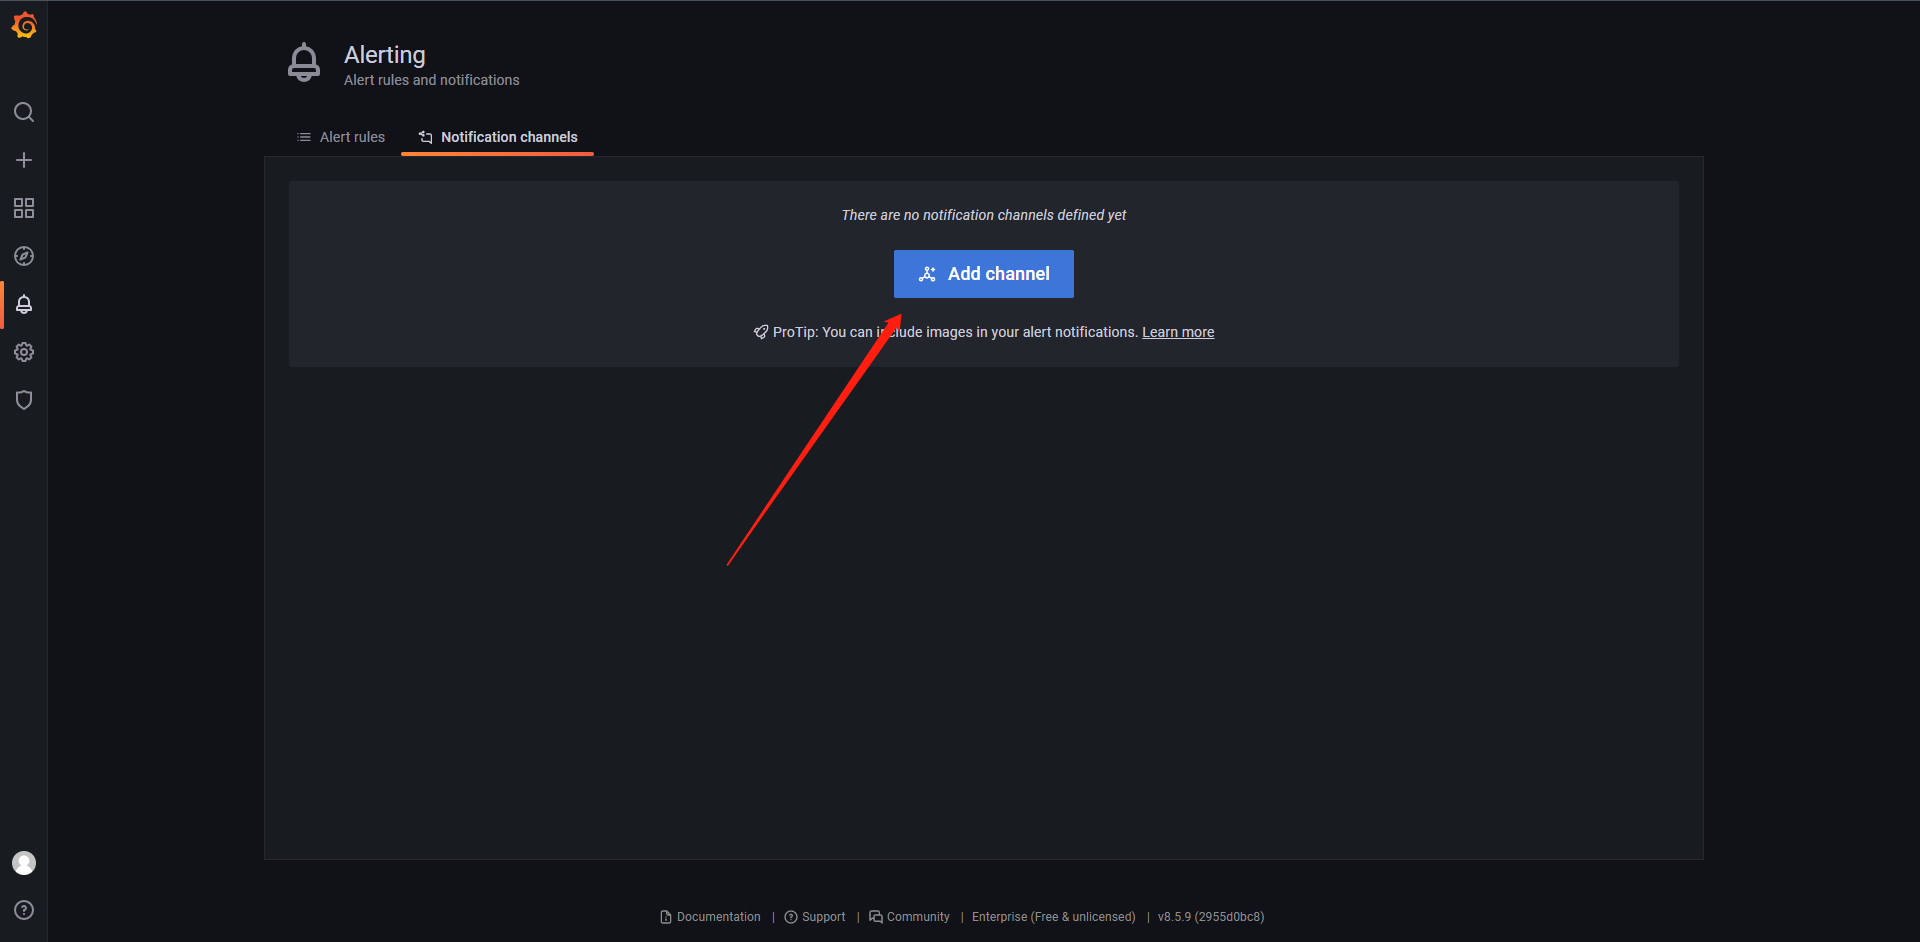
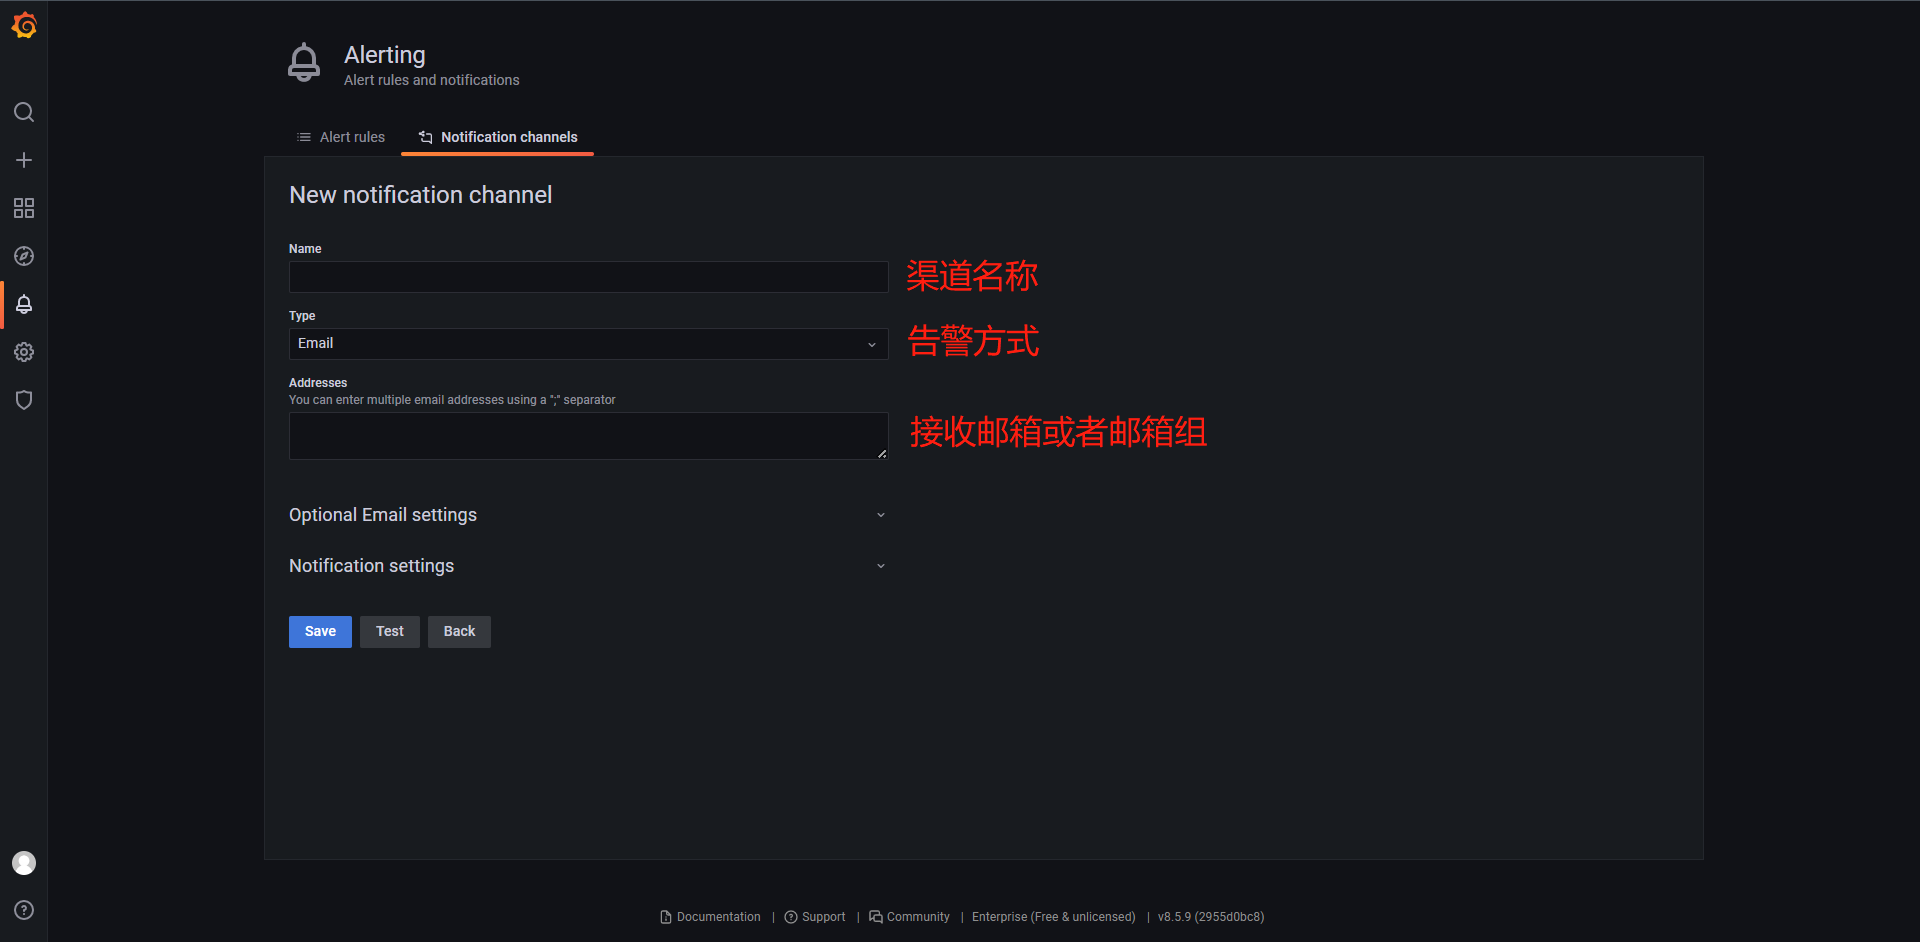
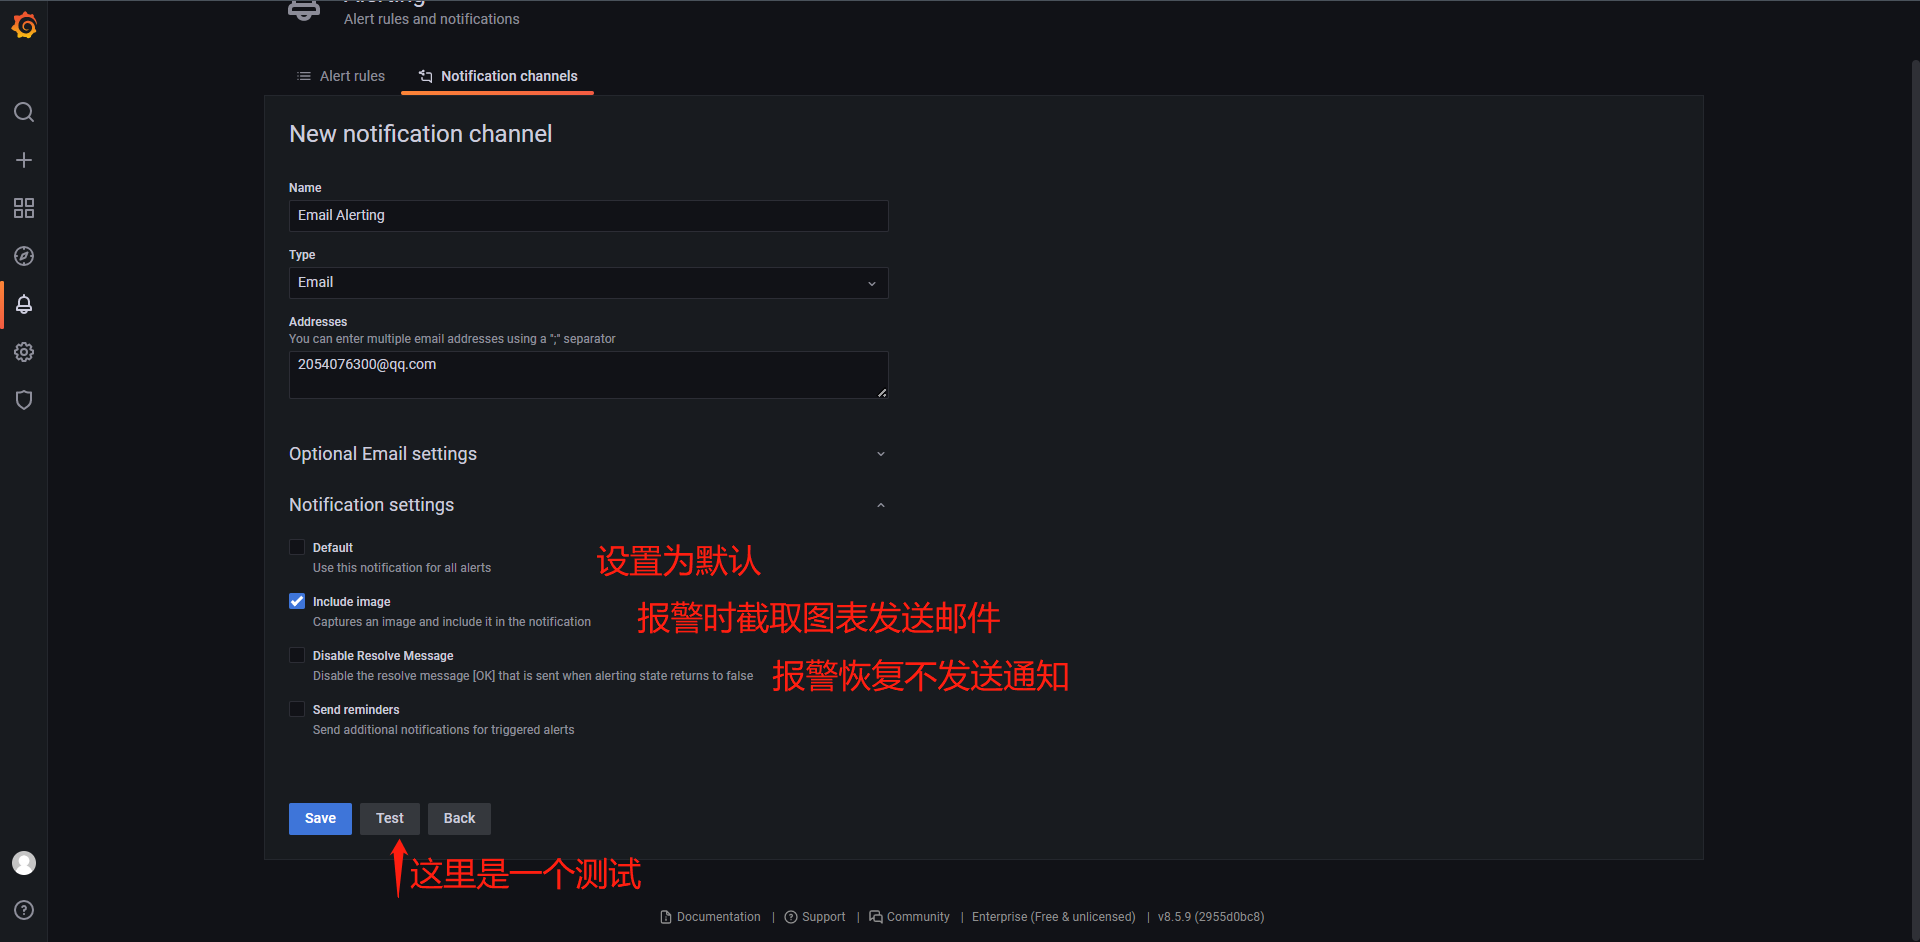
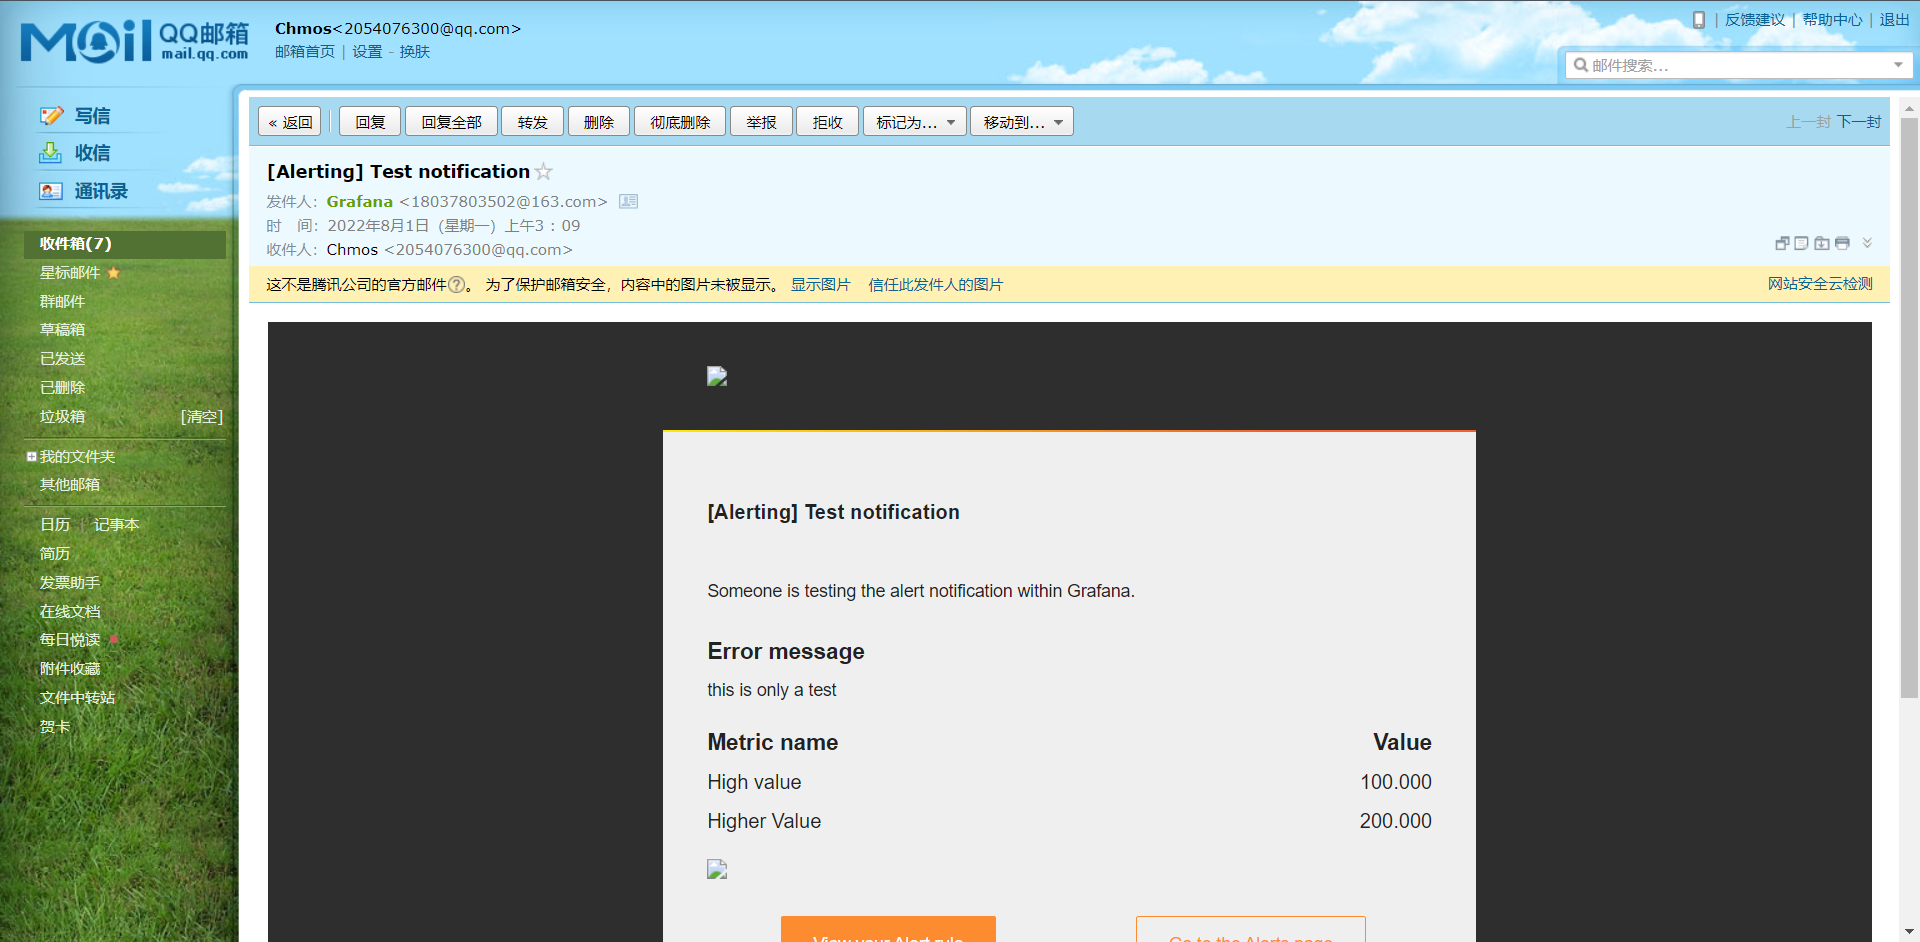
14.9.2:创建报警规则
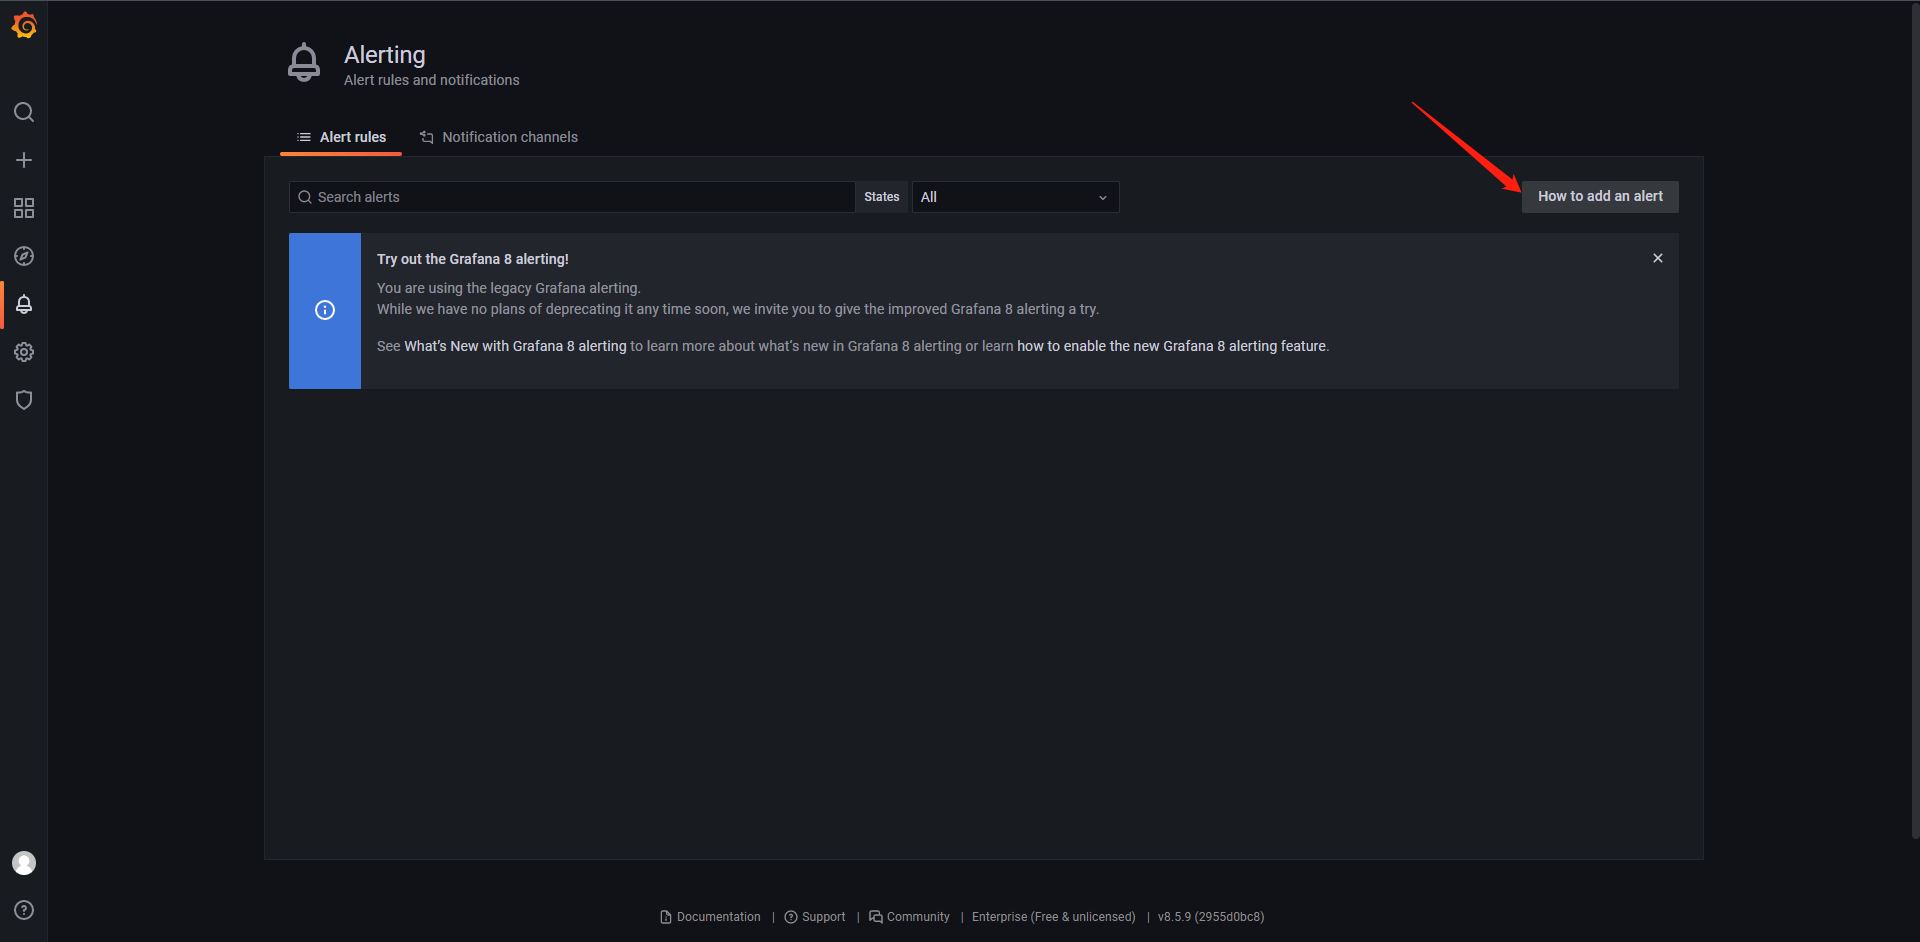
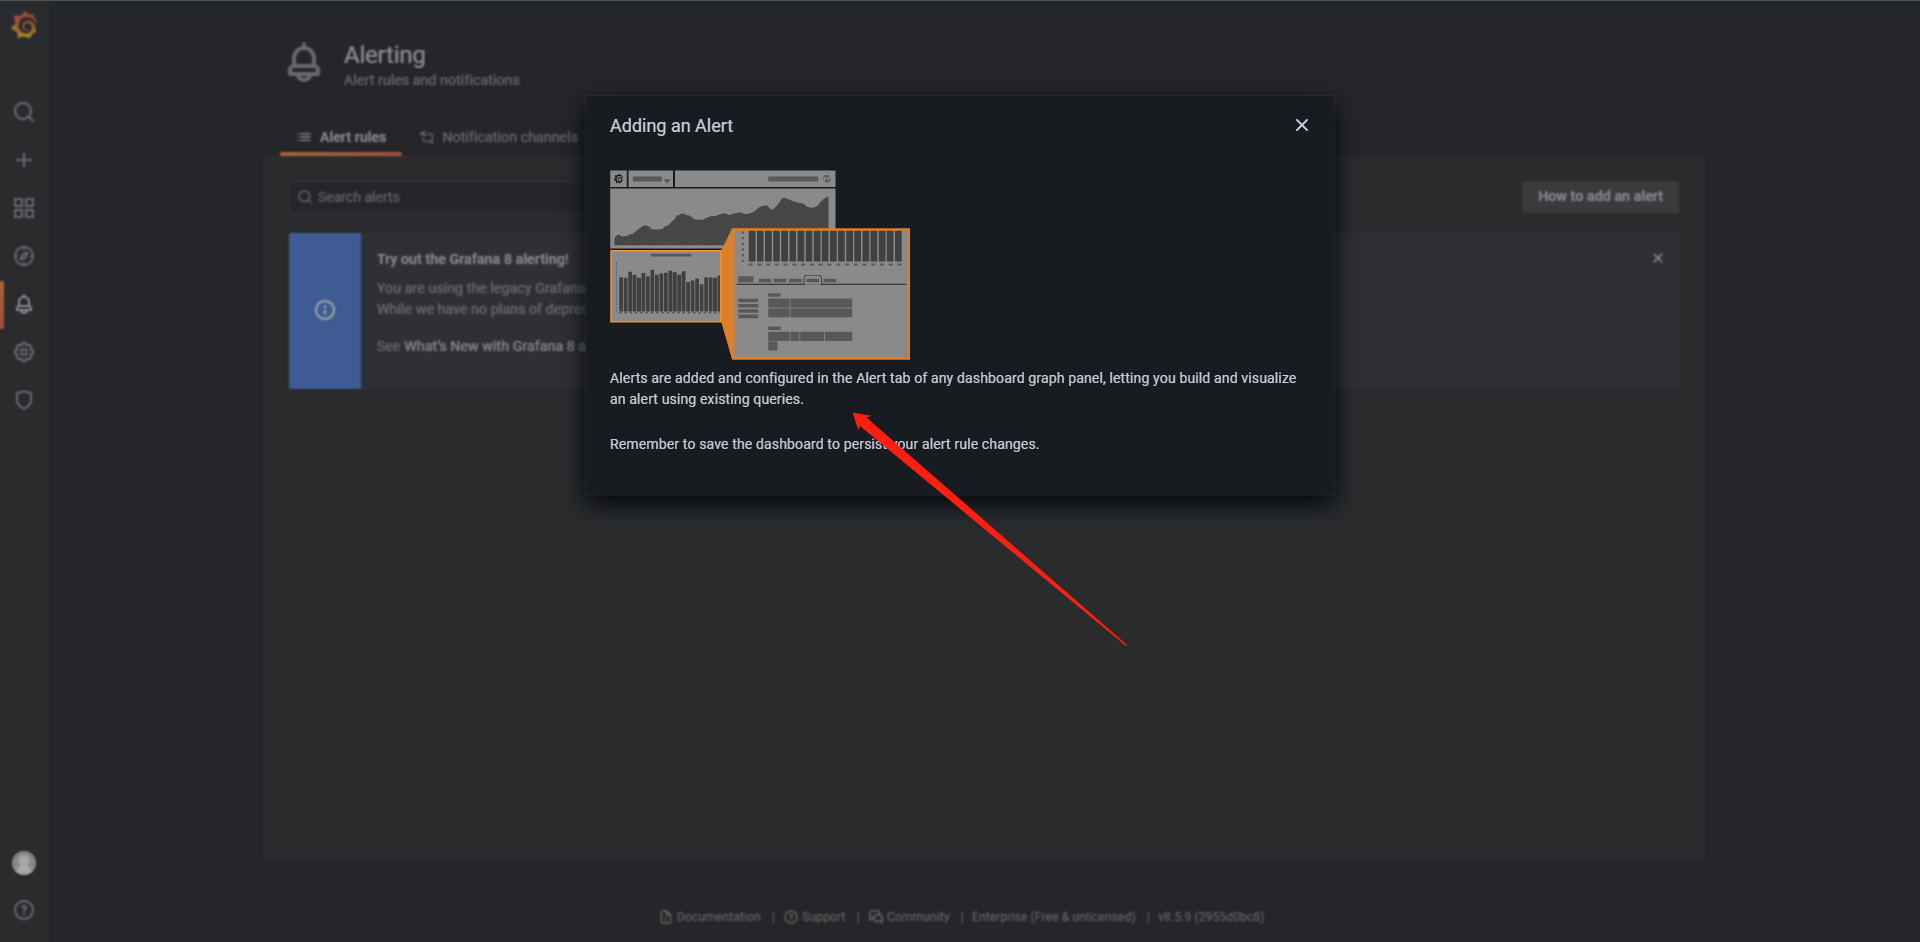
这里它告诉我们可以直接去Dashboard内创建报警
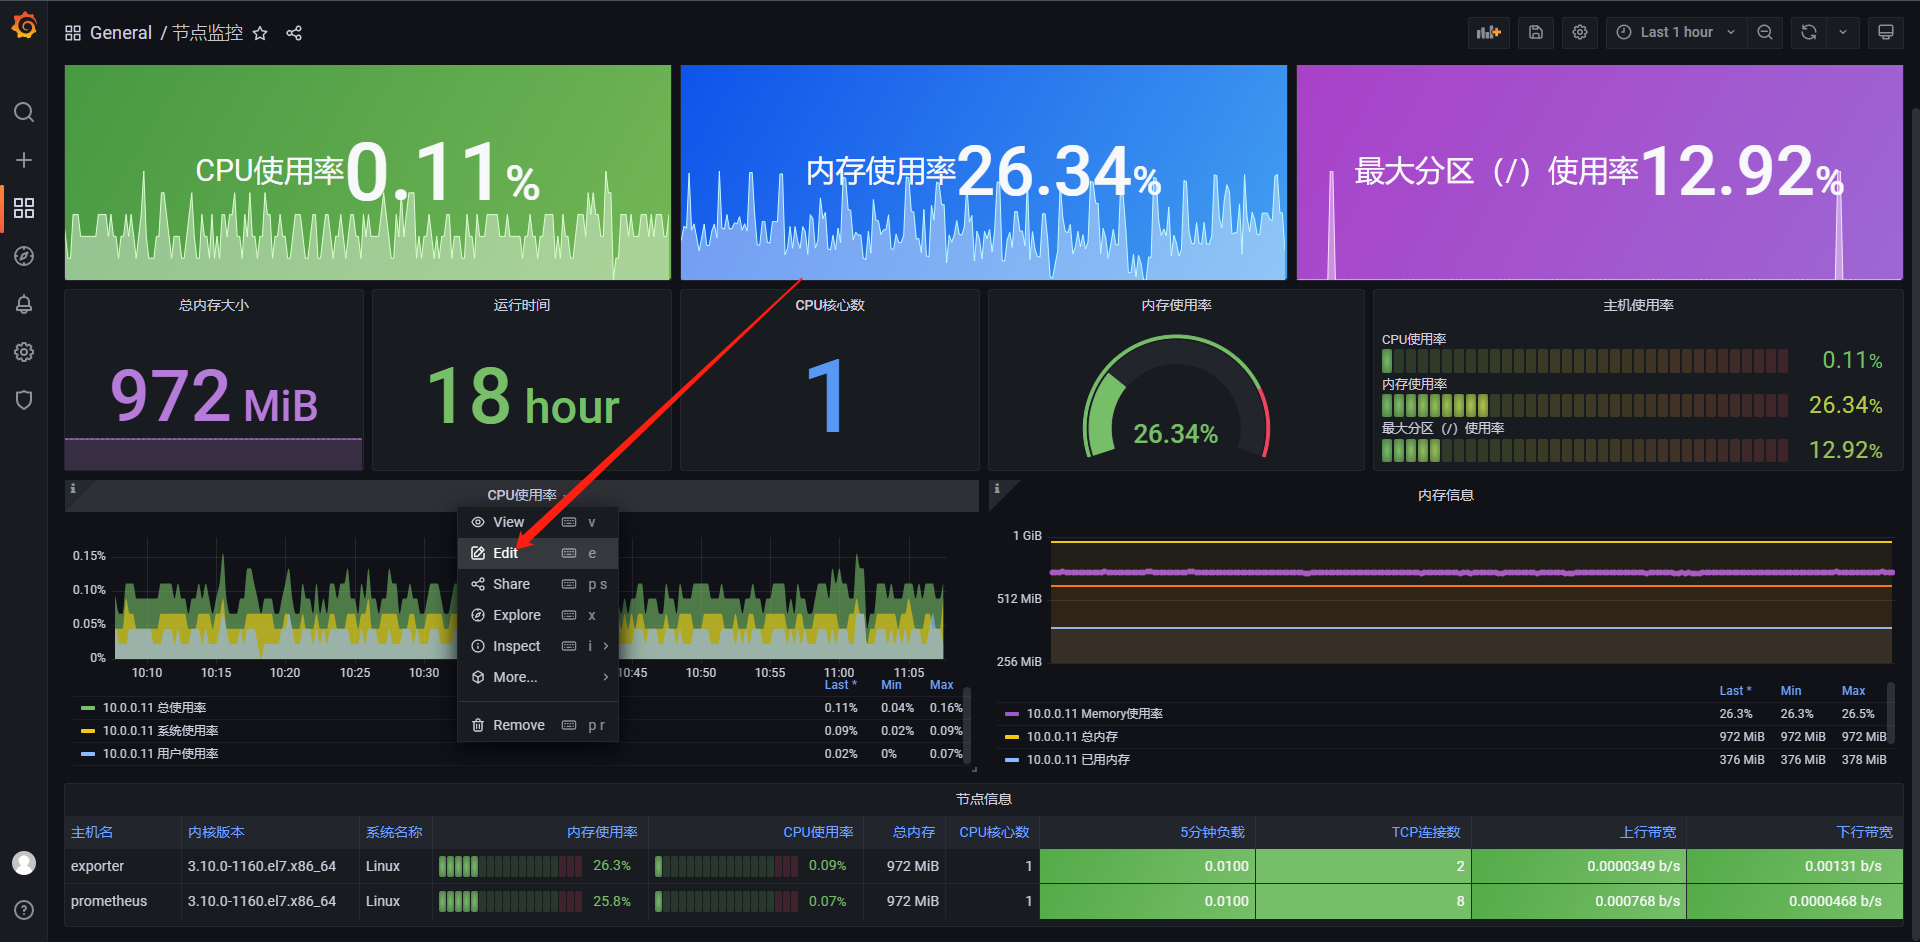
我们拿CPU来测试
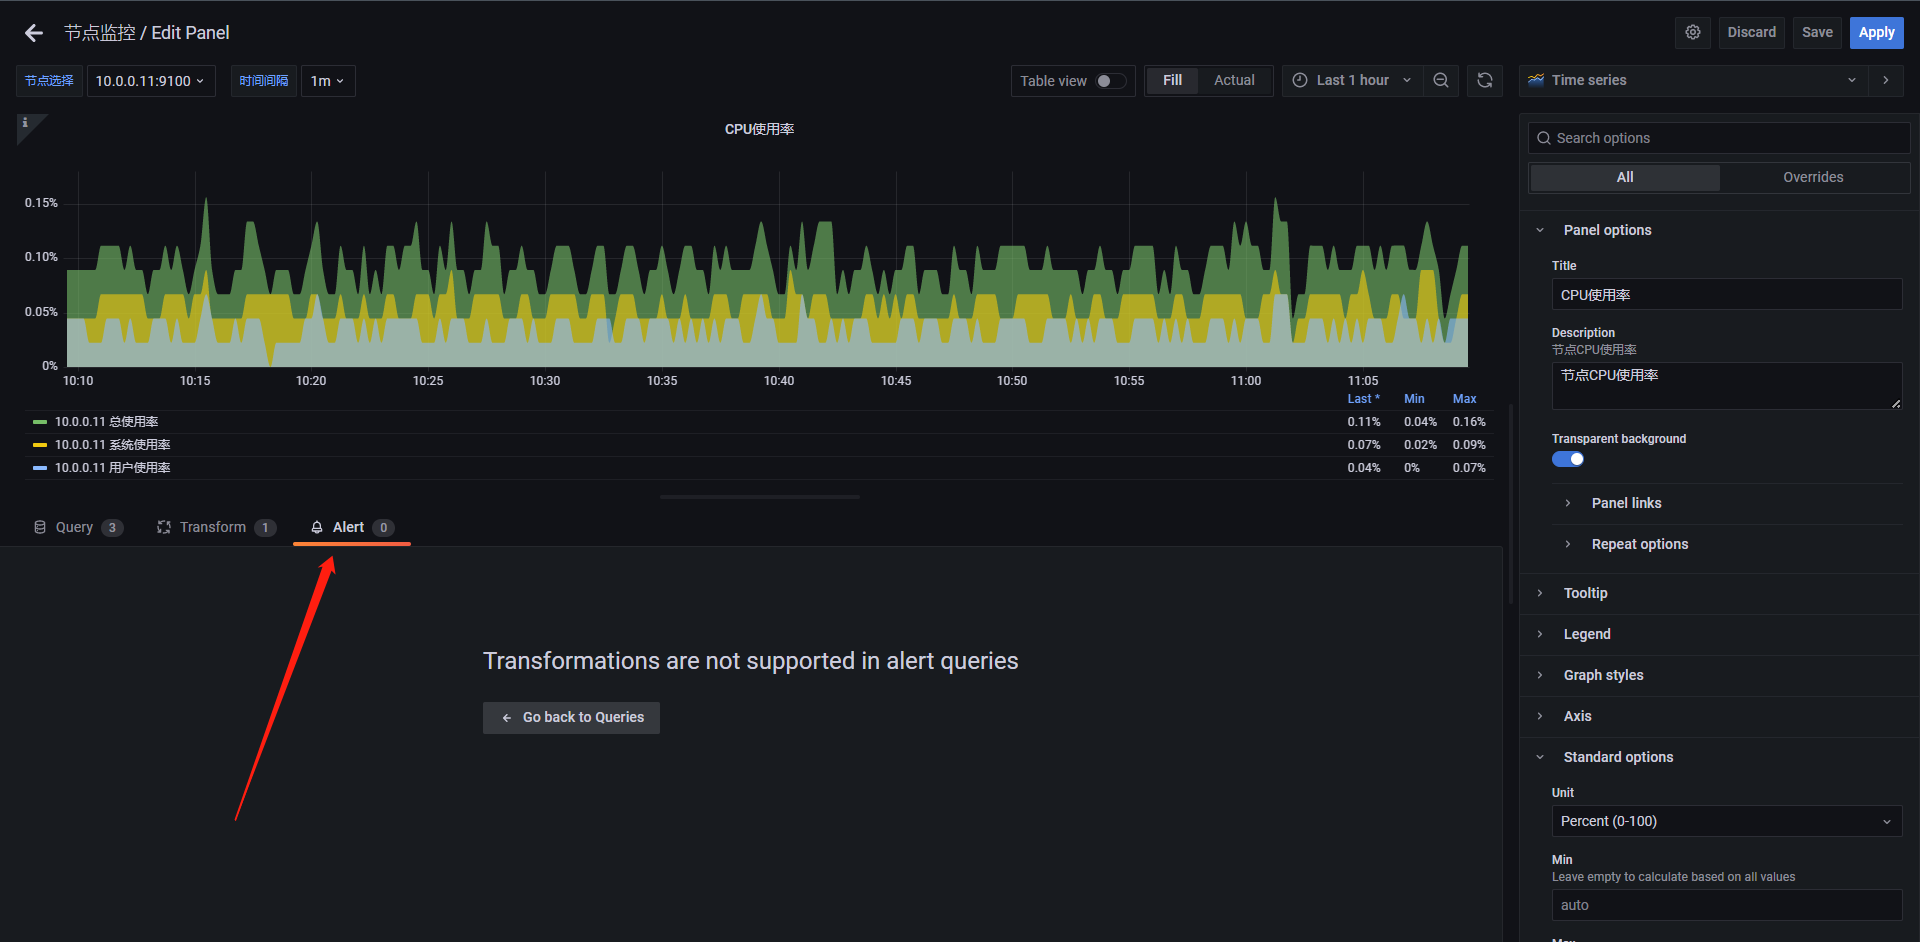
但是这里面我们要注意,它并不能识别我们的查询语句中的变量:host,interval等的信息,那我们怎么办呢,我们可以复制一条语句然后在下面创建一个新的查询(不用于展示)
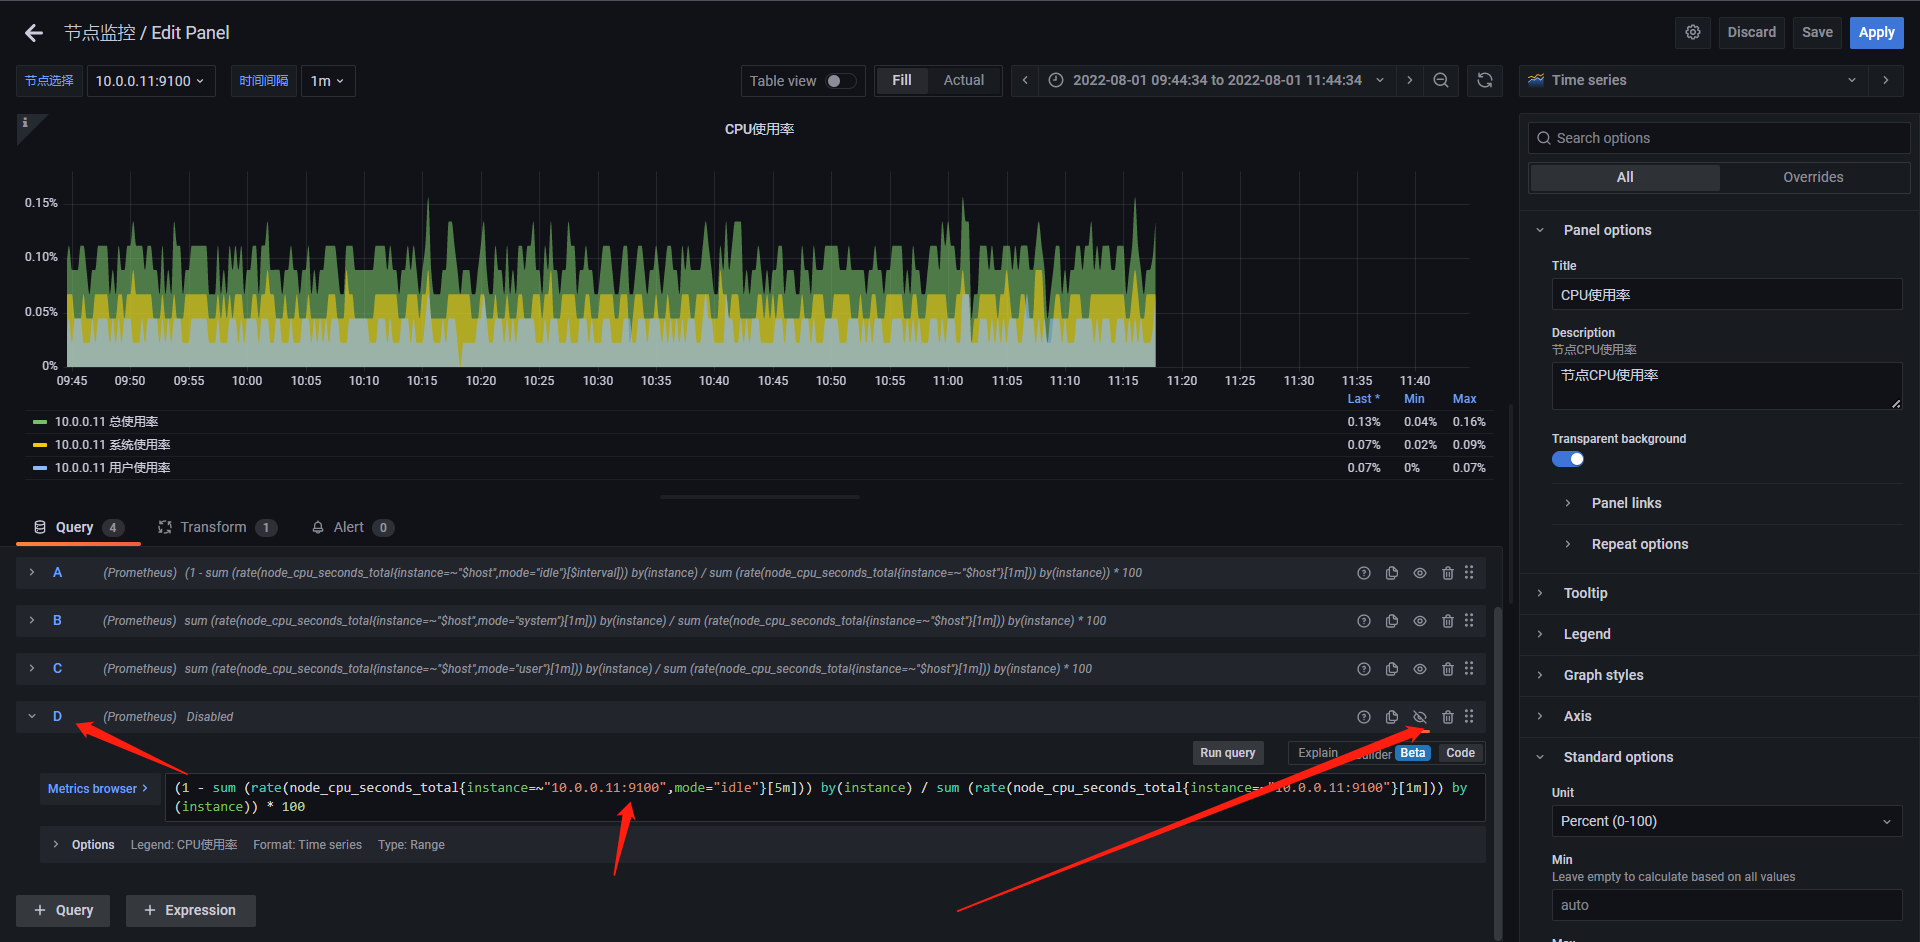
两点需要注意:
1:新建的查询语句不展示在Panel上
2:查询语句必须是固定的参数,不能是变量
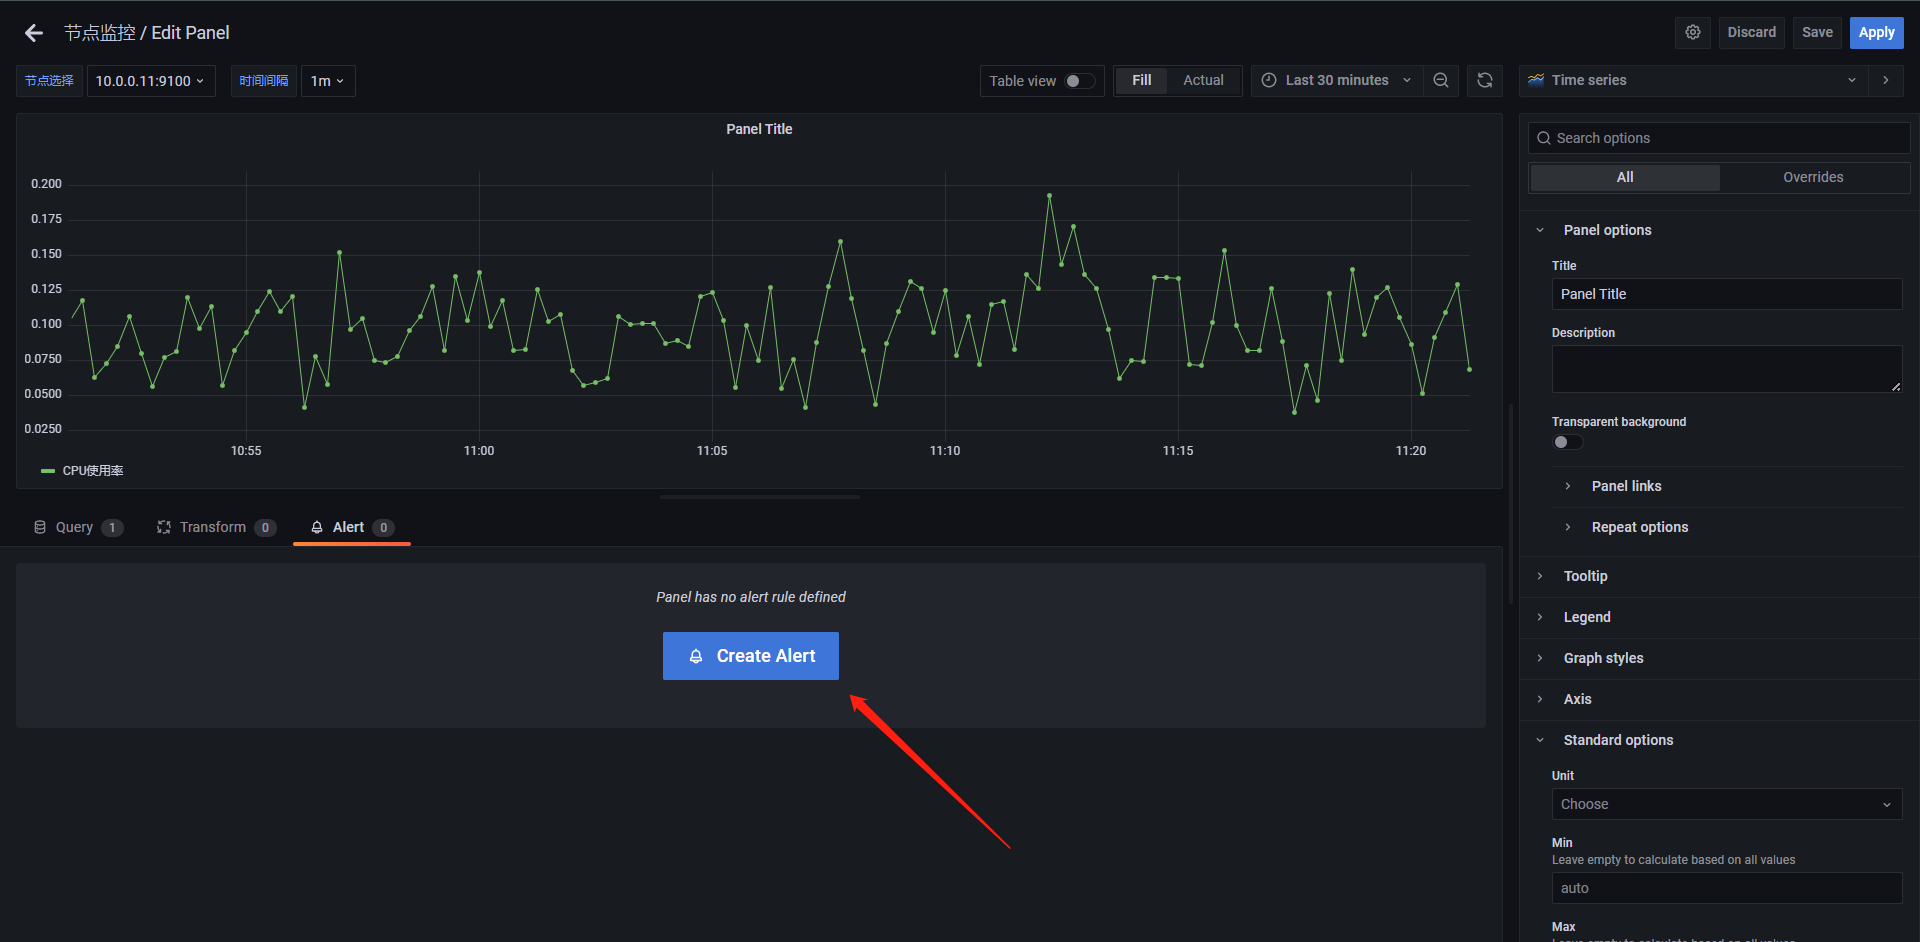
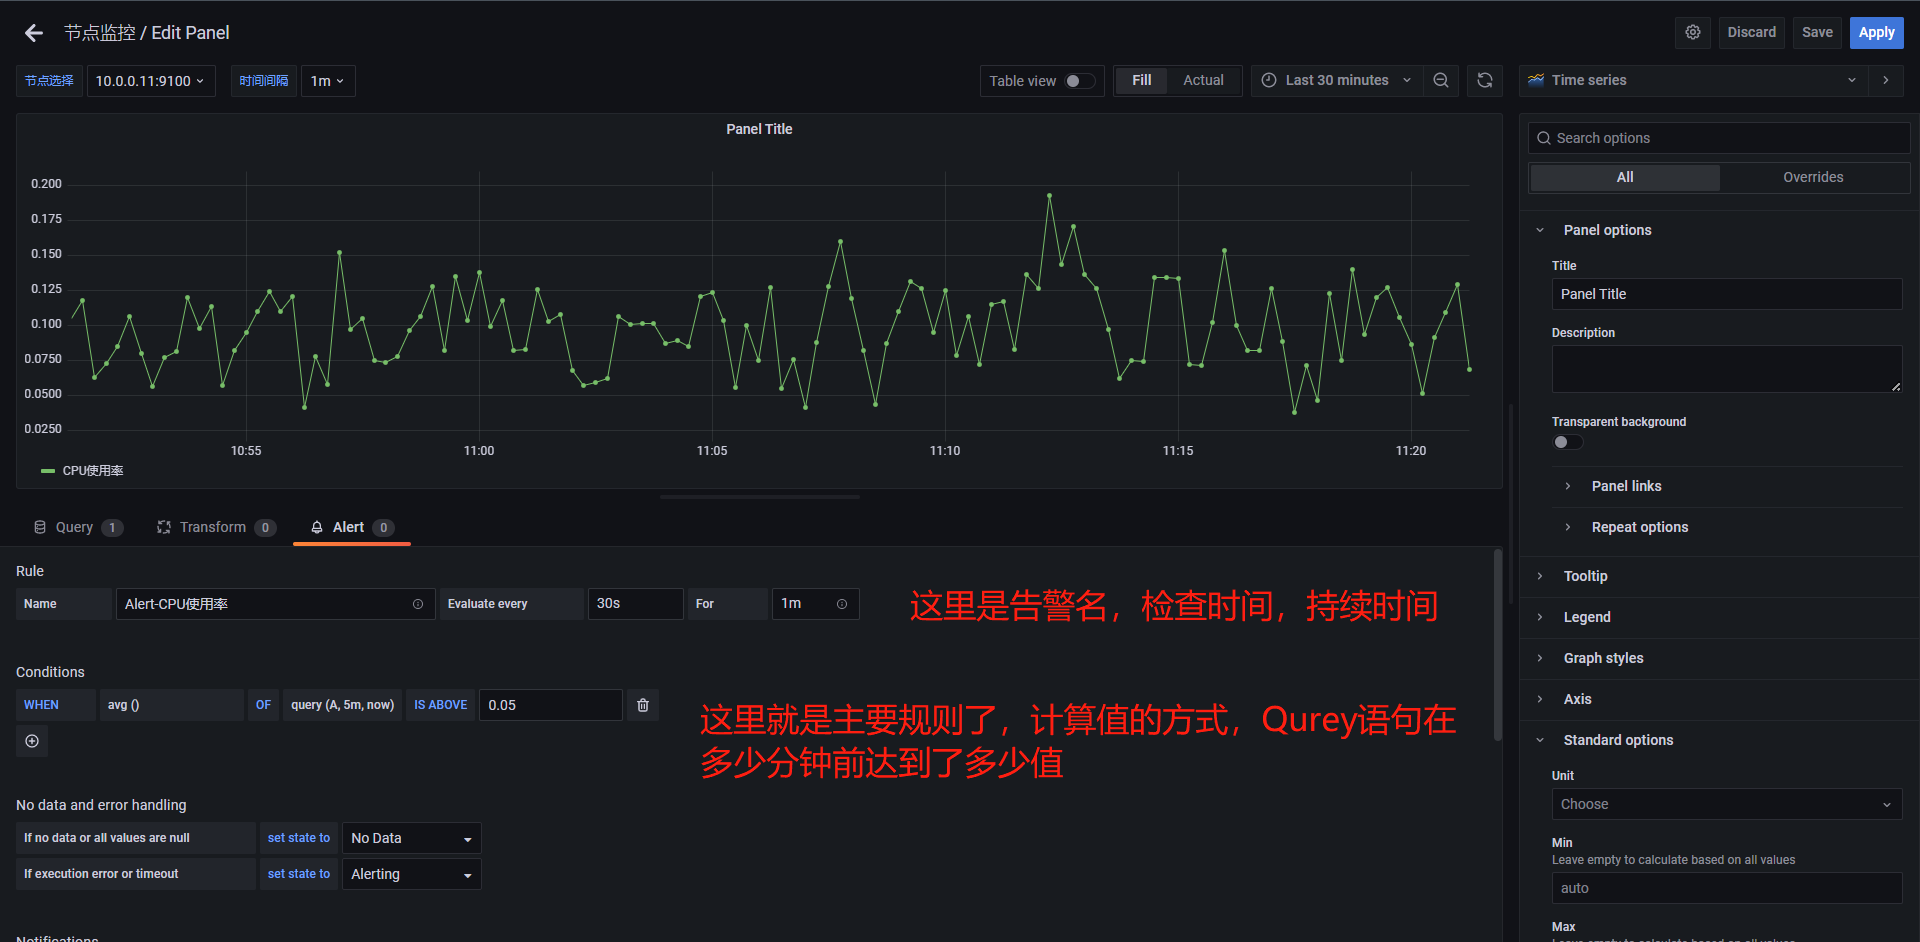
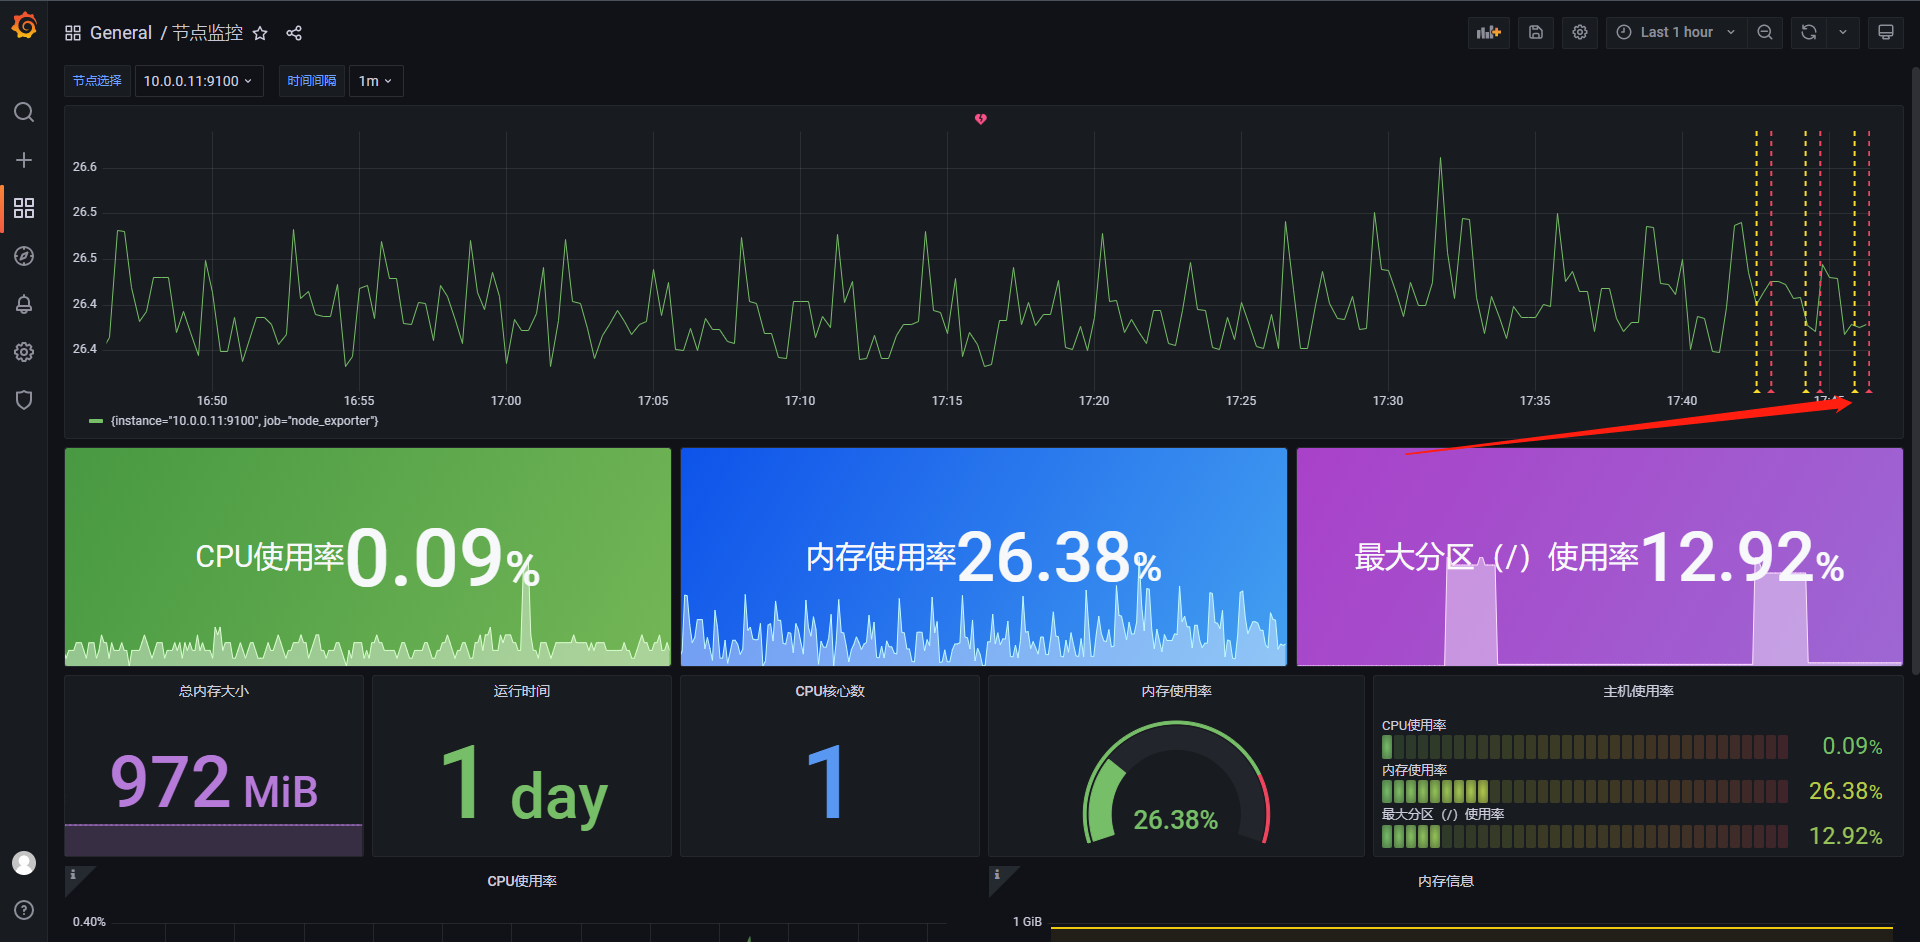
明显可以看到这里已经触发了告警
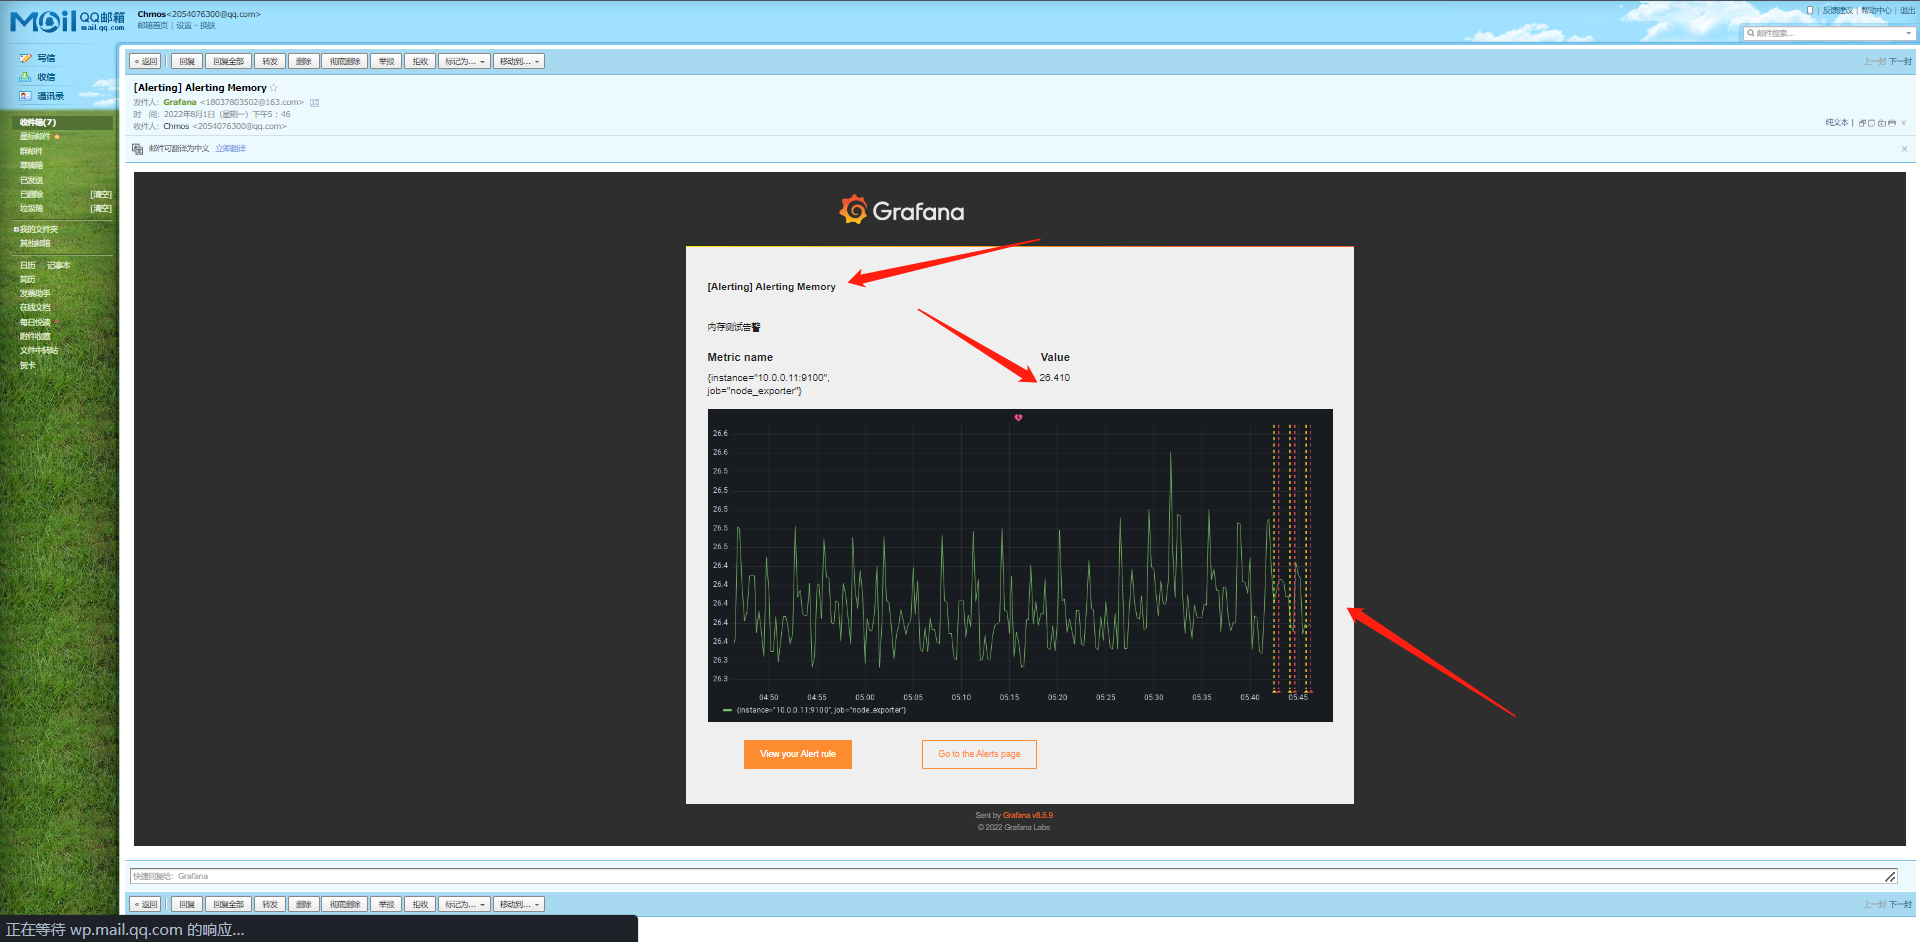
若图片无法渲染请在Grafana主机执行如下操作:
# 安装渲染插件
grafana-cli plugins install grafana-image-renderer

# 安装完成只后还需要安装好puppeteer的依赖包
yum install -y atk at-spi2-atk libxkbcommon-x11-devel libXcomposite gtk3

# 如果Panel中文无法显示这个问题是系统不兼容中文
yum install -y wqy-microhei-fonts.noarch wqy-unibit-fonts.noarch wqy-zenhei-fonts.noarch

最终效果如下
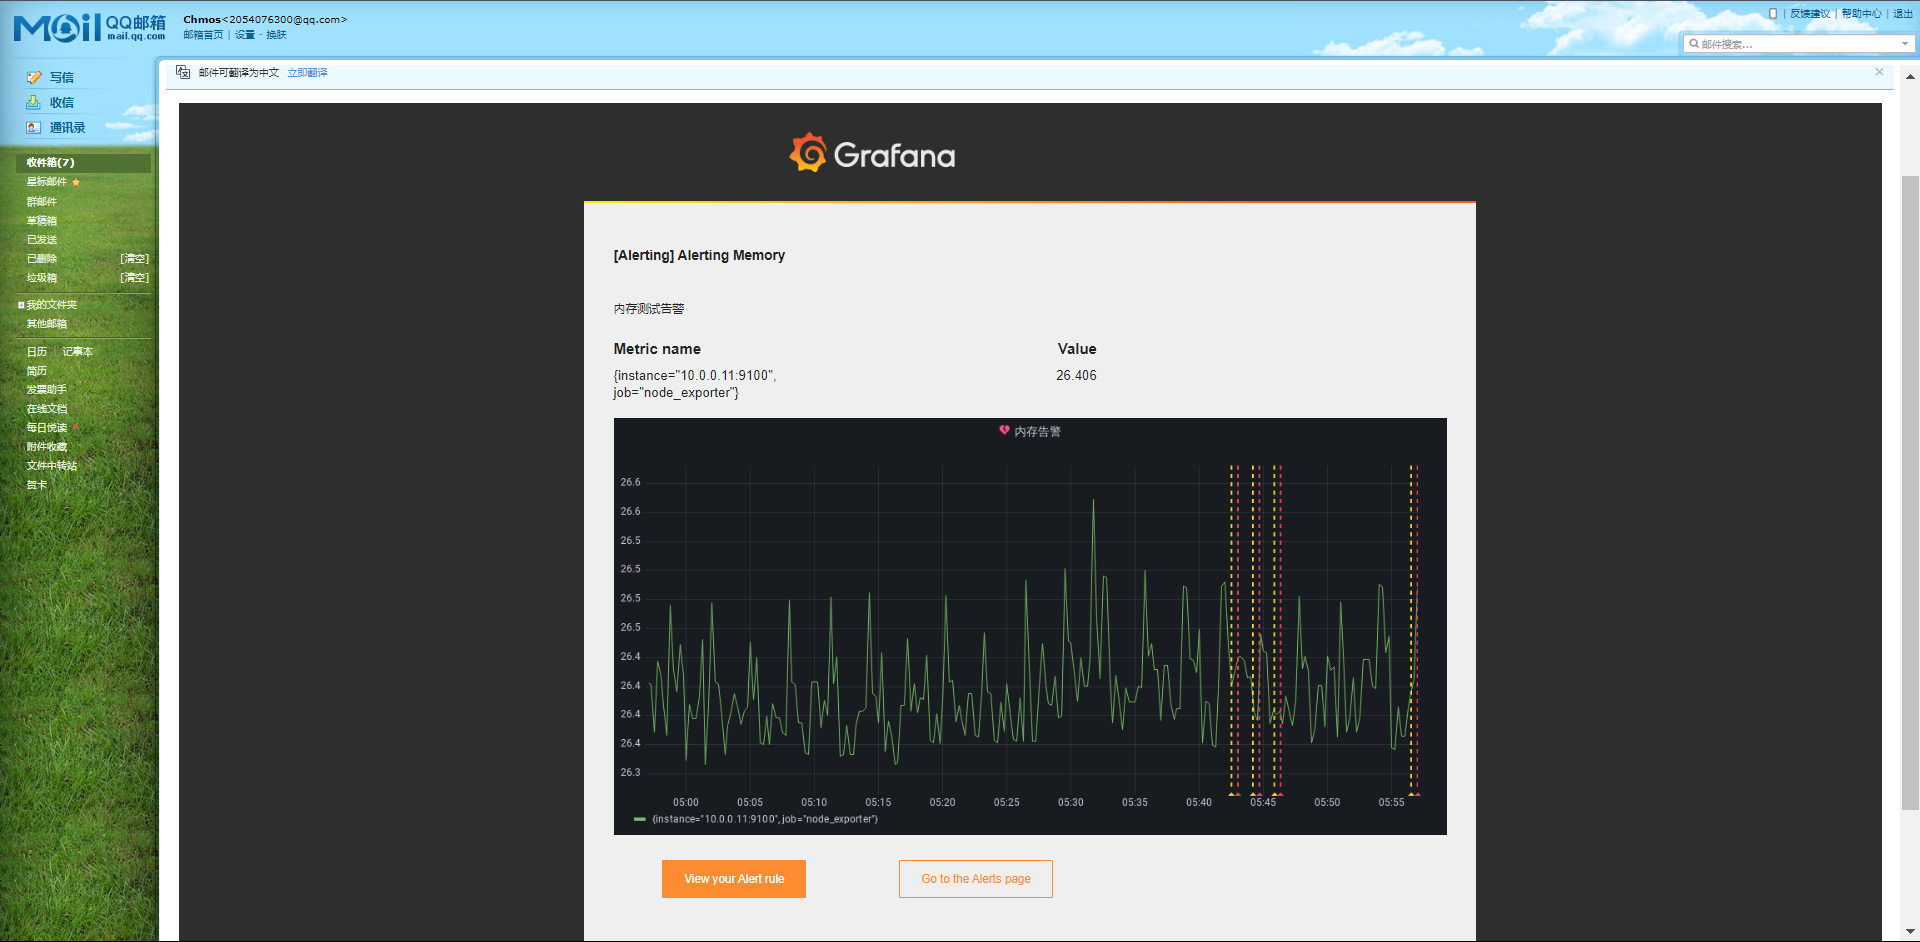
但是如果是接入的钉钉或WebHook这种的话我们需要区配置一个external_storage才能显示,当然了如果这么配置的话那么肯定是需要一个地方来存储这些图片的,那么这个时候我们就要选择Provider了,它支持非常多的Provider
1:s3
2:webdev
3:gcs
4:azure_blob
5:local
配置大概在960行左右

还有在第44行左右需要配置一下domain,如果是内网写内网IP,如果是公网写域名或者IP都可以,具体配置大家可以参考
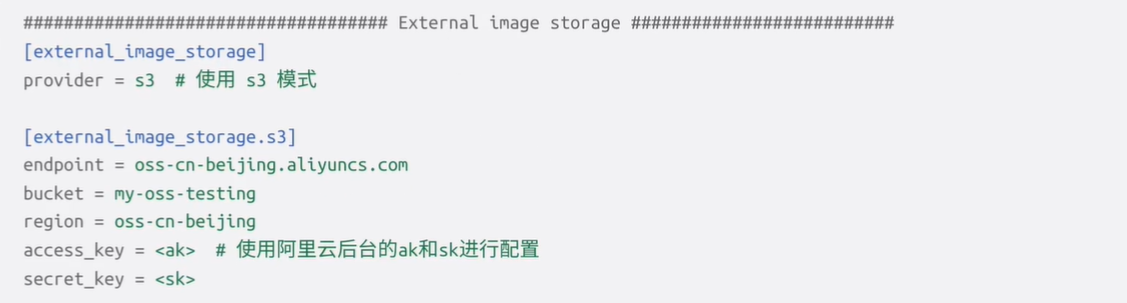
这里面阿里云的oss可以和aws的s3通用的哈
14.9.3:多序列
我们经常在监控报警的查询中会返回多个序列,Grafana的报警中的聚合函数和阈值检测都会去评估每一个序列,但是在Grafana目前不会去跟踪每个序列的报警规则状态,所以这会影响到我们的报警结果,

1:报警返回两个序列 server_1和server_2
2:server_1触发了报警规则并切换到了报警状态
3:发送消息通知出去,比如发送的消息是:负载达到了80%(server_1)
4:如果在同一报警规则的后续评估中,server_2序列也会导致触发了报警
5:这个时候不会发送新的通知,因为报警规则已经处于报警状态之下了

所以从上面的场景可以看出,如果规则处于告警状态了,当其序列也达到了报警条件后,Grafana不会发送消息通知,目前Grafana官方有针对多个序列查询的支持,会在未来的版本中跟踪每一个序列的状态,所以目前也是Grafana功能的一个局限性。

我们可以演示一下如下语句:
(1 - sum (rate(node_cpu_seconds_total{mode="idle"}[5m])) by(instance) / sum (rate(node_cpu_seconds_total[5m])) by(instance)) * 100
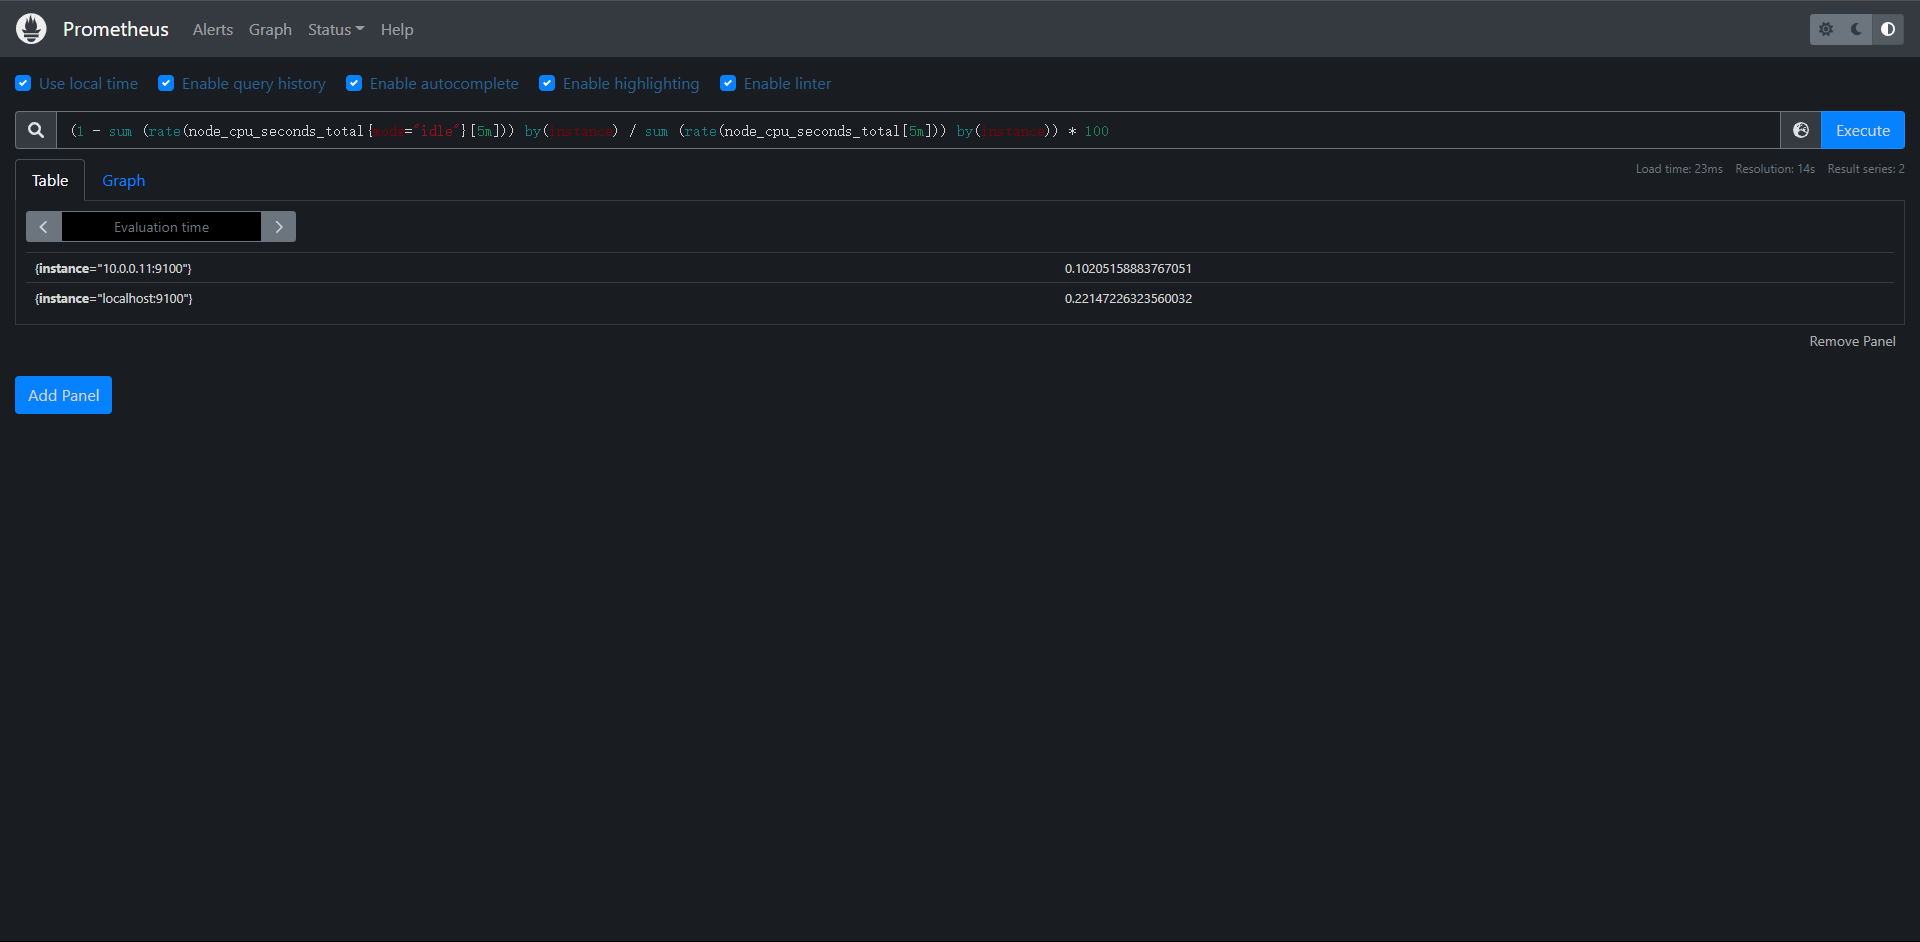
可以看到返回的是两个序列。
14.9.4:告警模板
它其实就是一个可以传进来的变量,我们来触发一下告警来看看
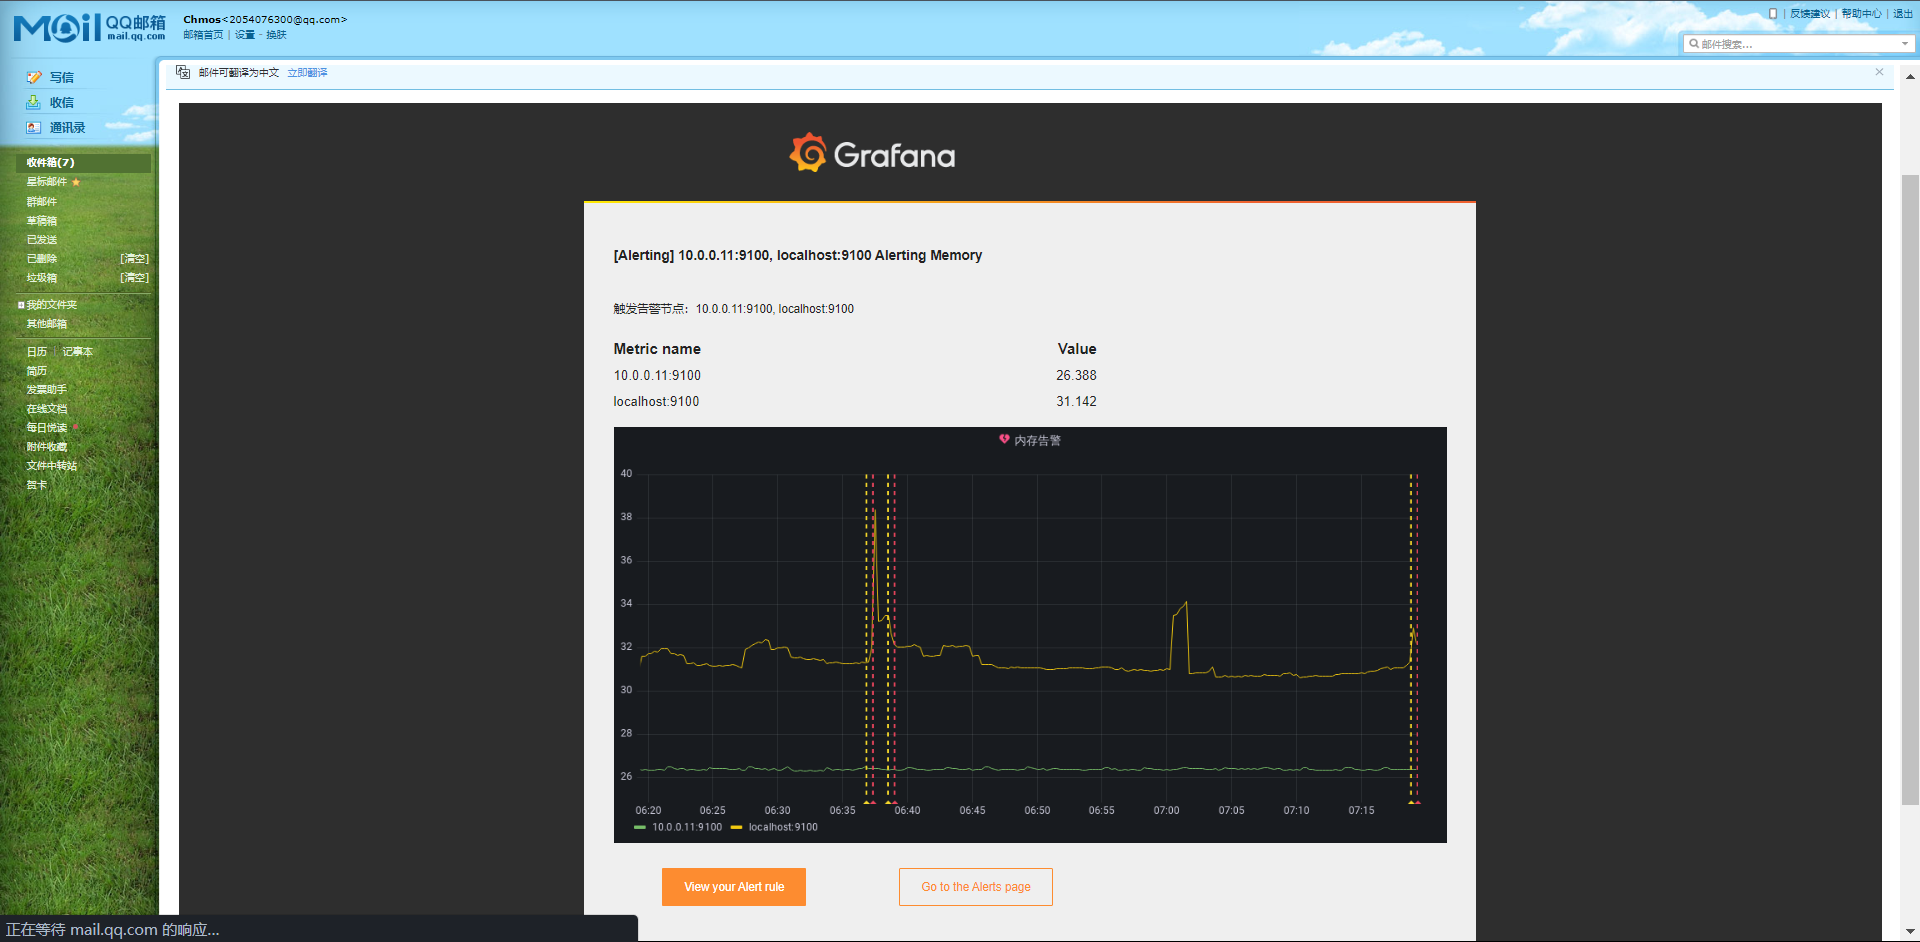
已经触发,并且${instance}已经生效了,但其实我们主要学习的还是Prometheus的AlertManager的告警
15:Kubernetes监控
15.1:在Kubernetes上部署Prometheus
前面我们学习了Prometheus的使用方法,主要是二进制部署Prometheus。但是其实在实际生产中,Prometheus更适合部署在Kubernetes集群内,本次我们将介绍如何手动在Kubernetes集群内部署Prometheus
15.2:安装
这里的Kubernetes集群操作我就不多介绍了,如果想了解的话可以去我的Blog查看,地址如下:
https://www.cnblogs.com/layzer

这里我使用的集群是 1.23.1

[root@kubernetes-master-1 ~]# kubectl get nodes
NAME                  STATUS   ROLES                  AGE   VERSION
kubernetes-master-1   Ready    control-plane,master   45d   v1.23.1
kubernetes-worker-1   Ready    <none>                 45d   v1.23.1

为方便管理,所以我们可以把相关的资源对象全部放在一个namespace下,我们将其命名为 kube-monitor

[root@kubernetes-master-1 ~]# kubectl create ns kube-monitor
namespace/kube-monitor created

[root@kubernetes-master-1 ~]# kubectl get ns
NAME              STATUS   AGE
default           Active   45d
kube-monitor      Active   2m20s    # 我们的监控对象资源将全部存在于这个NS下
kube-node-lease   Active   45d
kube-public       Active   45d
kube-system       Active   45d

那么接下来我们就来创建Prometheus的一些相关的资源

1:Configmap:主要存储的是Prometheus的配置文件

[root@kubernetes-master-1 prometheus]# cat config.yaml
kind: ConfigMap
apiVersion: v1
metadata:
  name: prometheus-config
  namespace: kube-monitor
data:
  prometheus.yml: |
    global:
      scrape_interval: 15s
      scrape_timeout: 15s

    scrape_configs:
    - job_name: 'prometheus'
      static_configs:
      - targets: ['localhost:9090']

# 这里先只做一个基本的配置,先让它监控本身。创建资源
[root@kubernetes-master-1 prometheus]# kubectl apply -f config.yaml
configmap/prometheus-config created

[root@kubernetes-master-1 prometheus]# kubectl get cm -n kube-monitor
NAME                DATA   AGE
kube-root-ca.crt    1      10m
prometheus-config   1      87s

后面如果我们有新的资源需要监控的时候我们完全可以直接更改ConfigMap的配置就可以了

2:Deployment:创建Prometheus的Pod资源

[root@kubernetes-master-1 prometheus]# cat prometheus-deploy.yaml
kind: Deployment
apiVersion: apps/v1
metadata:
  name: prometheus
  namespace: kube-monitor
  labels:
    app: prometheus
spec:
  selector:
    matchLabels:
      app: prometheus
  template:
    metadata:
      labels:
        app: prometheus
    spec:
      serviceAccountName: prometheus
      containers:
      - name: prometheus
        image: prom/prometheus:latest
        args:
          - "--config.file=/etc/prometheus/prometheus.yml"
          - "--storage.tsdb.path=/prometheus"      # 指定TSDB数据路径
          - "--storage.tsdb.retention.time=24h"
          - "--web.enable-admin-api"               # 控制对admin HTTP API的访问 包括删除时间序列等功能
          - "--web.enable-lifecycle"               # 开启热加载更新 也就是 lcoalhost:9090/-/reload
        ports:
          - name: http
            containerPort: 9090
        volumeMounts:
          - mountPath: "/etc/prometheus"
            name: config-volume
          - mountPath: "/prometheus"
            name: data
        resources:
          requests:
            cpu: 200m
            memory: 1024Mi
          limits:
            cpu: 200m
            memory: 1024Mi
      volumes:
        - name: data
          persistentVolumeClaim:
            claimName: prometheus-data
        - configMap:
            name: prometheus-config
          name: config-volume

另外有一个非常重要的点就是Prometheus的持久化一定不能用NFS,这里测试我们还是选择使用LocalPV来进行持久化,接下来我们来看一下

[root@kubernetes-master-1 prometheus]# cat localpv.yaml
kind: StorageClass
apiVersion: storage.k8s.io/v1
metadata:
  name: local-storage
provisioner: kubernetes.io/no-provisioner
volumeBindingMode: WaitForFirstConsumer
---
kind: PersistentVolume
apiVersion: v1
metadata:
  name: prometheus-local
  labels:
    app: prometheus
spec:
  accessModes:
    - ReadWriteOnce
  capacity:
    storage: 10Gi
  storageClassName: local-storage
  local:
    path: /data/
  persistentVolumeReclaimPolicy: Retain
  nodeAffinity:
    required:
      nodeSelectorTerms:
        - matchExpressions:
            - key: kubernetes.io/hostname
              operator: In
              values:
                - kubernetes-worker-1
---
kind: PersistentVolumeClaim
apiVersion: v1
metadata:
  name: prometheus-data
  namespace: kube-monitor
spec:
  selector:
    matchLabels:
      app: prometheus
  accessModes:
    - ReadWriteOnce
  resources:
    requests:
      storage: 10Gi
  storageClassName: local-storage


由于Prometheus需要访问Kubernetes的一些资源,所以需要配置RBAC的一些相关的认证

[root@kubernetes-master-1 prometheus]# cat rbac.yaml
kind: ServiceAccount
apiVersion: v1
metadata:
  name: prometheus
  namespace: kube-monitor
---
kind: ClusterRole
apiVersion: rbac.authorization.k8s.io/v1
metadata:
  name: prometheus
rules:
  - apiGroups:
      - ""
    resources:
      - nodes
      - services
      - endpoints
      - pods
      - nodes/proxy
    verbs:
      - get
      - list
      - watch
  - apiGroups:
      - "extensions"
    resources:
      - ingresses
    verbs:
      - get
      - list
      - watch
  - apiGroups:
      - ""
    resources:
      - configmaps
      - nodes/metrics
    verbs:
      - get
  - nonResourceURLs:
      - /metrics
    verbs:
      - get
---
kind: ClusterRoleBinding
apiVersion: rbac.authorization.k8s.io/v1
metadata:
  name: prometheus
roleRef:
  apiGroup: rbac.authorization.k8s.io
  kind: ClusterRole
  name: prometheus
subjects:
  - kind: ServiceAccount
    name: prometheus
    namespace: kube-monitor

[root@kubernetes-master-1 prometheus]# kubectl get sa -n kube-monitor
NAME         SECRETS   AGE
default      1         68m
prometheus   1         2m5s

[root@kubernetes-master-1 prometheus]# kubectl get pvc -n kube-monitor
NAME              STATUS    VOLUME   CAPACITY   ACCESS MODES   STORAGECLASS    AGE
prometheus-data   Pending                                      local-storage   14m

接下来就是部署Prometheus的资源了

[root@kubernetes-master-1 prometheus]# kubectl apply -f prometheus-deploy.yaml
deployment.apps/prometheus created

会出现如下报错:

[root@kubernetes-master-1 prometheus]# kubectl get pod -n kube-monitor prometheus-c6dcf8fdc-zgtsr
NAME                         READY   STATUS   RESTARTS   AGE
prometheus-c6dcf8fdc-zgtsr   0/1     Error    0          18s


Events:
  Type     Reason     Age               From               Message
  ----     ------     ----              ----               -------
  Normal   Scheduled  21s               default-scheduler  Successfully assigned kube-monitor/prometheus-c6dcf8fdc-x9cgv to kubernetes-worker-1
  Normal   Pulled     11s               kubelet            Successfully pulled image "prom/prometheus:latest" in 3.448513616s
  Normal   Pulling    8s (x2 over 15s)  kubelet            Pulling image "prom/prometheus:latest"
  Normal   Pulled     5s                kubelet            Successfully pulled image "prom/prometheus:latest" in 3.479895129s
  Normal   Created    4s (x2 over 11s)  kubelet            Created container prometheus
  Normal   Started    3s (x2 over 10s)  kubelet            Started container prometheus
  Warning  BackOff    0s (x2 over 1s)   kubelet            Back-off restarting failed container
[root@kubernetes-master-1 prometheus]# kubectl logs -f -n kube-monitor prometheus-c6dcf8fdc-x9cgv
ts=2022-08-01T18:43:16.672Z caller=main.go:535 level=info msg="Starting Prometheus Server" mode=server version="(version=2.37.0, branch=HEAD, revision=b41e0750abf5cc18d8233161560731de05199330)"
ts=2022-08-01T18:43:16.672Z caller=main.go:540 level=info build_context="(go=go1.18.4, user=root@0ebb6827e27f, date=20220714-15:13:18)"
ts=2022-08-01T18:43:16.672Z caller=main.go:541 level=info host_details="(Linux 3.10.0-1160.el7.x86_64 #1 SMP Mon Oct 19 16:18:59 UTC 2020 x86_64 prometheus-c6dcf8fdc-x9cgv (none))"
ts=2022-08-01T18:43:16.672Z caller=main.go:542 level=info fd_limits="(soft=1048576, hard=1048576)"
ts=2022-08-01T18:43:16.672Z caller=main.go:543 level=info vm_limits="(soft=unlimited, hard=unlimited)"
ts=2022-08-01T18:43:16.672Z caller=query_logger.go:90 level=error component=activeQueryTracker msg="Error opening query log file" file=/prometheus/queries.active err="open /prometheus/queries.active: permission denied"
panic: Unable to create mmap-ed active query log


这是因为我们的持久化的用户为ROOT导致权限不足,我们来解决这个问题
1:设置securityContext来为Pod设置下volumes的权限,通过设置runAsuser=0指定用户为root
2:使用一个初始化容器来修改数据目录的权限

[root@kubernetes-master-1 prometheus]# cat prometheus-deploy.yaml
kind: Deployment
apiVersion: apps/v1
metadata:
  name: prometheus
  namespace: kube-monitor
  labels:
    app: prometheus
spec:
  selector:
    matchLabels:
      app: prometheus
  template:
    metadata:
      labels:
        app: prometheus
    spec:
      serviceAccountName: prometheus
      initContainers:
      - name: fix-prometheus
        image: busybox
        command: [chown, -R, "nobody:nobody", /prometheus]
        volumeMounts:
          - name: data
            mountPath: /prometheus
      containers:
      - name: prometheus
        image: prom/prometheus:latest
        args:
          - "--config.file=/etc/prometheus/prometheus.yml"
          - "--storage.tsdb.path=/prometheus"
          - "--storage.tsdb.retention.time=24h"
          - "--web.enable-admin-api"
          - "--web.enable-lifecycle"
        ports:
          - name: http
            containerPort: 9090
        volumeMounts:
          - mountPath: "/etc/prometheus"
            name: config-volume
          - mountPath: "/prometheus"
            name: data
        resources:
          requests:
            cpu: 200m
            memory: 1024Mi
          limits:
            cpu: 200m
            memory: 1024Mi
      volumes:
        - name: data
          persistentVolumeClaim:
            claimName: prometheus-data
        - configMap:
            name: prometheus-config
          name: config-volume

[root@kubernetes-master-1 prometheus]# kubectl apply -f prometheus-deploy.yaml
deployment.apps/prometheus created

# 查看容器
[root@kubernetes-master-1 prometheus]# kubectl get pod -n kube-monitor
NAME                         READY   STATUS    RESTARTS   AGE
prometheus-f78c85b87-ptn5l   1/1     Running   0          40s

# 接下来就是创建一个service来提供访问我们的Prometheus

[root@kubernetes-master-1 prometheus]# cat service.yaml
kind: Service
apiVersion: v1
metadata:
  name: prometheus
  namespace: kube-monitor
  labels:
    app: prometheus
spec:
  selector:
    app: prometheus
  type: NodePort
  ports:
   - name: web
     port: 9090
     targetPort: http

[root@kubernetes-master-1 prometheus]# kubectl apply -f service.yaml
service/prometheus created

[root@kubernetes-master-1 prometheus]# kubectl get svc -n kube-monitor
NAME         TYPE       CLUSTER-IP       EXTERNAL-IP   PORT(S)          AGE
prometheus   NodePort   200.102.66.207   <none>        9090:31656/TCP   5s

通过访问任意节点的ip+31656 即可访问Prometheus了
[root@kubernetes-worker-1 data]# ls
01G9EDYG7CTF4W1M4KZ1NBQPE7  01G9EDYG7VT7EBZB633JD4W9RC  chunks_head  lock  queries.active  wal
[root@kubernetes-worker-1 data]# pwd
/data
15.3:普通应用监控
前面其实我们已经介绍到了Prometheus如何通过一个公开的指标接口HTTP(S)获取监控数据,我们不需要单独安装agent只需要暴露一个metrics接口,Prometheus会定时的去拉取数据,对于一些普通的应用,我们完全可以直接重用这个服务,添加一个/metrics接口暴露给Prometheus:获取指标数据格式是非常易懂的,不需要太高的学习成本

现在很多服务从一开始就内置了/metrics的接口,比如:Kubernetes的组件,Istio服务网格都直接提供了数据指标接口,但是有些服务没有原生集成该接口,我们也完全可以使用exporter来获取指标数据,比如:mysqld_exporter,node_exporter这些exporter就类似于传统的监控服务中的Agent的存在,用于收集目标服务的指标数据然后直接暴露给Prometheus。
15.3.1:普通应用
对于普通应用只需要能够提供一个满足Prometheus格式要求的/metrics接口就可以让Prometheus来接管监控,比如Kubernetes集群内的CoreDNS组件,一般情况下都是默认开启了/metrics接口的。

[root@kubernetes-master-1 ~]# kubectl get cm -n kube-system coredns -oyaml
apiVersion: v1
data:
  Corefile: |
    .:53 {
        errors
        health {
           lameduck 5s
        }
        ready
        kubernetes cluster.local in-addr.arpa ip6.arpa {
           pods insecure
           fallthrough in-addr.arpa ip6.arpa
           ttl 30
        }
        prometheus :9153             # 这里及表示它开启了Prometheus的监控接口
        forward . /etc/resolv.conf {
           max_concurrent 1000
        }
        cache 30
        loop
        reload
        loadbalance
    }
kind: ConfigMap
metadata:
  creationTimestamp: "2022-06-16T18:19:44Z"
  name: coredns
  namespace: kube-system
  resourceVersion: "241"
  uid: c53bc79a-7871-48d3-b969-f914f6ba6dd0


[root@kubernetes-master-1 prometheus]# curl -I 100.244.244.132:9153/metrics
HTTP/1.1 200 OK
Content-Type: text/plain; version=0.0.4; charset=utf-8
Date: Tue, 02 Aug 2022 06:09:36 GMT

我们发现是正常的

然后我们需要将这个接口配置到Prometheus内使得Prometheus能够去采集到这个接口的数据

[root@kubernetes-master-1 prometheus]# kubectl get cm -n kube-monitor prometheus-config -oyaml
apiVersion: v1
data:
  prometheus.yml: |
    global:
      scrape_interval: 15s
      scrape_timeout: 15s

    scrape_configs:
    - job_name: 'prometheus'
      static_configs:
      - targets: ['localhost:9090']

    - job_name: 'Svc_CoreDNS'      # 通过Kubernetes内部的DNS解析来获取
      static_configs:
      - targets: ['kube-dns.kube-system.svc.cluster.local:9153']

    - job_name: 'Static_CoreDNS'   # 通过静态配置来获取
      static_configs:
      - targets: ['100.244.244.132:9153','100.244.244.133:9153']
kind: ConfigMap
metadata:
  annotations:
    kubectl.kubernetes.io/last-applied-configuration: |
      {"apiVersion":"v1","data":{"prometheus.yml":"global:\n  scrape_interval: 15s\n  scrape_timeout: 15s\n\nscrape_configs:\n- job_name: 'prometheus'\n  static_configs:\n  - targets: ['localhost:9090']\n"},"kind":"ConfigMap","metadata":{"annotations":{},"name":"prometheus-config","namespace":"kube-monitor"}}
  creationTimestamp: "2022-08-01T17:32:49Z"
  name: prometheus-config
  namespace: kube-monitor
  resourceVersion: "37450"
  uid: 08f157ef-f1a7-4664-b1db-686b1d6d2ca4

这里需要强调一个点,ConfigMap更新之后会立刻同步到Prometheus的容器内的,但是Prometheus启动的时候应用的配置和我们更新的配置是不一样的,所以即使配置变更了Promehteus也不会应用新的配置,所以我们就涉及到了在部署Prometheus的时候有一个热加载功能的开启

热加载一下Prometheus
[root@kubernetes-master-1 prometheus]# curl -X POST 10.0.0.10:31656/-/reload

[root@kubernetes-master-1 prometheus]# kubectl logs -n kube-monitor prometheus-f78c85b87-ptn5l
......
ts=2022-08-02T09:49:59.804Z caller=main.go:1177 level=info msg="Loading configuration file" filename=/etc/prometheus/prometheus.yml
ts=2022-08-02T09:49:59.806Z caller=main.go:1214 level=info msg="Completed loading of configuration file" filename=/etc/prometheus/prometheus.yml totalDuration=1.813281ms db_storage=1.055碌s remote_storage=1.486碌s web_handler=15.998碌s query_engine=2.7碌s scrape=406.915碌s scrape_sd=136.8碌s notify=712ns notify_sd=1.134碌s rules=26.182碌s tracing=14.756碌s

从这里可以看到 Loading configuration file 加载了配置文件0
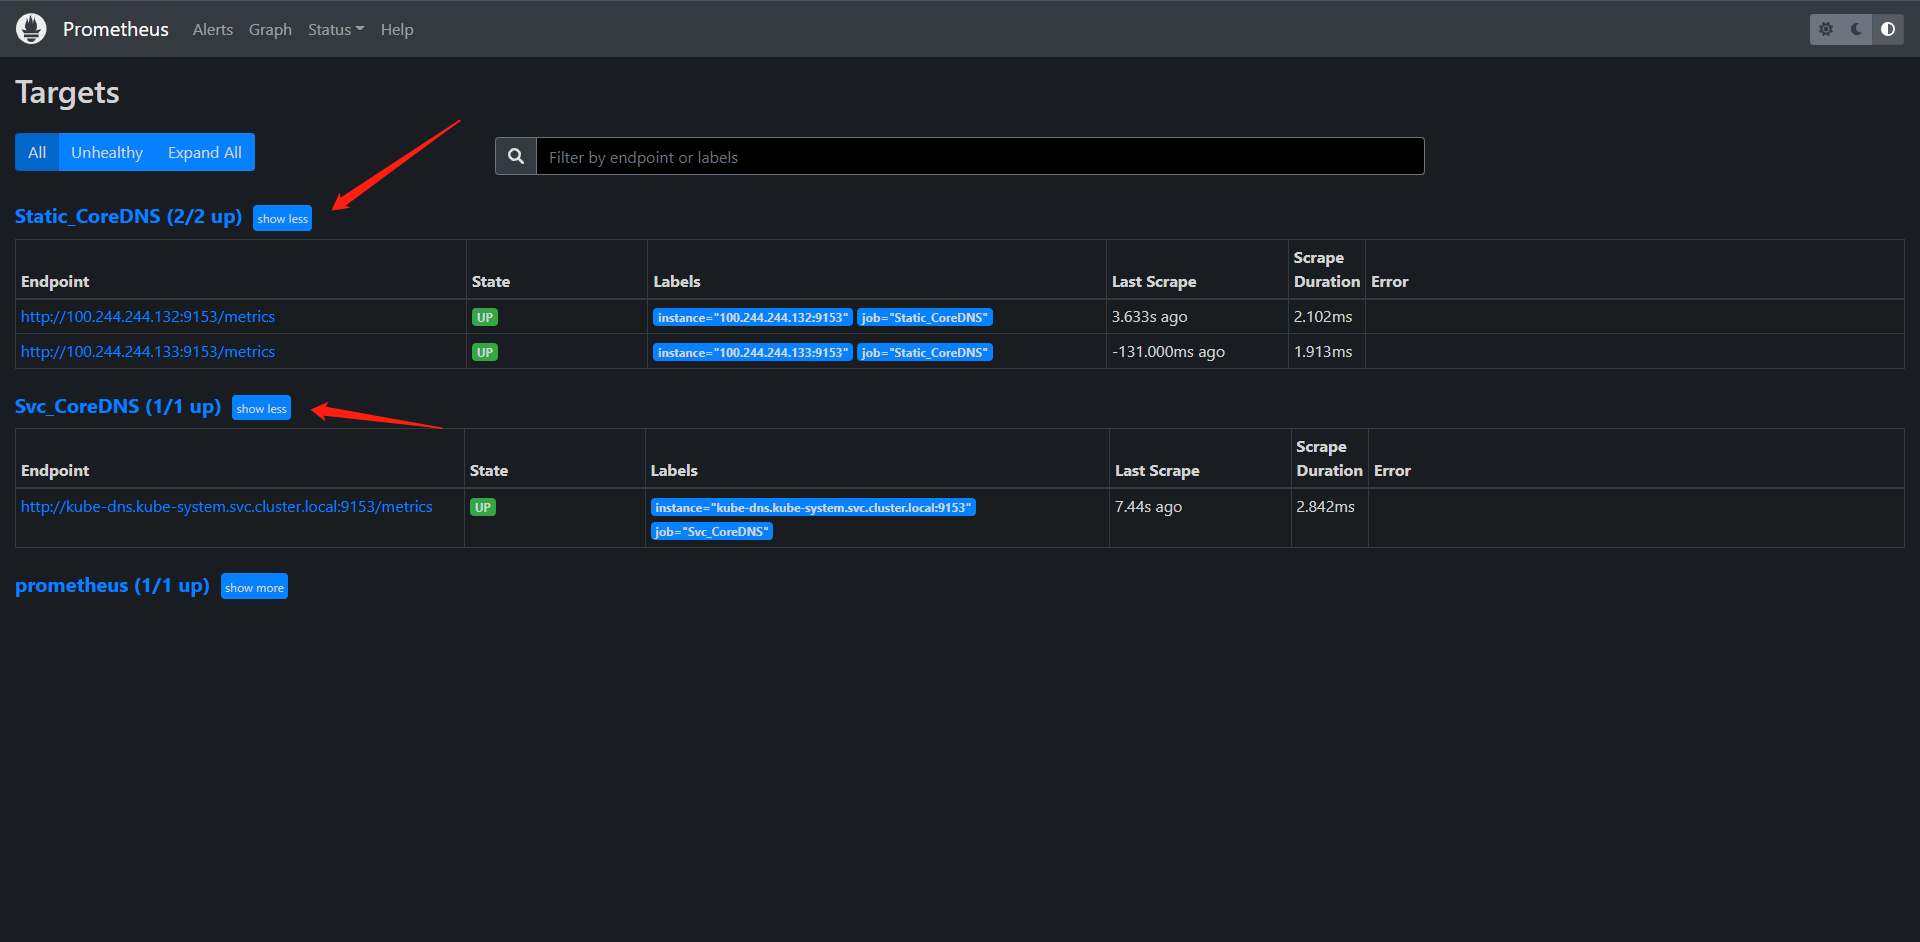
这里我就用Static的配置来给用吧
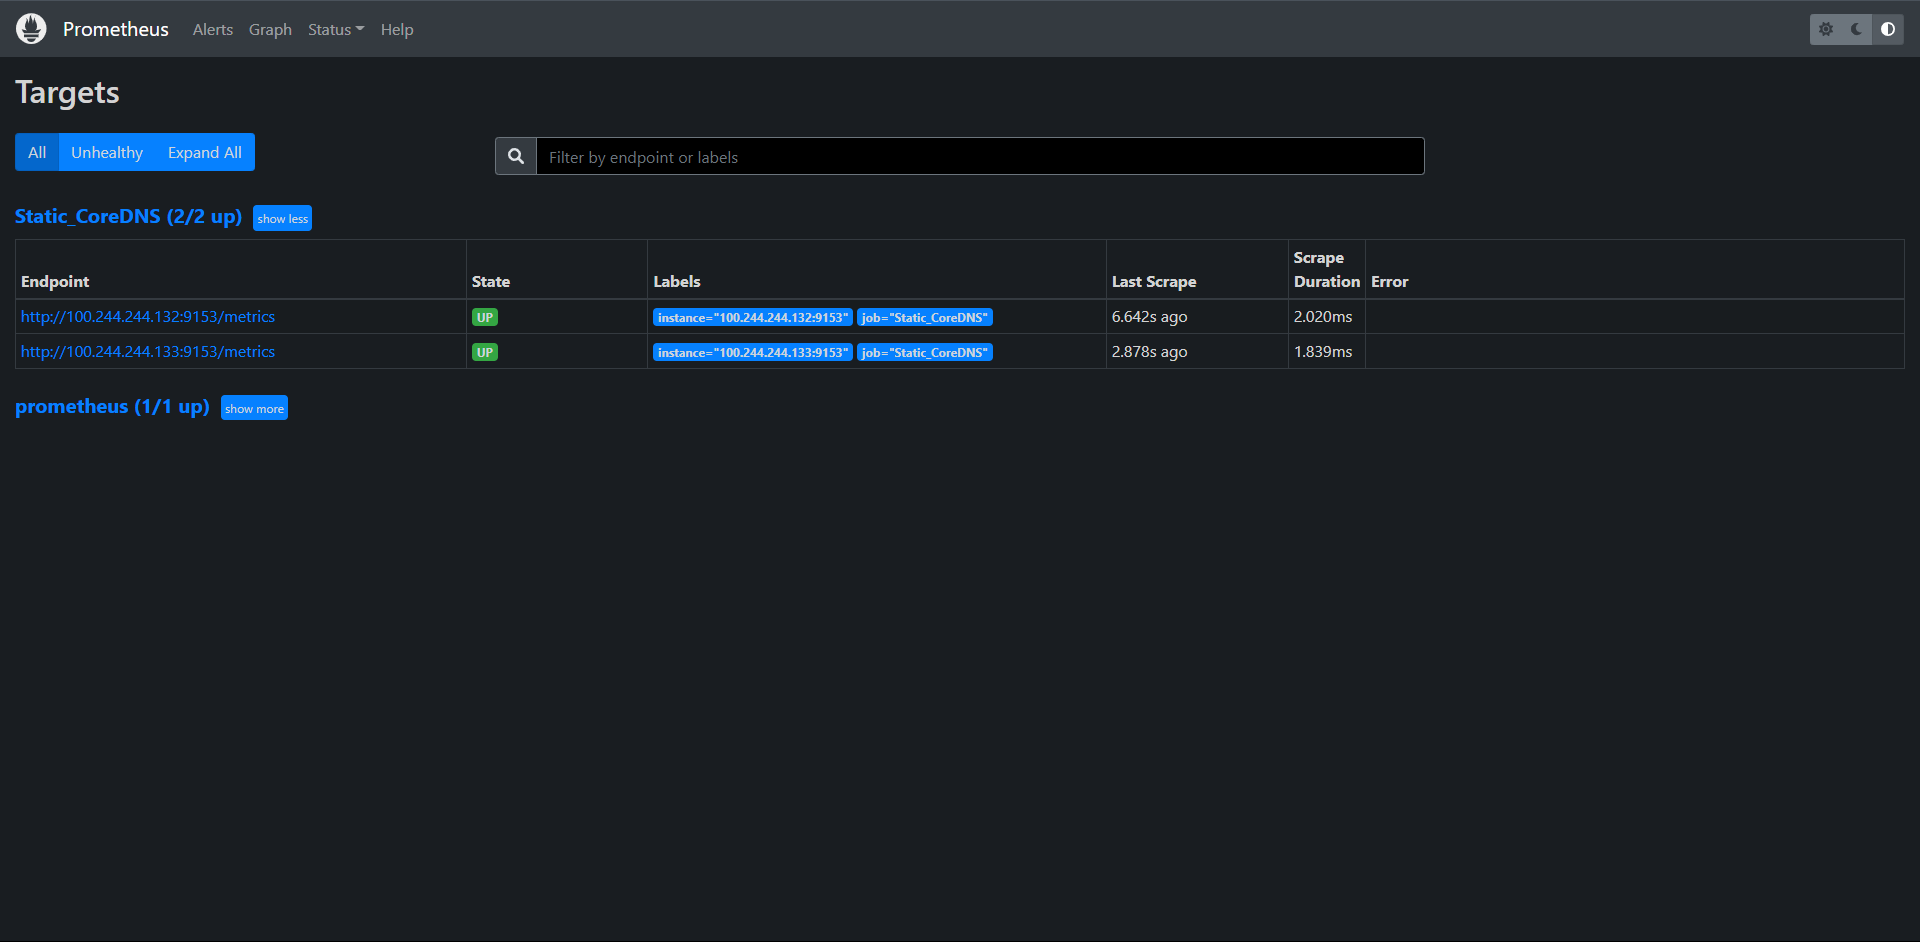
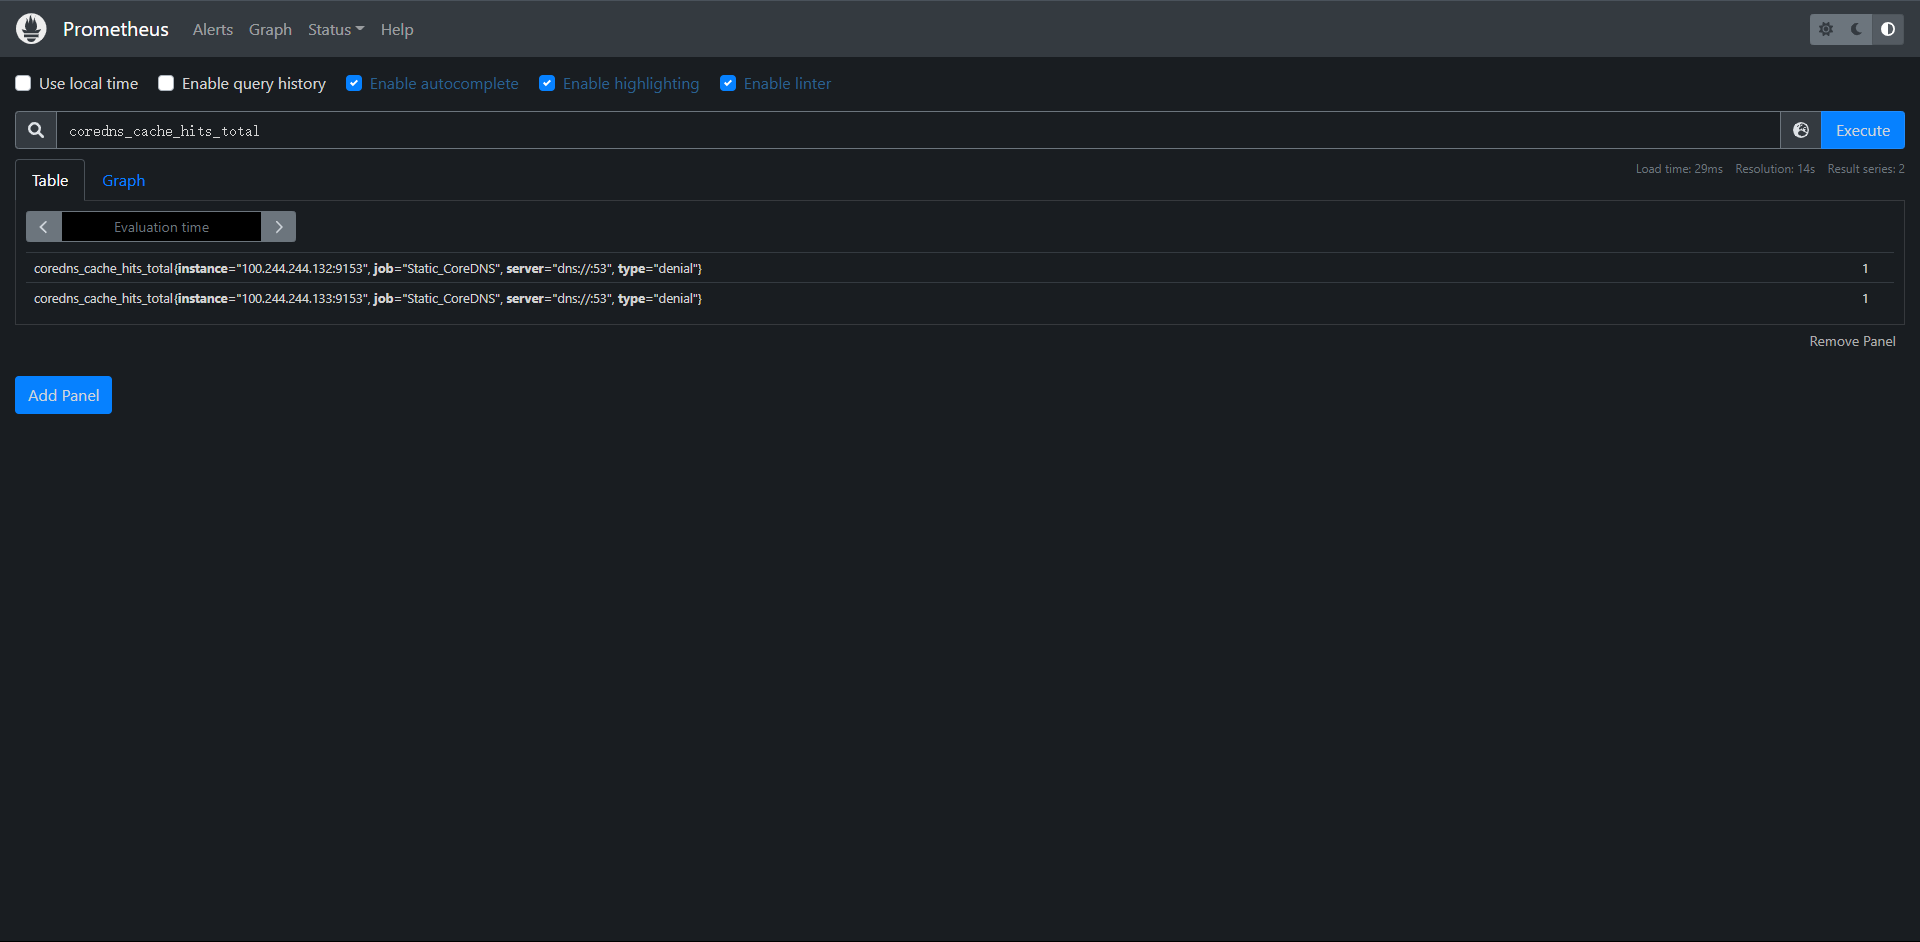
15.3.2:使用Exporter监控
上面我们也说过一些应用并不自带/metrics接口提供给Prometheus使用,在这种情况下我们就需要要利用exporter服务来为Prometheus提供指标接口了,Prometheus官方为许多应用提供了exporter应用,也有第三方的实现,我们可以前往官方网站进行查看:`exporters`,当然了如果你的应用本身也没有exporter实现,那么我们就需要想办法实现一个/metrics接口了,只要能够提供一个合法的/metrics接口,Prometheus就可以监控应用。

比如我们通过redis-exporter的服务监控redis服务,对于这类应用,我们一般使用sidecar的形式和主应用部署在同一个Pod中。比如我们这里来部署一个redis应用,并用redis-exporter的方式采集监控数据供Prometheus使用,如:

[root@kubernetes-master-1 redis]# cat redis.yaml
kind: Deployment
apiVersion: apps/v1
metadata:
  name: redis
  namespace: kube-monitor
  labels:
    app: redis
spec:
  selector:
    matchLabels:
      app: redis
  template:
    metadata:
      labels:
        app: redis
    spec:
      containers:
      - name: redis
        image: redis:latest
        resources:
          requests:
            cpu: 100m
            memory: 100Mi
          limits:
            cpu: 100m
            memory: 100Mi
        ports:
          - containerPort: 6379
      - name: redis-exporter
        image: oliver006/redis_exporter:latest
        resources:
          requests:
            cpu: 100m
            memory: 100Mi
          limits:
            cpu: 100m
            memory: 100Mi
        ports:
          - containerPort: 9121
---
kind: Service
apiVersion: v1
metadata:
  name: redis
  namespace: kube-monitor
  labels:
    app: redis
spec:
  type: ClusterIP
  selector:
    app: redis
  ports:
    - name: redis
      port: 6379
      targetPort: 6379
    - name: exporter
      port: 9121
      targetPort: 9121

[root@kubernetes-master-1 redis]# kubectl apply -f redis.yaml
deployment.apps/redis created
service/redis created

[root@kubernetes-master-1 redis]# kubectl get pod,svc -n kube-monitor
NAME                             READY   STATUS    RESTARTS        AGE
pod/prometheus-f78c85b87-ptn5l   1/1     Running   1 (7h11m ago)   17h
pod/redis-779d956746-cpzxk       2/2     Running   0               68s

NAME                 TYPE        CLUSTER-IP       EXTERNAL-IP   PORT(S)             AGE
service/prometheus   NodePort    200.102.66.207   <none>        9090:31656/TCP      16h
service/redis        ClusterIP   200.100.79.152   <none>        6379/TCP,9121/TCP   68s

修改Prometehus的ConfigMap配置文件

[root@kubernetes-master-1 redis]# kubectl get cm -n kube-monitor prometheus-config -oyaml
apiVersion: v1
data:
  prometheus.yml: |
    global:
      scrape_interval: 15s
      scrape_timeout: 15s

    scrape_configs:
    - job_name: 'prometheus'
      static_configs:
      - targets: ['localhost:9090']

    - job_name: 'Static_CoreDNS'
      static_configs:
      - targets: ['100.244.244.132:9153','100.244.244.133:9153']

    - job_name: 'Redis_Exporter'
      static_configs:
      - targets: ['redis.kube-monitor.svc.cluster.local:9121']

    - job_name: 'Redis_Exporter'
      static_configs:
      - targets: ['redis:9121']  # 这个和上面的是都可以的。二选一即可
kind: ConfigMap
metadata:
  annotations:
    kubectl.kubernetes.io/last-applied-configuration: |
      {"apiVersion":"v1","data":{"prometheus.yml":"global:\n  scrape_interval: 15s\n  scrape_timeout: 15s\n\nscrape_configs:\n- job_name: 'prometheus'\n  static_configs:\n  - targets: ['localhost:9090']\n"},"kind":"ConfigMap","metadata":{"annotations":{},"name":"prometheus-config","namespace":"kube-monitor"}}
  creationTimestamp: "2022-08-01T17:32:49Z"
  name: prometheus-config
  namespace: kube-monitor
  resourceVersion: "62469"
  uid: 08f157ef-f1a7-4664-b1db-686b1d6d2ca4

重载Prometheus
[root@kubernetes-master-1 redis]# curl -X POST 10.0.0.10:31656/-/reload
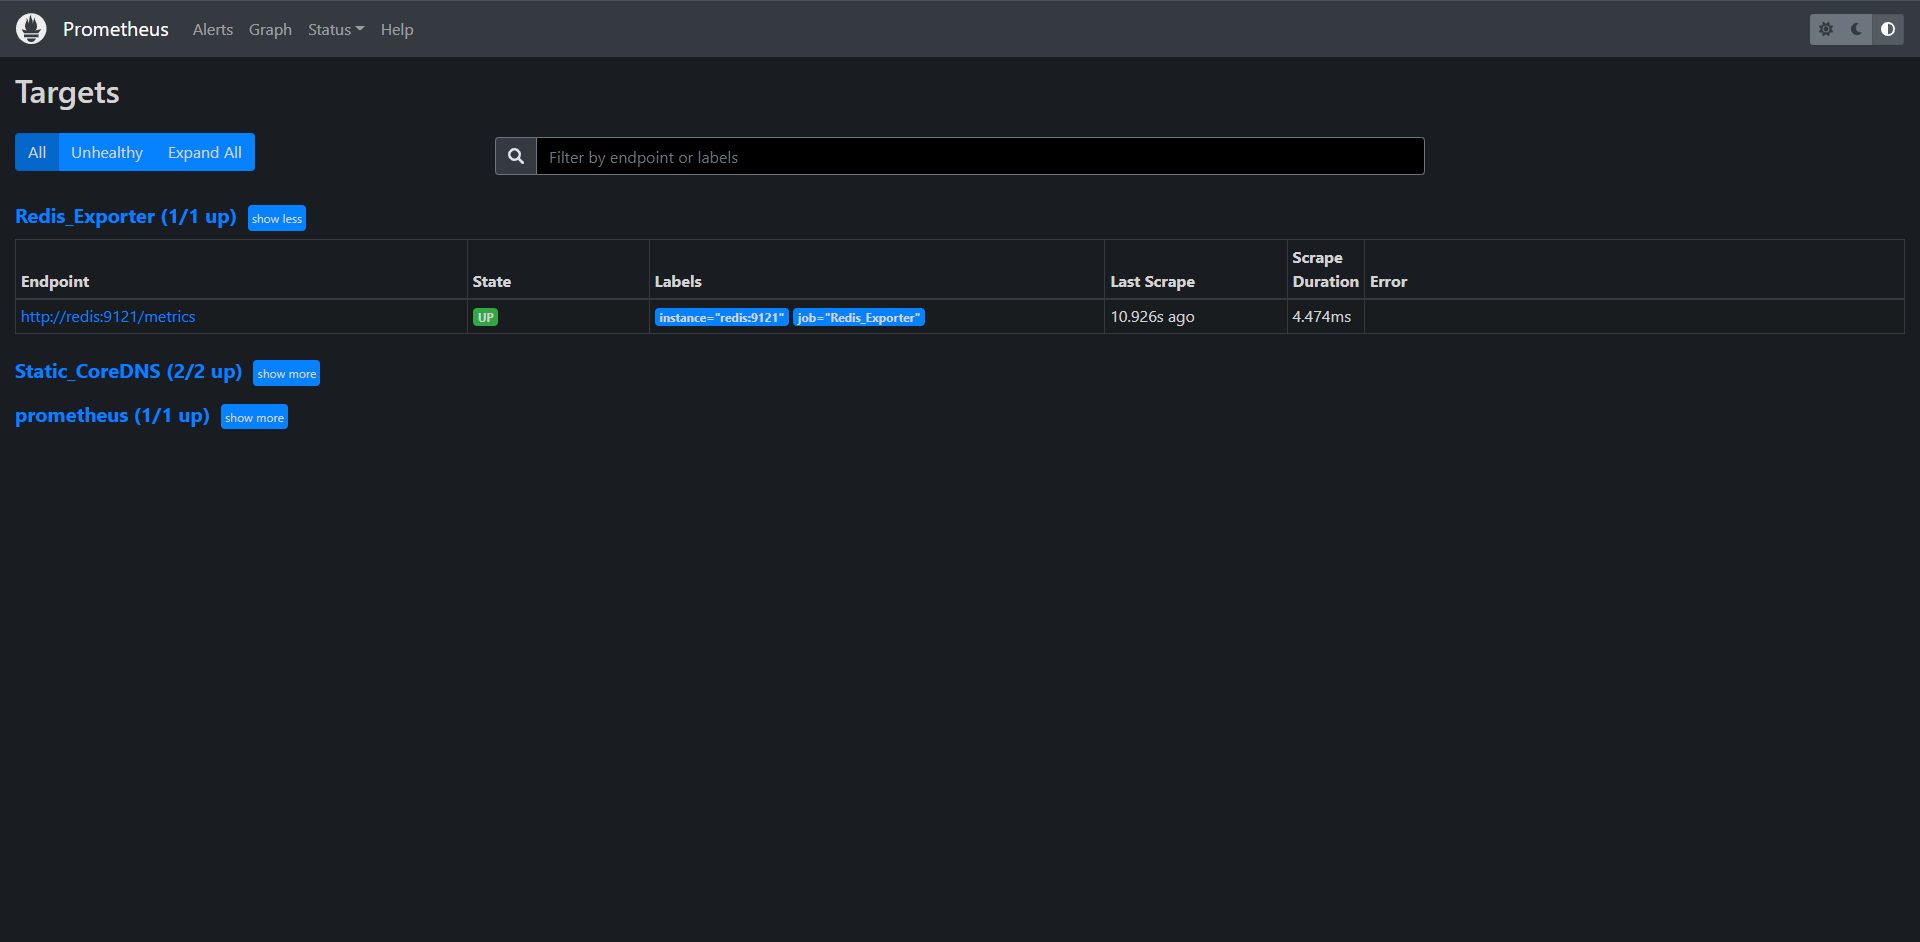
我这里直接用了k8s内部的DNS来走svc了,当然了coredns也是也可以这么玩,我们改一下
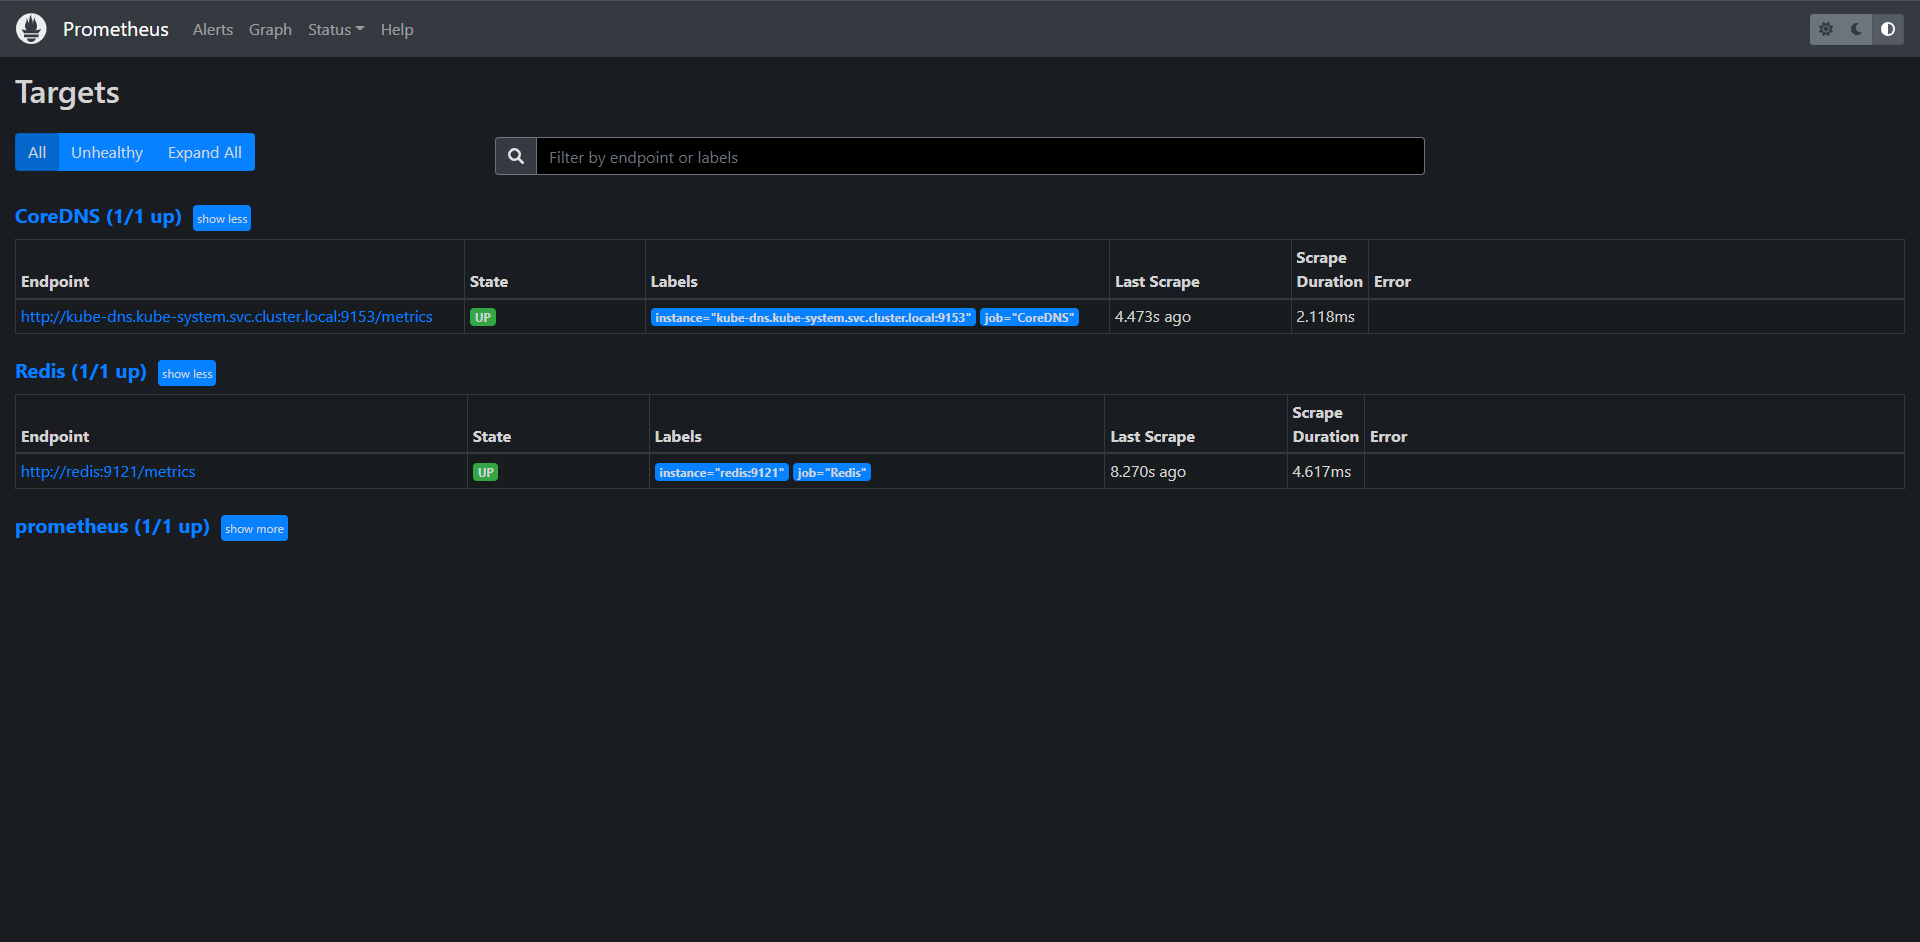
15.4:集群节点监控
前面我们学习了怎么使用Prometheus监控Kubernetes集群在中的应用,但是对于Kubernetes集群本身的监控也是非常重要的,我们需要时刻了解集群的运行状态。

对于集群监控一般我们需要考虑以下几点

1:Kubernetes节点监控,比如:CPU,Load,Disk,Memory等指标
2:内部系统组件状态,比如:Kube-scheduler,kube-controller-manager,kubedns/coredns,kube-apiserver等组件的
3:编排级的metrics,比如:Deployment的状态,资源请求,调度和API延迟等数据指标

kubernetes集群监控方案目前有以下几种:

1:cAdvisor:cAdvisor是Google开源的容器资源监控和性能分析工具,它专门为容器而生,本身也支持Docker容器
2:kube-state-metrics:kube-state-metrics通过监听API Server生成有关资源对象的状态指标,比如Deployment,Node,Pod,需要注意的是kube-state-metrics只能简单提供一个Metrics数据,并不会存储这些数据指标,所以我们需要用Prometehus来抓取这些指标然后存储
3:metrics-server:metrics-server也是一个集群范围内的资源数据聚合工具,是Heapster的替代品,同样Metrics-server也只能显示数据,并不提供数据存储。

不过kube-state-metrics和Metrics-server之间还是有很大的不同的,二者区别如下:
1:kube-state-metrics:主要关注的是业务相关的一些元数据,比如:Deployment,Pod副本状态等信息
2:metrics-server:主要关注的是`资源度量 API`的实现,比如:CPU,文件描述符,内存请求延时等指标。
15.4.1:监控集群节点
要监控节点同样我们这里使用Node_Exporter,由于每个节点我们都需要获取到监控指标,所以我们可以采取DS(DaemonSet)控制器来部署该服务,这样每一个节点都会自动运行一个node_exporter的Pod,如果我们在集群中删除或者添加节点后也会自动进行扩展

在部署node_exporter的时候有一些细节需要注意,资源清单如下:

[root@kubernetes-master-1 prometheus]# cat node-exporter.yaml
apiVersion: apps/v1
kind: DaemonSet
metadata:
  name: node-exporter
  namespace: kube-monitor
  labels:
    app: node-exporter
spec:
  selector:
    matchLabels:
      app: node-exporter
  template:
    metadata:
      labels:
        app: node-exporter
    spec:
      hostPID: true
      hostIPC: true
      hostNetwork: true
      nodeSelector:
        kubernetes.io/os: linux
      containers:
        - name: node-exporter
          image: prom/node-exporter:latest
          args:
            - --web.listen-address=$(HOSTIP):9100
            - --path.procfs=/host/proc
            - --path.sysfs=/host/sys
            - --path.rootfs=/host/root
            - --no-collector.hwmon
            - --no-collector.nfs
            - --no-collector.nfsd
            - --no-collector.nvme
            - --no-collector.dmi
            - --no-collector.arp
            - --collector.filesystem.ignored-mount-points=^/(dev|proc|sys|var/lib/containerd/.+|/var/lib/docker/.+|var/lib/kubelet/pods/.+)($|/)
            - --collector.filesystem.ignored-fs-types=^(autofs|binfmt_misc|cgroup|configfs|debugfs|devpts|devtmpfs|fusectl|hugetlbfs|mqueue|overlay|proc|procfs|pstore|rpc_pipefs|securityfs|sysfs|tracefs)$
          ports:
            - containerPort: 9100
          env:
            - name: HOSTIP
              valueFrom:
                fieldRef:
                  fieldPath: status.hostIP
          resources:
            requests:
              cpu: 150m
              memory: 180Mi
            limits:
              cpu: 150m
              memory: 180Mi
          securityContext:
            runAsNonRoot: true
            runAsUser: 65534
          volumeMounts:
            - name: proc
              mountPath: /host/proc
            - name: sys
              mountPath: /host/sys
            - name: root
              mountPath: /host/root
              mountPropagation: HostToContainer
              readOnly: true
      tolerations:
        - operator: "Exists"   # 这里是添加一个容忍
      volumes:
        - name: proc
          hostPath:
            path: /proc
        - name: dev
          hostPath:
            path: /dev
        - name: sys
          hostPath:
            path: /sys
        - name: root
          hostPath:
            path: /
[root@kubernetes-master-1 prometheus]# kubectl apply -f node-exporter.yaml
daemonset.apps/node-exporter created

[root@kubernetes-master-1 prometheus]# kubectl get pod -A
NAMESPACE      NAME                                          READY   STATUS    RESTARTS      AGE
kube-monitor   node-exporter-9xj4f                           1/1     Running   0             57s
kube-monitor   node-exporter-n5nsk                           1/1     Running   0             56s

接下来我们来测试访问一下:

[root@kubernetes-master-1 prometheus]# curl 10.0.0.10:9100
<html>
<head><title>Node Exporter</title></head>
<body>
<h1>Node Exporter</h1>
<p><a href="/metrics">Metrics</a></p>
</body>
</html>
[root@kubernetes-master-1 prometheus]# curl 10.0.0.11:9100
<html>
<head><title>Node Exporter</title></head>
<body>
<h1>Node Exporter</h1>
<p><a href="/metrics">Metrics</a></p>
</body>
</html>

这样就已经部署好了

这里为什么是访问节点的IP,是因为我们在启动容器的时候学了 hostNetwork=true,意思就是走我们的节点网络给容器。
接下来就是正常的操作将node_exporter的接口写入Prometheus的ConfigMap内就OK了

[root@kubernetes-master-1 prometheus]# kubectl get cm -n kube-monitor prometheus-config -oyaml
apiVersion: v1
data:
  prometheus.yml: |
    global:
      scrape_interval: 15s
      scrape_timeout: 15s

    scrape_configs:
    - job_name: 'prometheus'
      static_configs:
      - targets: ['localhost:9090']

    - job_name: 'CoreDNS'
      static_configs:
      - targets: ['kube-dns.kube-system.svc.cluster.local:9153']

    - job_name: 'Redis'
      static_configs:
      - targets: ['redis:9121']

    - job_name: 'node_exporter'
      statuc_configs:
      - targets: ['10.0.0.10:9100','10.0.0.11:9100']
kind: ConfigMap
metadata:
  annotations:
    kubectl.kubernetes.io/last-applied-configuration: |
      {"apiVersion":"v1","data":{"prometheus.yml":"global:\n  scrape_interval: 15s\n  scrape_timeout: 15s\n\nscrape_configs:\n- job_name: 'prometheus'\n  static_configs:\n  - targets: ['localhost:9090']\n"},"kind":"ConfigMap","metadata":{"annotations":{},"name":"prometheus-config","namespace":"kube-monitor"}}
  creationTimestamp: "2022-08-01T17:32:49Z"
  name: prometheus-config
  namespace: kube-monitor
  resourceVersion: "98512"
  uid: 08f157ef-f1a7-4664-b1db-686b1d6d2ca4

重载Prometheus配置
[root@kubernetes-master-1 prometheus]# curl -X POST 10.0.0.10:31656/-/reload
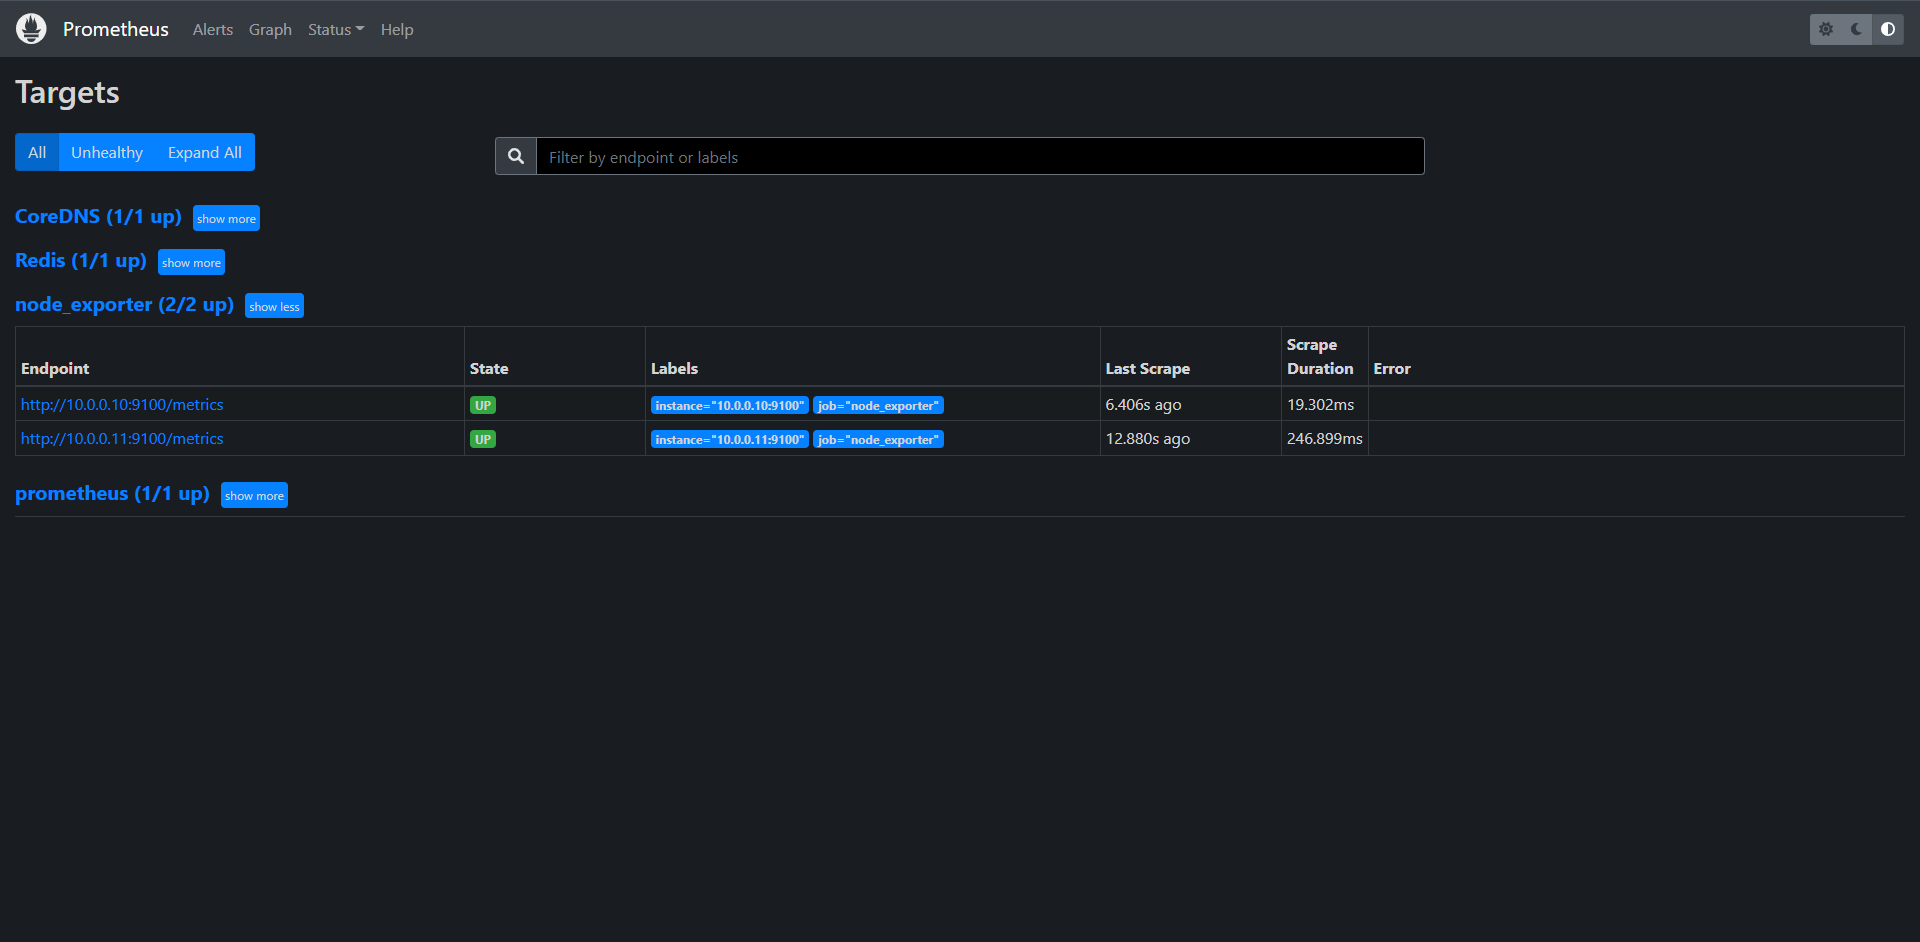
OK这里发现已经添加进来了,
15.4.2:自动发现(node_exporter)
当然了我们可以用下面的方法使用服务发现的方式来实现,其实这个就涉及到了Prometheus集成Kubernetes API的问题了,服务发现主要支持5类:Node,Service,Pod,EndPoints,Ingress。然后我们来集成一下自动发现Node

[root@kubernetes-master-1 prometheus]# kubectl get cm -n kube-monitor prometheus-config -oyaml
apiVersion: v1
data:
  prometheus.yml: |
    global:
      scrape_interval: 15s
      scrape_timeout: 15s

    scrape_configs:
    - job_name: 'prometheus'
      static_configs:
      - targets: ['localhost:9090']

    - job_name: 'CoreDNS'
      static_configs:
      - targets: ['kube-dns.kube-system.svc.cluster.local:9153']

    - job_name: 'Redis'
      static_configs:
      - targets: ['redis:9121']

    - job_name: 'node_exporter'
      static_configs:
      - targets: ['10.0.0.10:9100','10.0.0.11:9100']

    - job_name: 'discovery_node_exporter'
      kubernetes_sd_configs:
      - role: node
kind: ConfigMap
metadata:
  annotations:
    kubectl.kubernetes.io/last-applied-configuration: |
      {"apiVersion":"v1","data":{"prometheus.yml":"global:\n  scrape_interval: 15s\n  scrape_timeout: 15s\n\nscrape_configs:\n- job_name: 'prometheus'\n  static_configs:\n  - targets: ['localhost:9090']\n"},"kind":"ConfigMap","metadata":{"annotations":{},"name":"prometheus-config","namespace":"kube-monitor"}}
  creationTimestamp: "2022-08-01T17:32:49Z"
  name: prometheus-config
  namespace: kube-monitor
  resourceVersion: "99079"
  uid: 08f157ef-f1a7-4664-b1db-686b1d6d2ca4

重载Prometheus
[root@kubernetes-master-1 prometheus]# curl -X POST 10.0.0.10:31656/-/reload
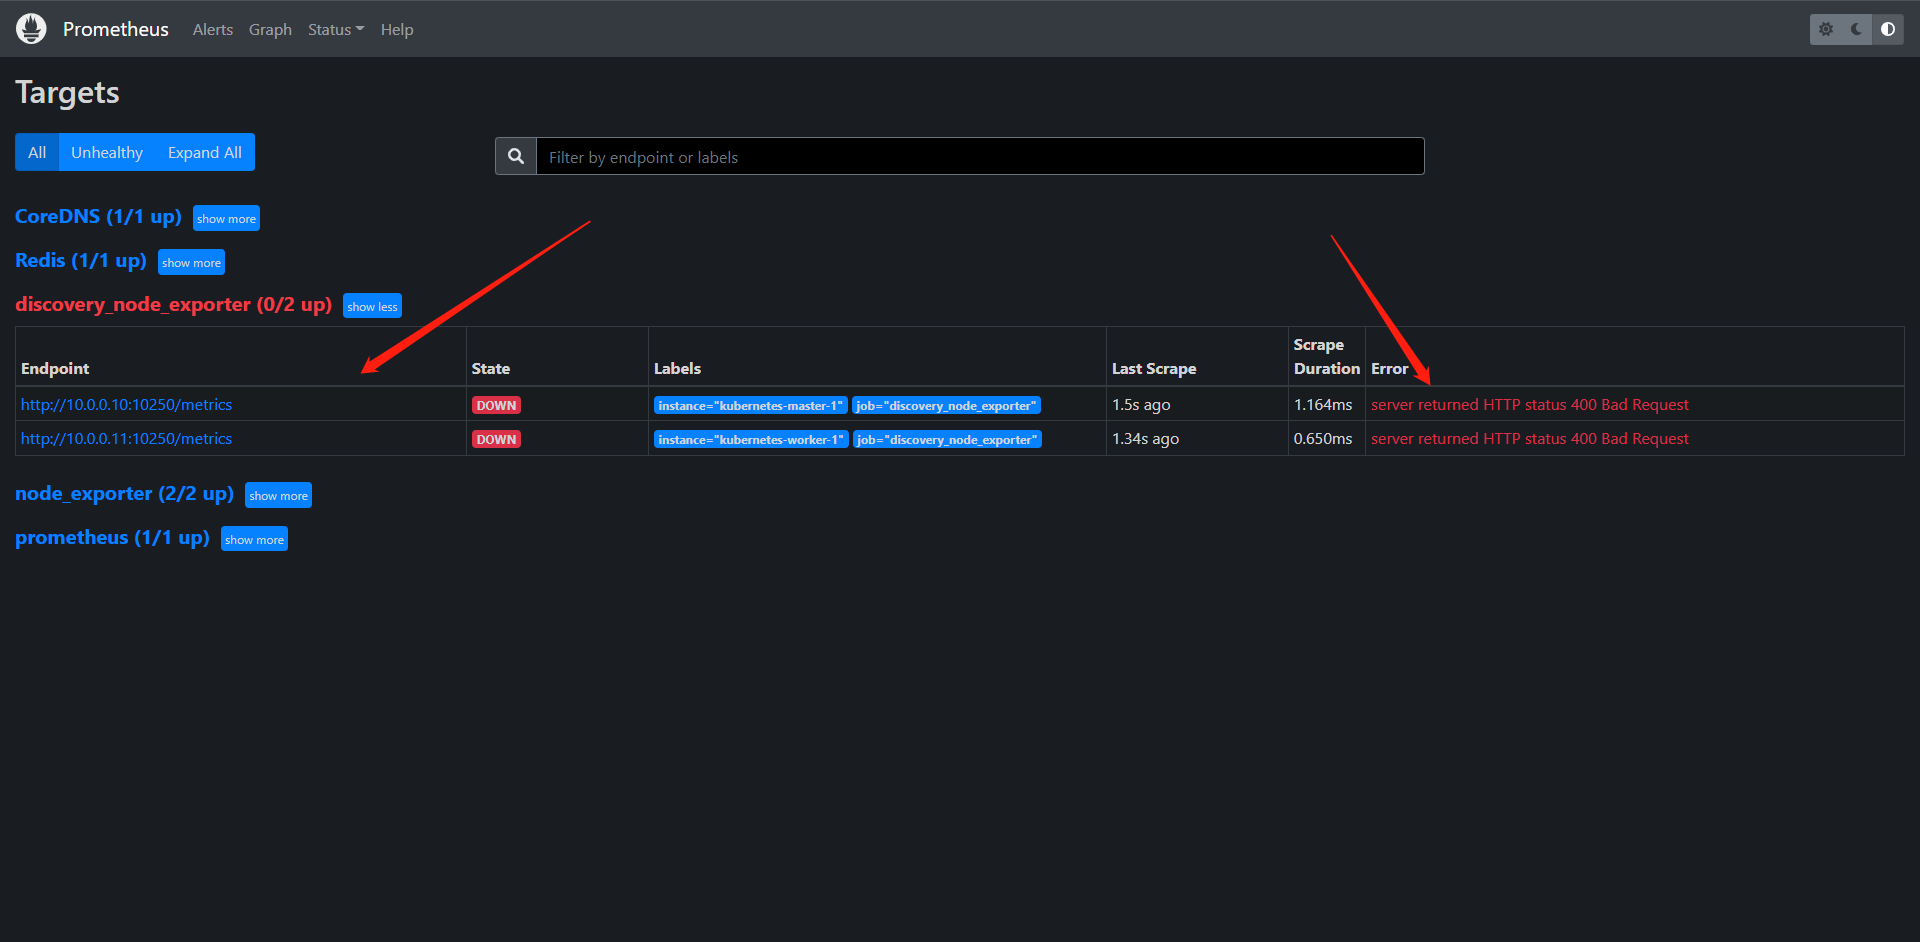
但是这里会有一个问题,就是我们发现的服务端口并不是我们想要的,所以我们完全可以通过Prometheus的relabel_configs来重新定义一下标签

[root@kubernetes-master-1 prometheus]# kubectl get cm -n kube-monitor prometheus-config -oyaml
apiVersion: v1
data:
  prometheus.yml: |
    global:
      scrape_interval: 15s
      scrape_timeout: 15s

    scrape_configs:
    - job_name: 'prometheus'
      static_configs:
      - targets: ['localhost:9090']

    - job_name: 'CoreDNS'
      static_configs:
      - targets: ['kube-dns.kube-system.svc.cluster.local:9153']

    - job_name: 'Redis'
      static_configs:
      - targets: ['redis:9121']

    - job_name: 'node_exporter'
      static_configs:
      - targets: ['10.0.0.10:9100','10.0.0.11:9100']

    - job_name: 'discovery_node_exporter'
      kubernetes_sd_configs:
      - role: node
      relabel_configs:
        - source_labels: [__address__]   # 匹配__address__
          regex: "(.*):10250"            # 标记需要更改的值
          replacement: "${1}:9100"       # 保留host部分替换port部分为9100
          target_label: __address__      # 存储到__address__
          action: replace                # 动作是替换
kind: ConfigMap
metadata:
  annotations:
    kubectl.kubernetes.io/last-applied-configuration: |
      {"apiVersion":"v1","data":{"prometheus.yml":"global:\n  scrape_interval: 15s\n  scrape_timeout: 15s\n\nscrape_configs:\n- job_name: 'prometheus'\n  static_configs:\n  - targets: ['localhost:9090']\n"},"kind":"ConfigMap","metadata":{"annotations":{},"name":"prometheus-config","namespace":"kube-monitor"}}
  creationTimestamp: "2022-08-01T17:32:49Z"
  name: prometheus-config
  namespace: kube-monitor
  resourceVersion: "99553"
  uid: 08f157ef-f1a7-4664-b1db-686b1d6d2ca4

重载Prometheus
[root@kubernetes-master-1 prometheus]# curl -X POST 10.0.0.10:31656/-/reload
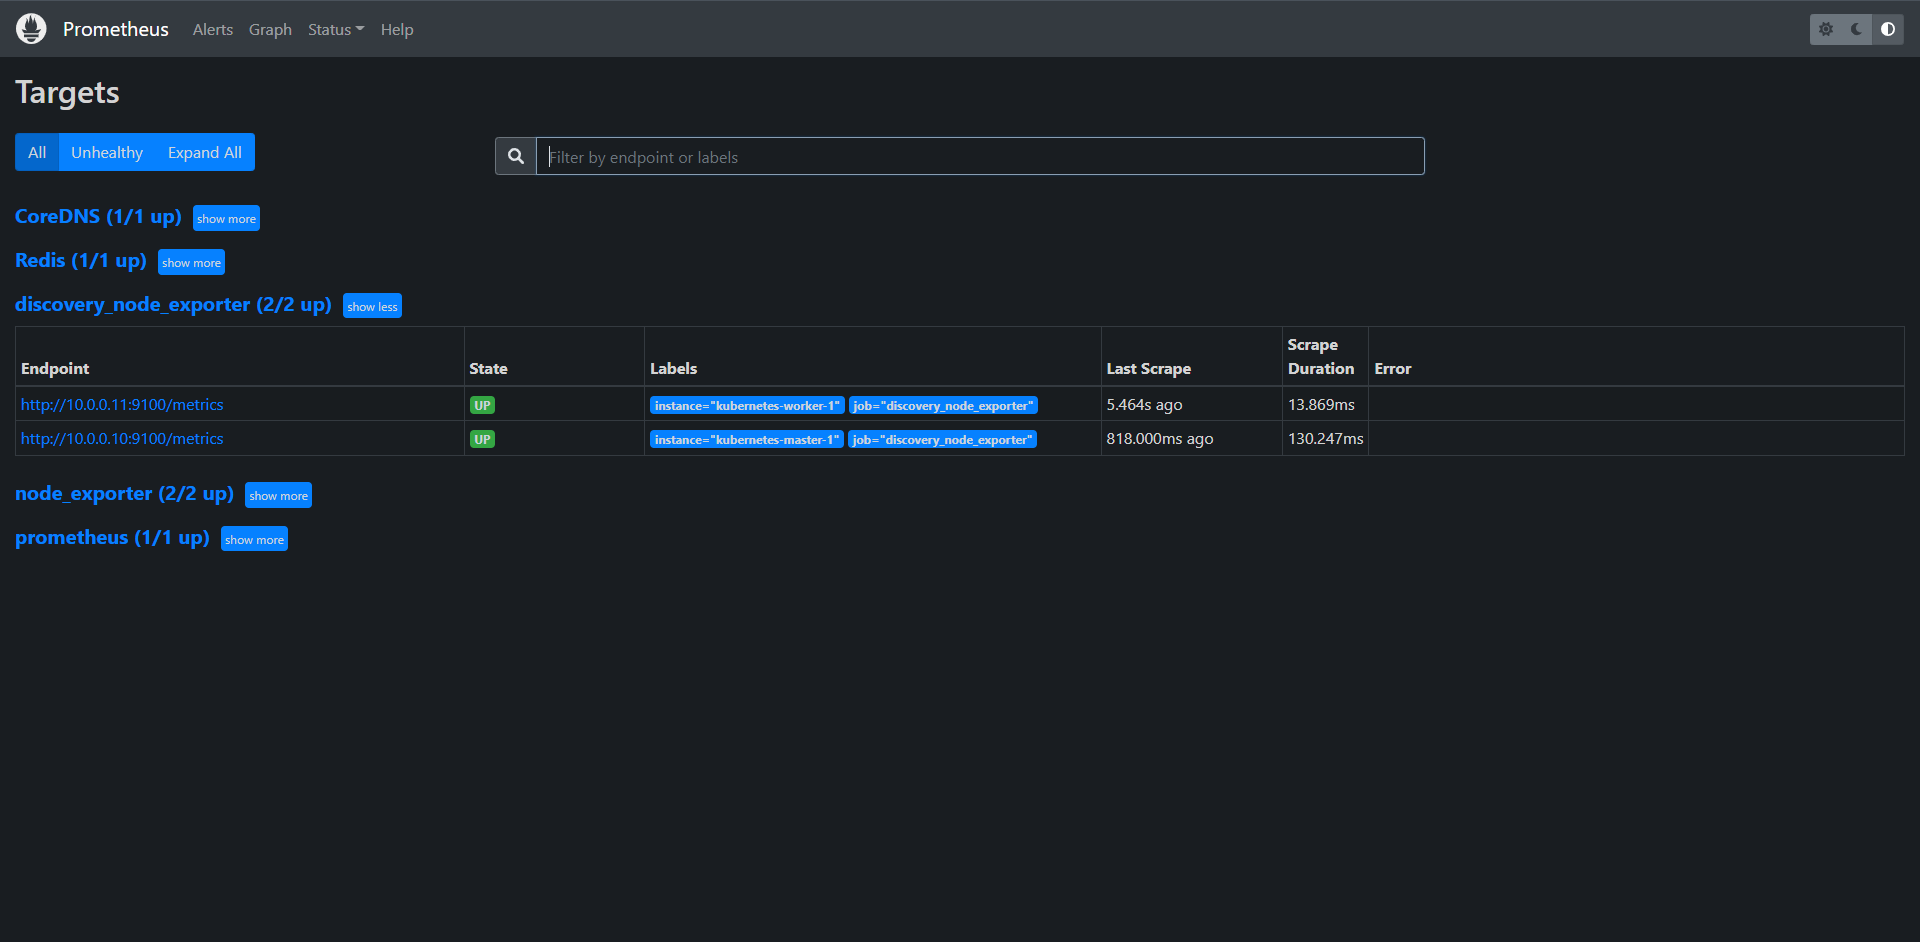
这样基本的自动发现node—exporter就做好了,当然这个时候其实我们完全可以添加一些其他的relabel来重写一下其他的标签,

[root@kubernetes-master-1 prometheus]# kubectl get cm -n kube-monitor prometheus-config -oyaml
apiVersion: v1
data:
  prometheus.yml: |
    global:
      scrape_interval: 15s
      scrape_timeout: 15s

    scrape_configs:
    - job_name: 'prometheus'
      static_configs:
      - targets: ['localhost:9090']

    - job_name: 'CoreDNS'
      static_configs:
      - targets: ['kube-dns.kube-system.svc.cluster.local:9153']

    - job_name: 'Redis'
      static_configs:
      - targets: ['redis:9121']

    - job_name: 'discovery_node_exporter'
      kubernetes_sd_configs:
      - role: node
      relabel_configs:
        - source_labels: [__address__]
          regex: "(.*):10250"
          replacement: "${1}:9100"
          target_label: __address__
          action: replace
        - action: labelmap
          regex: __meta_kubernetes_node_label_(.+)  # 保留__meta_kubernetes_node_label_后的所有标签
kind: ConfigMap
metadata:
  annotations:
    kubectl.kubernetes.io/last-applied-configuration: |
      {"apiVersion":"v1","data":{"prometheus.yml":"global:\n  scrape_interval: 15s\n  scrape_timeout: 15s\n\nscrape_configs:\n- job_name: 'prometheus'\n  static_configs:\n  - targets: ['localhost:9090']\n"},"kind":"ConfigMap","metadata":{"annotations":{},"name":"prometheus-config","namespace":"kube-monitor"}}
  creationTimestamp: "2022-08-01T17:32:49Z"
  name: prometheus-config
  namespace: kube-monitor
  resourceVersion: "103039"
  uid: 08f157ef-f1a7-4664-b1db-686b1d6d2ca4

重载Prometheus
[root@kubernetes-master-1 prometheus]# curl -X POST 10.0.0.10:31656/-/reload
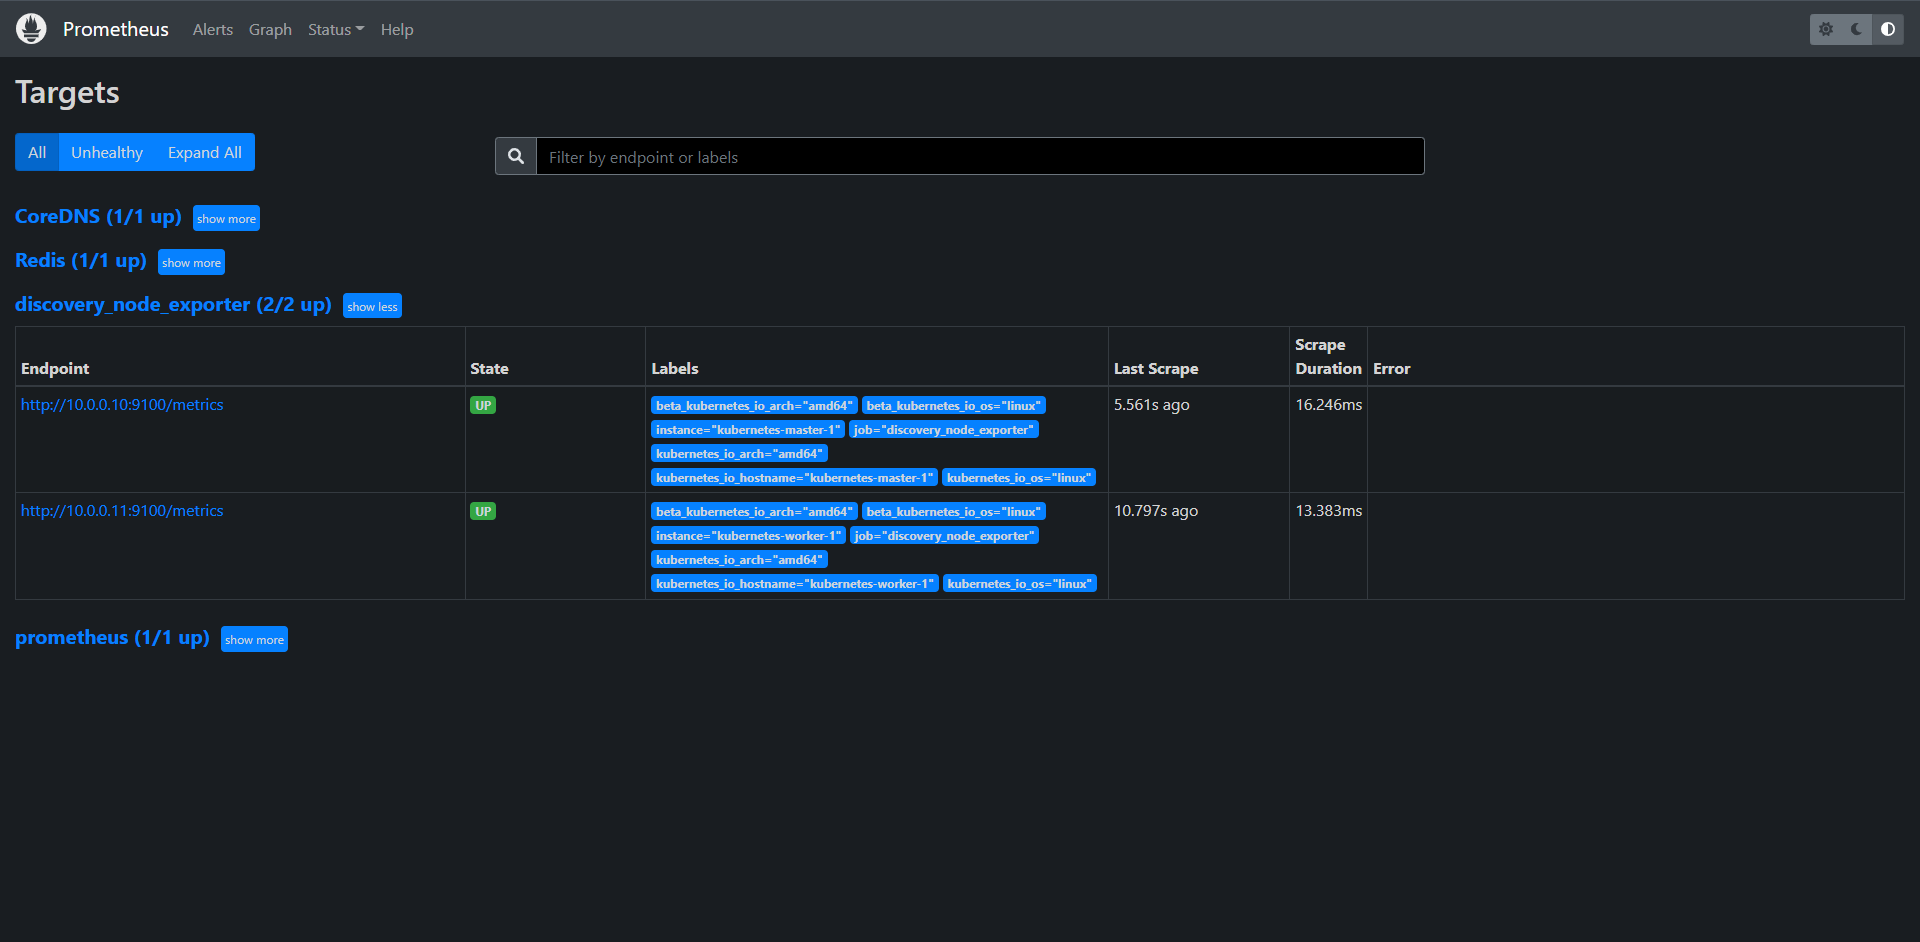
这样标签就保留下来了,这样操作之后我们有更多的选择来过滤数据或者聚合我们想要的数据和分组
15.4.3:自动发现(kubelet)
其实Kubelet也自带了一些监控数据指标,就上面我们看到的10250端口,所以我们也可以一起配置一下Kubelet的监控

[root@kubernetes-master-1 prometheus]# kubectl get cm -n kube-monitor prometheus-config -oyaml
apiVersion: v1
data:
  prometheus.yml: |
    global:
      scrape_interval: 15s
      scrape_timeout: 15s

    scrape_configs:
    - job_name: 'prometheus'
      static_configs:
      - targets: ['localhost:9090']

    - job_name: 'CoreDNS'
      static_configs:
      - targets: ['kube-dns.kube-system.svc.cluster.local:9153']

    - job_name: 'Redis'
      static_configs:
      - targets: ['redis:9121']

    - job_name: 'discovery_node_exporter'
      kubernetes_sd_configs:
      - role: node
      relabel_configs:
        - source_labels: [__address__]
          regex: "(.*):10250"
          replacement: "${1}:9100"
          target_label: __address__
          action: replace
        - action: labelmap
          regex: __meta_kubernetes_node_label_(.+)

    - job_name: 'kubelet'
      kubernetes_sd_configs:
      - role: node
      scheme: https
      tls_config:
        ca_file: /var/run/secrets/kubernetes.io/serviceaccount/ca.crt
        insecure_skip_verify: true
      bearer_token_file: /var/run/secrets/kubernetes.io/serviceaccount/token
      relabel_configs:
        - action: labelmap
          regex: __meta_kubernetes_node_label_(.+)
kind: ConfigMap
metadata:
  annotations:
    kubectl.kubernetes.io/last-applied-configuration: |
      {"apiVersion":"v1","data":{"prometheus.yml":"global:\n  scrape_interval: 15s\n  scrape_timeout: 15s\n\nscrape_configs:\n- job_name: 'prometheus'\n  static_configs:\n  - targets: ['localhost:9090']\n"},"kind":"ConfigMap","metadata":{"annotations":{},"name":"prometheus-config","namespace":"kube-monitor"}}
  creationTimestamp: "2022-08-01T17:32:49Z"
  name: prometheus-config
  namespace: kube-monitor
  resourceVersion: "103906"
  uid: 08f157ef-f1a7-4664-b1db-686b1d6d2ca4

重载Prometheus
[root@kubernetes-master-1 prometheus]# curl -X POST 10.0.0.10:31656/-/reload
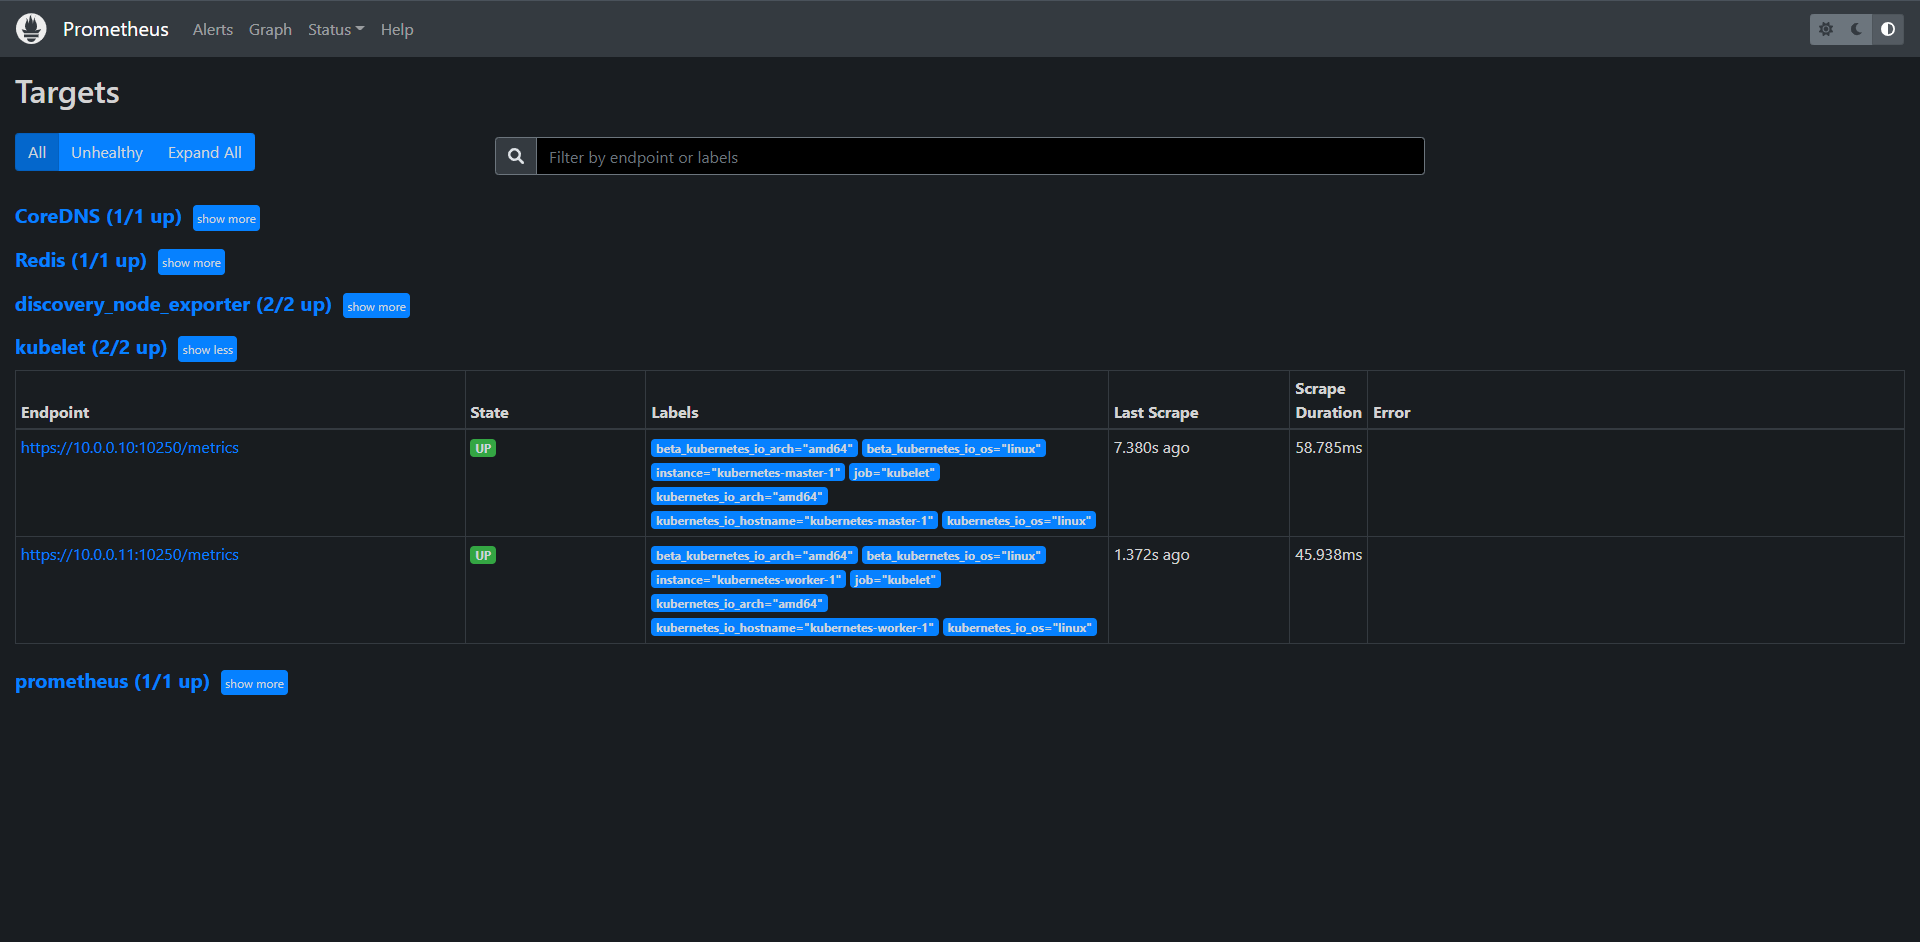
15.4.4:自动发现(Api Server)
Api Server作为Kubernetes最核心的组件,当然他的监控也是非常的重要的,对于api server的监控我们可以直接通过Kuubernetes的Service来获取,但是我们这里主要还是讲自动发现。

[root@kubernetes-master-1 prometheus]# kubectl get cm -n kube-monitor prometheus-config -oyaml
apiVersion: v1
data:
  prometheus.yml: |
    global:
      scrape_interval: 15s
      scrape_timeout: 15s

    scrape_configs:
    - job_name: 'prometheus'
      static_configs:
      - targets: ['localhost:9090']

    - job_name: 'CoreDNS'
      static_configs:
      - targets: ['kube-dns.kube-system.svc.cluster.local:9153']

    - job_name: 'Redis'
      static_configs:
      - targets: ['redis:9121']

    - job_name: 'discovery_node_exporter'
      kubernetes_sd_configs:
      - role: node
      relabel_configs:
        - source_labels: [__address__]
          regex: "(.*):10250"
          replacement: "${1}:9100"
          target_label: __address__
          action: replace
        - action: labelmap
          regex: __meta_kubernetes_node_label_(.+)

    - job_name: 'kubelet'
      kubernetes_sd_configs:
      - role: node
      scheme: https
      tls_config:
        ca_file: /var/run/secrets/kubernetes.io/serviceaccount/ca.crt
        insecure_skip_verify: true
      bearer_token_file: /var/run/secrets/kubernetes.io/serviceaccount/token
      relabel_configs:
        - action: labelmap
          regex: __meta_kubernetes_node_label_(.+)

    - job_name: 'api_server'
      kubernetes_sd_configs:
      - role: endpoints
kind: ConfigMap
metadata:
  annotations:
    kubectl.kubernetes.io/last-applied-configuration: |
      {"apiVersion":"v1","data":{"prometheus.yml":"global:\n  scrape_interval: 15s\n  scrape_timeout: 15s\n\nscrape_configs:\n- job_name: 'prometheus'\n  static_configs:\n  - targets: ['localhost:9090']\n"},"kind":"ConfigMap","metadata":{"annotations":{},"name":"prometheus-config","namespace":"kube-monitor"}}
  creationTimestamp: "2022-08-01T17:32:49Z"
  name: prometheus-config
  namespace: kube-monitor
  resourceVersion: "138044"
  uid: 08f157ef-f1a7-4664-b1db-686b1d6d2ca4

重载Prometheus
[root@kubernetes-master-1 prometheus]# curl -X POST 10.0.0.10:31656/-/reload
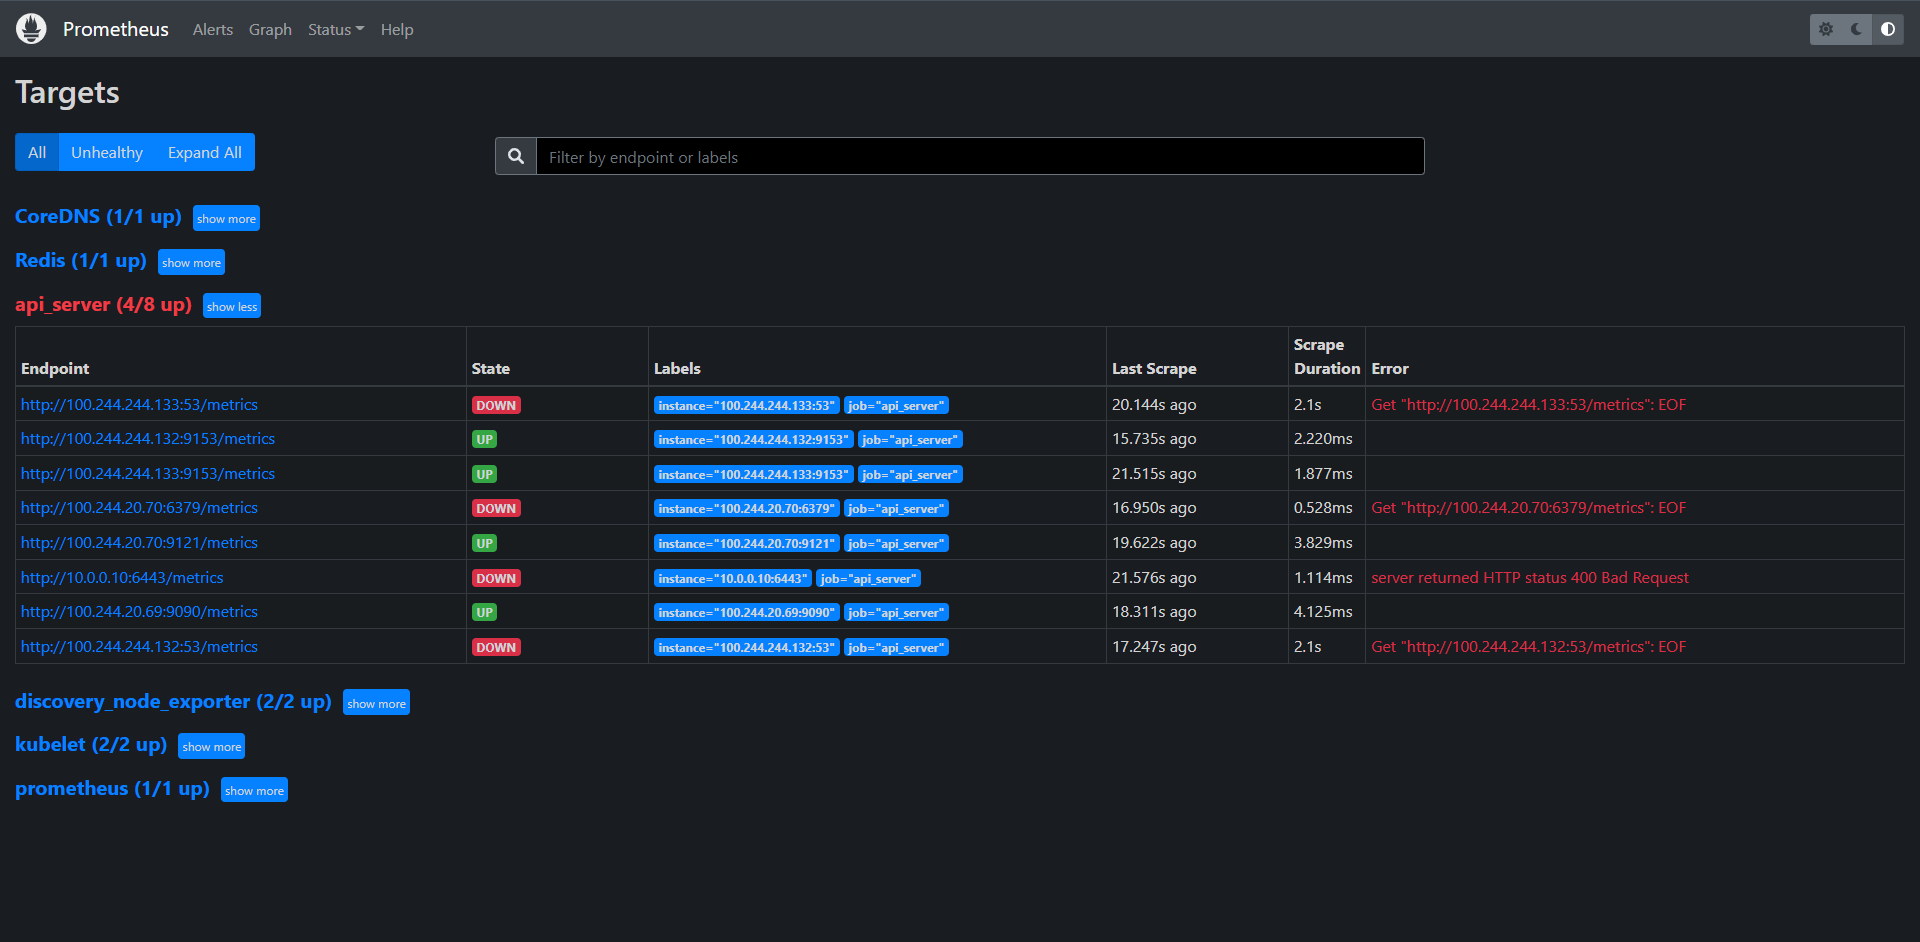
这里我们会看到一些个问题,有些说的是我们没有/metrics这个接口,所以才报错,有些就是400或者404无法找到这个端口,我们这里其实无法保证的就是所有的endpoints都存在/metrics的接口,那么我们这里面其实主要过滤的还是API Server,那么我们就需要过滤一下,只保留API Server就行了:

apiVersion: v1
data:
  prometheus.yml: |
    global:
      scrape_interval: 15s
      scrape_timeout: 15s

    scrape_configs:
    - job_name: 'prometheus'
      static_configs:
      - targets: ['localhost:9090']

    - job_name: 'CoreDNS'
      static_configs:
      - targets: ['kube-dns.kube-system.svc.cluster.local:9153']

    - job_name: 'Redis'
      static_configs:
      - targets: ['redis:9121']

    - job_name: 'discovery_node_exporter'
      kubernetes_sd_configs:
      - role: node
      relabel_configs:
        - source_labels: [__address__]
          regex: "(.*):10250"
          replacement: "${1}:9100"
          target_label: __address__
          action: replace
        - action: labelmap
          regex: __meta_kubernetes_node_label_(.+)

    - job_name: 'kubelet'
      kubernetes_sd_configs:
      - role: node
      scheme: https
      tls_config:
        ca_file: /var/run/secrets/kubernetes.io/serviceaccount/ca.crt
        insecure_skip_verify: true
      bearer_token_file: /var/run/secrets/kubernetes.io/serviceaccount/token
      relabel_configs:
        - action: labelmap
          regex: __meta_kubernetes_node_label_(.+)

    - job_name: 'api_server'
      kubernetes_sd_configs:
      - role: endpoints
      scheme: https
      tls_config:
        ca_file: /var/run/secrets/kubernetes.io/serviceaccount/ca.crt
        insecure_skip_verify: true
      bearer_token_file: /var/run/secrets/kubernetes.io/serviceaccount/token
      relabel_configs:
        - source_labels:
            [
              __meta_kubernetes_namespace,
              __meta_kubernetes_service_name,
              __meta_kubernetes_endpoint_port_name,
            ]
          action: keep
          regex: default;kubernetes;https

kind: ConfigMap
metadata:
  annotations:
    kubectl.kubernetes.io/last-applied-configuration: |
      {"apiVersion":"v1","data":{"prometheus.yml":"global:\n  scrape_interval: 15s\n  scrape_timeout: 15s\n\nscrape_configs:\n- job_name: 'prometheus'\n  static_configs:\n  - targets: ['localhost:9090']\n"},"kind":"ConfigMap","metadata":{"annotations":{},"name":"prometheus-config","namespace":"kube-monitor"}}
  creationTimestamp: "2022-08-01T17:32:49Z"
  name: prometheus-config
  namespace: kube-monitor
  resourceVersion: "138044"
  uid: 08f157ef-f1a7-4664-b1db-686b1d6d2ca4

重载Prometheus
[root@kubernetes-master-1 prometheus]# curl -X POST 10.0.0.10:31656/-/reload
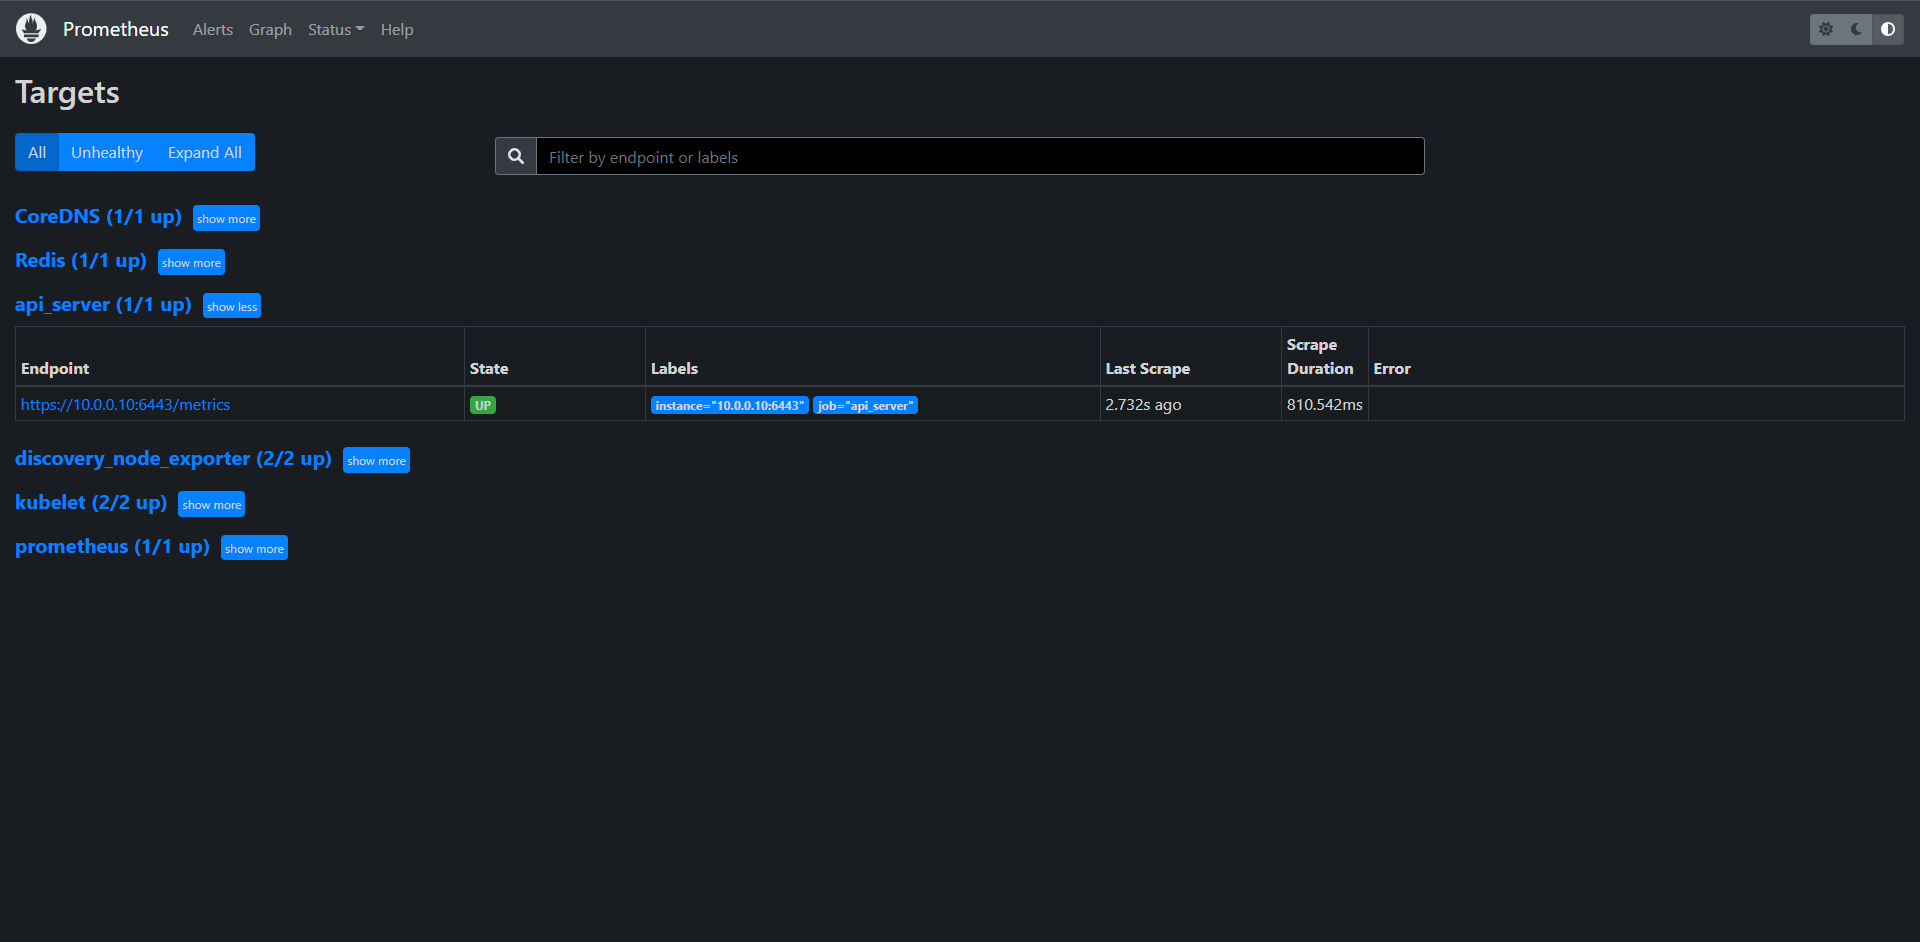
15.4.5:自动发现(Pod)
上面监控API Server其实使用的是一种特殊的endpoints,现在我们同样来配置一个专门发现普通类型的EndPoint,其实就是SVC绑定的Pod列表,由于并不是所有的EndPoints都会提供/metrics接口,所以需要我们主动告诉Prometheus去发现哪儿些EndPoints,当然了告诉它的方式非常多,我们常见的就是通过注解:annotations:

apiVersion: v1
data:
  prometheus.yml: |
    global:
      scrape_interval: 15s
      scrape_timeout: 15s

    scrape_configs:
    - job_name: 'prometheus'
      static_configs:
      - targets: ['localhost:9090']

    - job_name: 'CoreDNS'
      static_configs:
      - targets: ['kube-dns.kube-system.svc.cluster.local:9153']

    - job_name: 'Redis'
      static_configs:
      - targets: ['redis:9121']

    - job_name: 'discovery_node_exporter'
      kubernetes_sd_configs:
      - role: node
      relabel_configs:
        - source_labels: [__address__]
          regex: "(.*):10250"
          replacement: "${1}:9100"
          target_label: __address__
          action: replace
        - action: labelmap
          regex: __meta_kubernetes_node_label_(.+)

    - job_name: 'kubelet'
      kubernetes_sd_configs:
      - role: node
      scheme: https
      tls_config:
        ca_file: /var/run/secrets/kubernetes.io/serviceaccount/ca.crt
        insecure_skip_verify: true
      bearer_token_file: /var/run/secrets/kubernetes.io/serviceaccount/token
      relabel_configs:
        - action: labelmap
          regex: __meta_kubernetes_node_label_(.+)

    - job_name: 'api_server'
      kubernetes_sd_configs:
      - role: endpoints
      scheme: https
      tls_config:
        ca_file: /var/run/secrets/kubernetes.io/serviceaccount/ca.crt
        insecure_skip_verify: true
      bearer_token_file: /var/run/secrets/kubernetes.io/serviceaccount/token
      relabel_configs:
        - source_labels:
            [
              __meta_kubernetes_namespace,
              __meta_kubernetes_service_name,
              __meta_kubernetes_endpoint_port_name,
            ]
          action: keep
          regex: default;kubernetes;https

    - job_name: "endpoints"
      kubernetes_sd_configs:
        - role: endpoints
      relabel_configs:
        # 保留 Service 的注解为 prometheus.io/scrape: true 的 Endpoints
        - source_labels: [__meta_kubernetes_service_annotation_prometheus_io_scrape]
          action: keep
          regex: true
        # 指标接口协议通过 prometheus.io/scheme 这个注解获取 http 或 https
        - source_labels: [__meta_kubernetes_service_annotation_prometheus_io_scheme]
          action: replace
          target_label: __scheme__
          regex: (https?)
        # 指标接口端点路径通过 prometheus.io/path 这个注解获取
        - source_labels: [__meta_kubernetes_service_annotation_prometheus_io_path]
          action: replace
          target_label: __metrics_path__
          regex: (.+)
        # 直接接口地址端口通过 prometheus.io/port 注解获取
        - source_labels:
            [__address__, __meta_kubernetes_service_annotation_prometheus_io_port]
          action: replace
          target_label: __address__
          regex: ([^:]+)(?::\d+)?;(\d+) # RE2 正则规则,+是一次或多次,?是0次或1次,其中?:表示非匹配组(意思就是不获取匹配结果)
          replacement: $1:$2
        # 映射 Service 的 Label 标签
        - action: labelmap
          regex: __meta_kubernetes_service_label_(.+)
        # 将 namespace 映射成标签
        - source_labels: [__meta_kubernetes_namespace]
          action: replace
          target_label: kubernetes_namespace
        # 将 Service 名称映射成标签
        - source_labels: [__meta_kubernetes_service_name]
          action: replace
          target_label: kubernetes_name
        # 将 Pod 名称映射成标签
        - source_labels: [__meta_kubernetes_pod_name]
          action: replace
          target_label: kubernetes_pod_name
kind: ConfigMap
metadata:
  annotations:
    kubectl.kubernetes.io/last-applied-configuration: |
      {"apiVersion":"v1","data":{"prometheus.yml":"global:\n  scrape_interval: 15s\n  scrape_timeout: 15s\n\nscrape_configs:\n- job_name: 'prometheus'\n  static_configs:\n  - targets: ['localhost:9090']\n"},"kind":"ConfigMap","metadata":{"annotations":{},"name":"prometheus-config","namespace":"kube-monitor"}}
  creationTimestamp: "2022-08-01T17:32:49Z"
  name: prometheus-config
  namespace: kube-monitor
  resourceVersion: "138044"
  uid: 08f157ef-f1a7-4664-b1db-686b1d6d2ca4

重载Prometheus
[root@kubernetes-master-1 prometheus]# curl -X POST 10.0.0.10:31656/-/reload
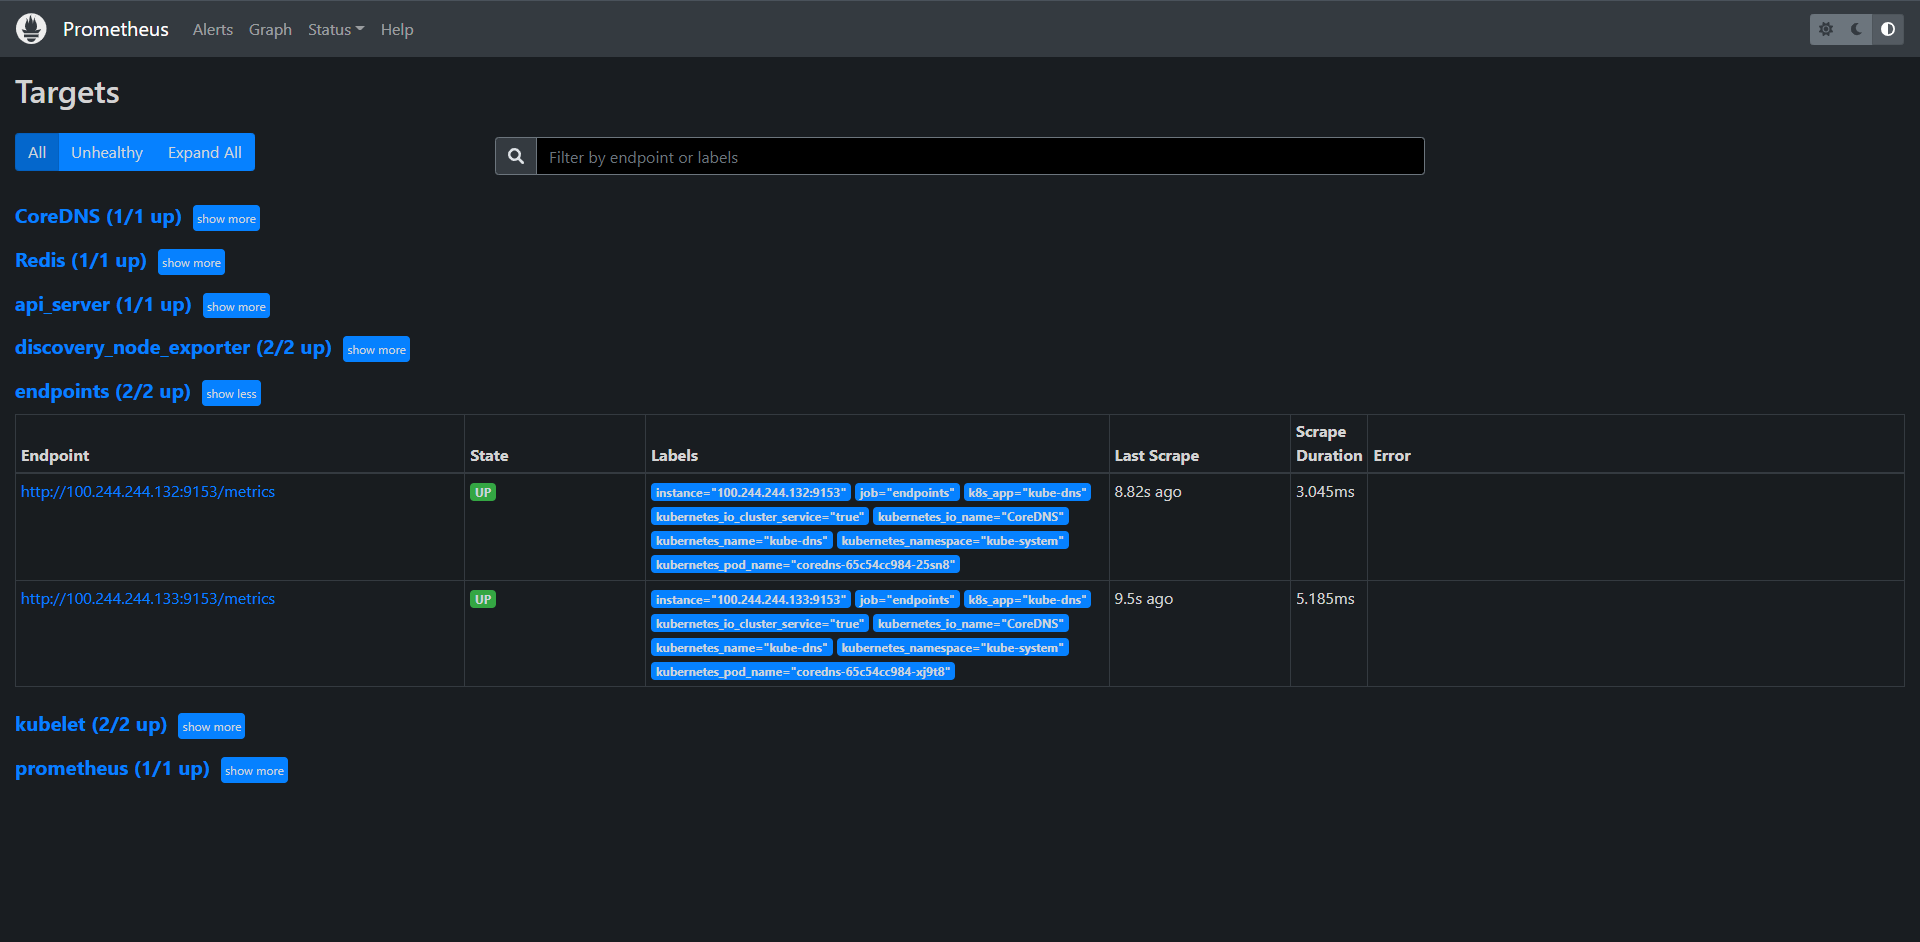
这里其实我们会看到,有这样的一个配置的endpoint已经被发现了,这里其实对应了kube-dns的svc,我们来看一下:

[root@kubernetes-master-1 prometheus]# kubectl get svc -n kube-system kube-dns -o yaml
apiVersion: v1
kind: Service
metadata:
  annotations:
    prometheus.io/port: "9153"        # 可以看到这里其实已经定义了注解
    prometheus.io/scrape: "true"      # 可以看到这里其实已经定义了注解
  creationTimestamp: "2022-06-16T18:19:44Z"
  labels:
    k8s-app: kube-dns
    kubernetes.io/cluster-service: "true"
    kubernetes.io/name: CoreDNS
  name: kube-dns
  namespace: kube-system
  resourceVersion: "247"
  uid: f37c144c-b843-4fb8-a425-6c961ffbf6f3
spec:
  clusterIP: 200.96.0.10
  clusterIPs:
  - 200.96.0.10
  internalTrafficPolicy: Cluster
  ipFamilies:
  - IPv4
  ipFamilyPolicy: SingleStack
  ports:
  - name: dns
    port: 53
    protocol: UDP
    targetPort: 53
  - name: dns-tcp
    port: 53
    protocol: TCP
    targetPort: 53
  - name: metrics
    port: 9153
    protocol: TCP
    targetPort: 9153
  selector:
    k8s-app: kube-dns
  sessionAffinity: None
  type: ClusterIP
status:
  loadBalancer: {}


这个时候我们其实也可以把Redis加进来看一下:

kind: Service
apiVersion: v1
metadata:
  annotations:
    prometheus.io/port: "9121"
    prometheus.io/scrape: "true"
  name: redis
  namespace: kube-monitor
  labels:
    app: redis
spec:
  type: ClusterIP
  selector:
    app: redis
  ports:
    - name: redis
      port: 6379
      targetPort: 6379
    - name: exporter
      port: 9121
      targetPort: 9121

[root@kubernetes-master-1 prometheus]# kubectl apply -f ../redis/redis.yaml
deployment.apps/redis unchanged
service/redis configured
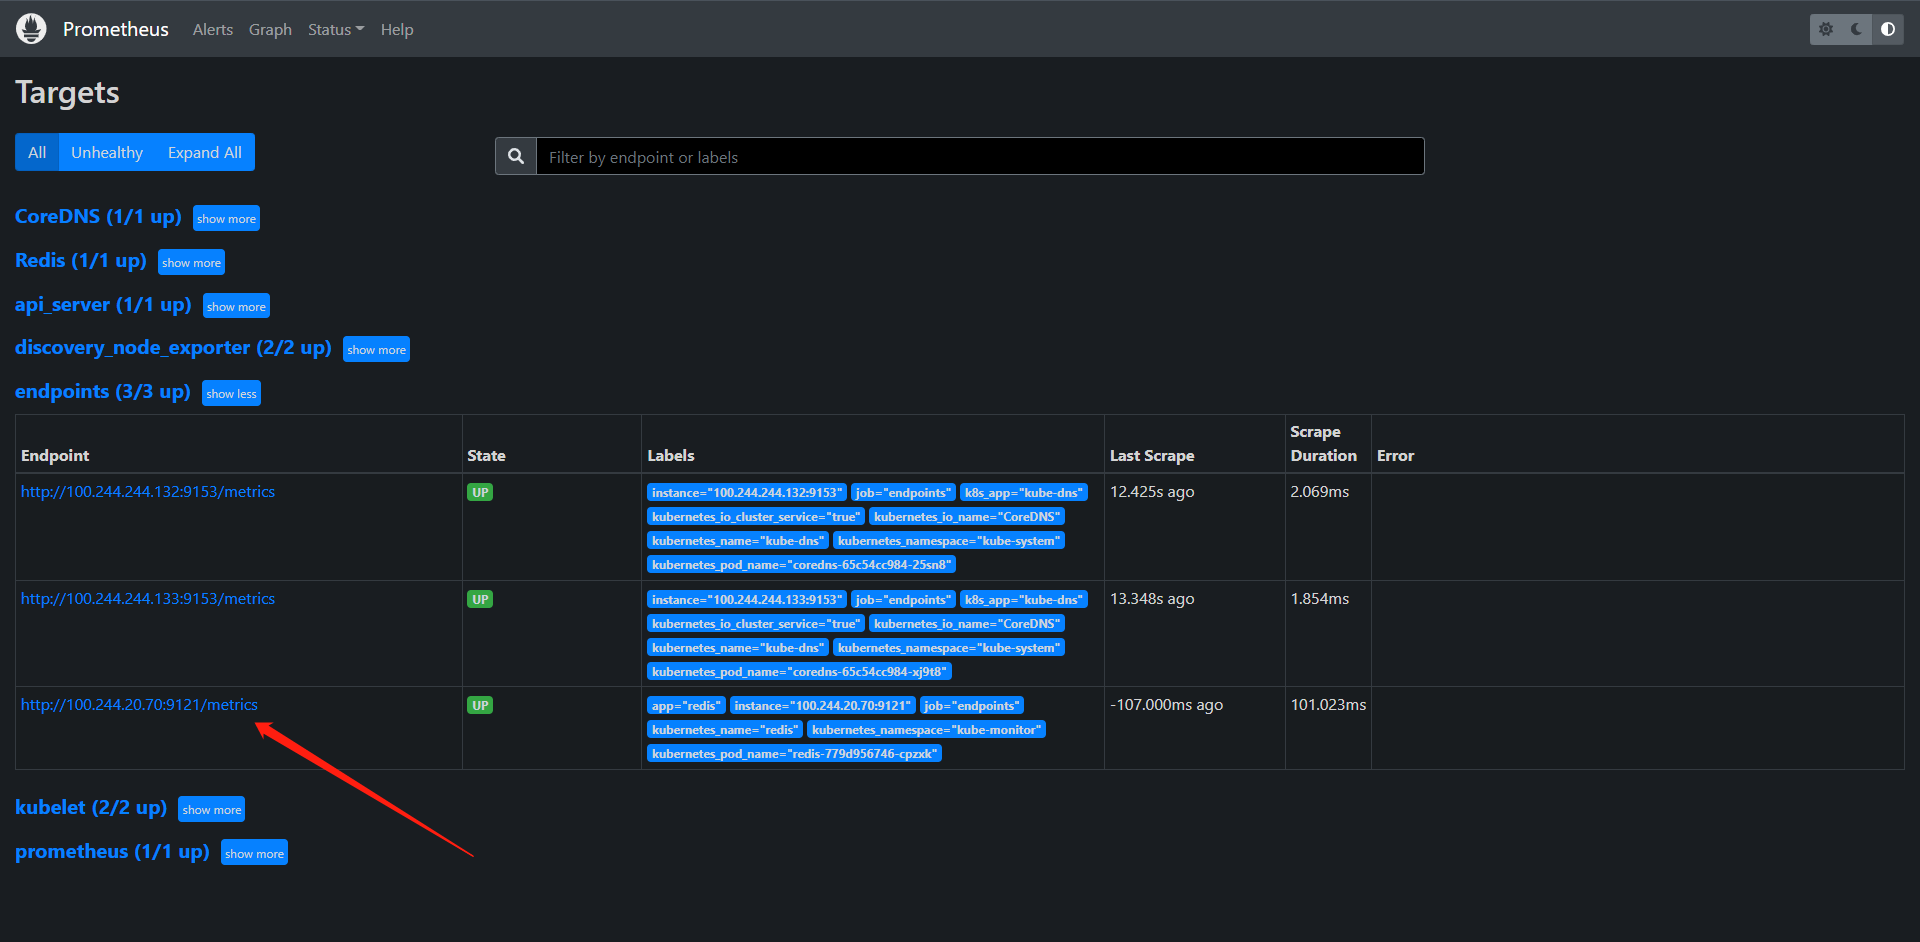
这里可以看到我们的redis的自动发现就被endpoint给发现到了。我们针对此前的配置优化一下

apiVersion: v1
data:
  prometheus.yml: |
    global:
      scrape_interval: 15s
      scrape_timeout: 15s

    scrape_configs:
    - job_name: 'node_exporter'
      kubernetes_sd_configs:
      - role: node
      relabel_configs:
        - source_labels: [__address__]
          regex: "(.*):10250"
          replacement: "${1}:9100"
          target_label: __address__
          action: replace
        - action: labelmap
          regex: __meta_kubernetes_node_label_(.+)

    - job_name: 'kubelet'
      kubernetes_sd_configs:
      - role: node
      scheme: https
      tls_config:
        ca_file: /var/run/secrets/kubernetes.io/serviceaccount/ca.crt
        insecure_skip_verify: true
      bearer_token_file: /var/run/secrets/kubernetes.io/serviceaccount/token
      relabel_configs:
        - action: labelmap
          regex: __meta_kubernetes_node_label_(.+)

    - job_name: 'api_server'
      kubernetes_sd_configs:
      - role: endpoints
      scheme: https
      tls_config:
        ca_file: /var/run/secrets/kubernetes.io/serviceaccount/ca.crt
        insecure_skip_verify: true
      bearer_token_file: /var/run/secrets/kubernetes.io/serviceaccount/token
      relabel_configs:
        - source_labels:
            [
              __meta_kubernetes_namespace,
              __meta_kubernetes_service_name,
              __meta_kubernetes_endpoint_port_name,
            ]
          action: keep
          regex: default;kubernetes;https

    - job_name: "endpoints"
      kubernetes_sd_configs:
        - role: endpoints
      relabel_configs:
        - source_labels: [__meta_kubernetes_service_annotation_prometheus_io_scrape]
          action: keep
          regex: true
        - source_labels: [__meta_kubernetes_service_annotation_prometheus_io_scheme]
          action: replace
          target_label: __scheme__
          regex: (https?)
        - source_labels: [__meta_kubernetes_service_annotation_prometheus_io_path]
          action: replace
          target_label: __metrics_path__
          regex: (.+)
        - source_labels:
            [__address__, __meta_kubernetes_service_annotation_prometheus_io_port]
          action: replace
          target_label: __address__
          regex: ([^:]+)(?::\d+)?;(\d+)
          replacement: $1:$2
        - action: labelmap
          regex: __meta_kubernetes_service_label_(.+)
        - source_labels: [__meta_kubernetes_namespace]
          action: replace
          target_label: kubernetes_namespace
        - source_labels: [__meta_kubernetes_service_name]
          action: replace
          target_label: kubernetes_name
        - source_labels: [__meta_kubernetes_pod_name]
          action: replace
          target_label: kubernetes_pod_name
kind: ConfigMap
metadata:
  annotations:
    kubectl.kubernetes.io/last-applied-configuration: |
      {"apiVersion":"v1","data":{"prometheus.yml":"global:\n  scrape_interval: 15s\n  scrape_timeout: 15s\n\nscrape_configs:\n- job_name: 'prometheus'\n  static_configs:\n  - targets: ['localhost:9090']\n"},"kind":"ConfigMap","metadata":{"annotations":{},"name":"prometheus-config","namespace":"kube-monitor"}}
  creationTimestamp: "2022-08-01T17:32:49Z"
  name: prometheus-config
  namespace: kube-monitor
  resourceVersion: "138044"
  uid: 08f157ef-f1a7-4664-b1db-686b1d6d2ca4

Prometheus也让他走自动化发现

kind: Service
apiVersion: v1
metadata:
  name: prometheus
  namespace: kube-monitor
  annotations:
    prometheus.io/port: "9090"
    prometheus.io/scrape: "true"
  labels:
    app: prometheus
spec:
  selector:
    app: prometheus
  type: NodePort
  ports:
   - name: web
     port: 9090
     targetPort: http

重载Prometheus
[root@kubernetes-master-1 prometheus]# curl -X POST 10.0.0.10:31656/-/reload
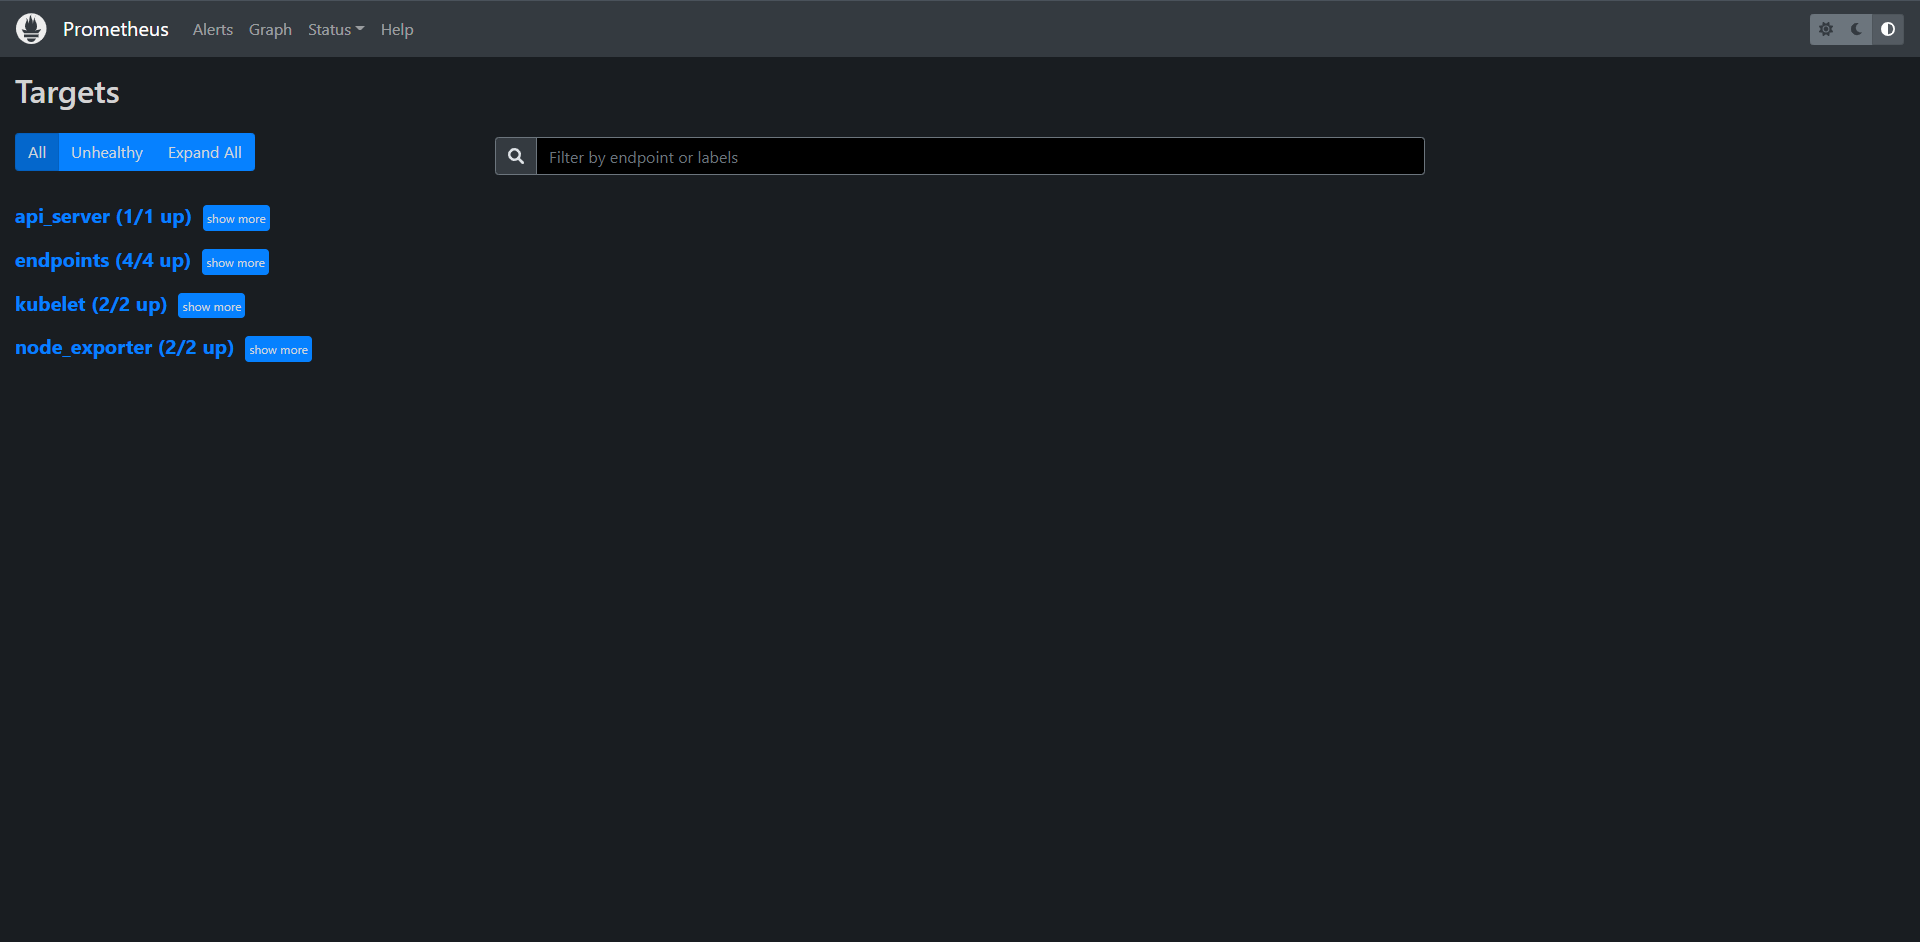
上面就是我们最终部署的结果了,这里推荐一个学习relabel规则的网站:https://relabeler.promlabs.com/
15.4.6:kube-state-metrics
上面我们使用么EndPoints的监控,但是这些监控数据都是应用内部的监控,需要本身提供一个/metrics接口,或者对应的exoirter来暴露指标数据,但是在Kubernetes集群上的Pod,DaemonSet,Deployment,Job,CronJob各种资源对象的状态也需要要监控,这也反映了使用这些资源部署的应用的状态,比如:

1:我调度了多少副本,可用多少副本
2:多个个Pod是running/stopped/terminated状态
3:Pod重启了多少次
4:有多少job在运行

通过查看前面从集群中拉取的指标(这些指标主要来源apiserver和kubelet中集成的,cAdvisor),并没有具体的各种资源对象的指标状态,对于Prometheus来说,当然是需要重新引入新的Exporter来暴露这些指标,Kubernetes提供了一个kube-state-metrics是我们需要的,kube-state-metrics关注于获取kubernetes各个资源的最新状态,如:Deployment,DaemonSet等

安装kube-state-metrics非常的简单,直接Clone代码到集群中不过要注意兼容版本
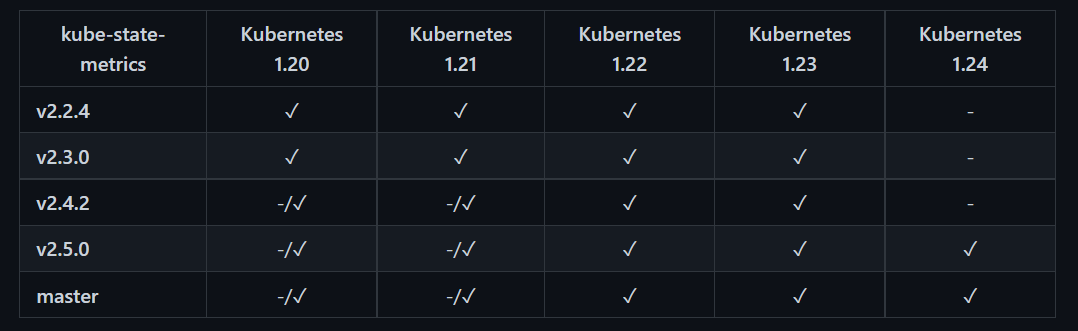
[root@kubernetes-master-1 ~]# git clone https://github.com/kubernetes/kube-state-metrics.git
Cloning into 'kube-state-metrics'...
remote: Enumerating objects: 26688, done.
remote: Counting objects: 100% (11/11), done.
remote: Compressing objects: 100% (7/7), done.
remote: Total 26688 (delta 4), reused 11 (delta 4), pack-reused 26677
Receiving objects: 100% (26688/26688), 20.85 MiB | 1.49 MiB/s, done.
Resolving deltas: 100% (17217/17217), done.
[root@kubernetes-master-1 ~]# cd kube-state-metrics/examples/standard/
[root@kubernetes-master-1 standard]# ls
cluster-role-binding.yaml  cluster-role.yaml  deployment.yaml  service-account.yaml  service.yaml

这里拉取的镜像默认为gcr,这里我用魔法下载了,大家可以用自己的方法比如换成cnych这个仓库,此外我们上面还配置了Prometheus的自动发现,我们也可以为Kube-state-metrics配置上对应的配置。

[root@kubernetes-master-1 standard]# cat service.yaml
apiVersion: v1
kind: Service
metadata:
  labels:
    app.kubernetes.io/component: exporter
    app.kubernetes.io/name: kube-state-metrics
    app.kubernetes.io/version: 2.5.0
  name: kube-state-metrics
  namespace: kube-system
  annotations:
    prometheus.io/port: "8080"
    prometheus.io/scrape: "true"
spec:
  clusterIP: None
  ports:
  - name: http-metrics
    port: 8080
    targetPort: http-metrics
  - name: telemetry
    port: 8081
    targetPort: telemetry
  selector:
    app.kubernetes.io/name: kube-state-metrics

# 整体部署

[root@kubernetes-master-1 standard]# kubectl apply -f .
clusterrolebinding.rbac.authorization.k8s.io/kube-state-metrics created
clusterrole.rbac.authorization.k8s.io/kube-state-metrics created
deployment.apps/kube-state-metrics created
serviceaccount/kube-state-metrics created
service/kube-state-metrics created


[root@kubernetes-master-1 standard]# kubectl get pod -n kube-system | grep kube-state-metrics
kube-state-metrics-5988ff89fb-54fzp           1/1     Running   0             50s
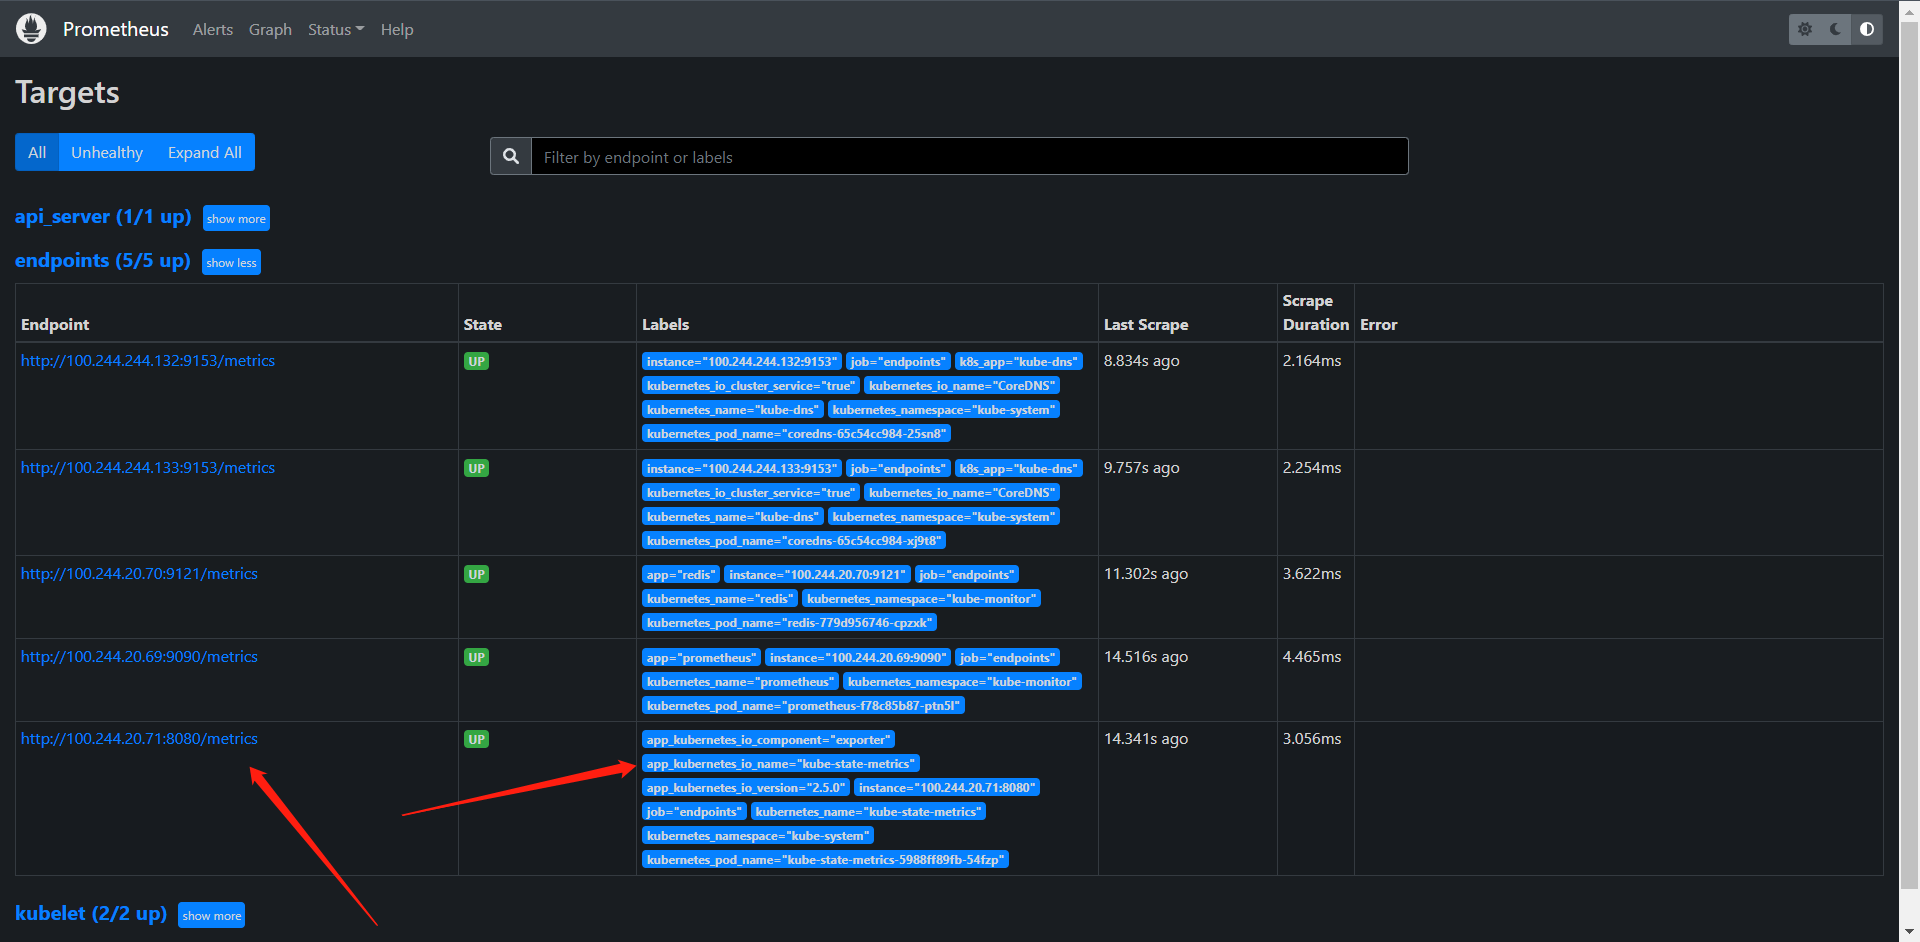
这里也可以看到Prometheus也监控到了kube-state-metrics,然然了还有一个部署方式是autosharding,可以帮助我们自动分片,说白了就是在大集群的情况下可以减轻ETCD的压力和kube-state-metrics的API的压力,这个部署方式还是谨慎使用,可以说这个功能目前属于测试,说不定后面就没了

使用kube-state-mrtrics的一些个场景:

1:集群30分钟内节点状态错误:changes(kube_node_status_condition{condition="Ready",status != "true"}[30m]) > 0
2:集群30分钟内存在启动失败的Pod:changes(kube_pod_status_phase{phase=~"Failed|Unknow"}[30m]) > 0
3:最近30分钟内有Pod重启:changes(kube_pod_container_status_restarts_total[30m]) > 0

下面是我们应用各个资源监控的地址:
https://github.com/kubernetes/kube-state-metrics/tree/v2.5.0/docs
16:Grafana
前面我们使用Prometheus采集了Kubernetes集群中的一些数据指标,我们可以自己尝试使用PromQL语句查询数据,但是为了更好的展示我们的数据,我们可以利用前面学习到的Grafana的知识接入Prometheus

我这里选择使用了grafana/grafana:8.5.0

[root@kubernetes-master-1 grafana]# cat deploy.yaml
kind: Deployment
apiVersion: apps/v1
metadata:
  name: grafana
  namespace: kube-monitor
  labels:
    app: grafana
spec:
  selector:
    matchLabels:
      app: grafana
  template:
    metadata:
      labels:
        app: grafana
    spec:
      volumes:
        - name: storage
          persistentVolumeClaim:
            claimName: grafana-data
      initContainers:
        - name: fix-permissions
          image: busybox
          command: [chown, -R, "472:472", "/var/lib/grafana"]
          volumeMounts:
            - mountPath: /var/lib/grafana
              name: storage
      containers:
        - name: grafana
          image: grafana/grafana:8.5.0
          ports:
            - containerPort: 3000
              name: grafana
          env:
            - name: GF_SECURITY_ADMIN_USER
              value: admin
            - name: GF_SECURITY_ADMIN_PASSWORD
              value: admin123
          readinessProbe:
            failureThreshold: 10
            httpGet:
              path: /api/health
              port: 3000
              scheme: HTTP
            initialDelaySeconds: 60
            periodSeconds: 10
            successThreshold: 1
            timeoutSeconds: 30
          livenessProbe:
            failureThreshold: 10
            httpGet:
              path: /api/health
              port: 3000
              scheme: HTTP
            periodSeconds: 10
            successThreshold: 1
            timeoutSeconds: 1
          resources:
            limits:
              cpu: 150m
              memory: 512Mi
            requests:
              cpu: 150m
              memory: 512Mi
          volumeMounts:
            - mountPath: /var/lib/grafana
              name: storage
---
kind: Service
apiVersion: v1
metadata:
  name: grafana
  namespace: kube-monitor
spec:
  type: NodePort
  ports:
    - name: http
      port: 3000
      targetPort: grafana
  selector:
    app: grafana
---
kind: PersistentVolume
apiVersion: v1
metadata:
  name: grafana-local
  labels:
    app: grafana
spec:
  accessModes:
    - ReadWriteOnce
  capacity:
    storage: 10Gi
  storageClassName: local-storage
  local:
    path: /data/grafana
  persistentVolumeReclaimPolicy: Retain
  nodeAffinity:
    required:
      nodeSelectorTerms:
        - matchExpressions:
            - key: kubernetes.io/hostname
              operator: In
              values:
                - kubernetes-worker-1
---
kind: PersistentVolumeClaim
apiVersion: v1
metadata:
  name: grafana-data
  namespace: kube-monitor
spec:
  selector:
    matchLabels:
      app: grafana
  accessModes:
    - ReadWriteOnce
  resources:
    requests:
      storage: 10Gi
  storageClassName: local-storage

[root@kubernetes-master-1 grafana]# kubectl apply -f deploy.yaml
deployment.apps/grafana created
service/grafana created
persistentvolume/grafana-local created
persistentvolumeclaim/grafana-data created

[root@kubernetes-master-1 grafana]# kubectl get pod -n kube-monitor -l app=grafana
NAME                       READY   STATUS    RESTARTS   AGE
grafana-6ff7c57675-r7pg6   1/1     Running   0          3m20s

[root@kubernetes-master-1 grafana]# kubectl get svc -n kube-monitor
NAME         TYPE        CLUSTER-IP        EXTERNAL-IP   PORT(S)             AGE
grafana      NodePort    200.103.160.113   <none>        3000:30073/TCP      3m40s

我们访问svc试一下
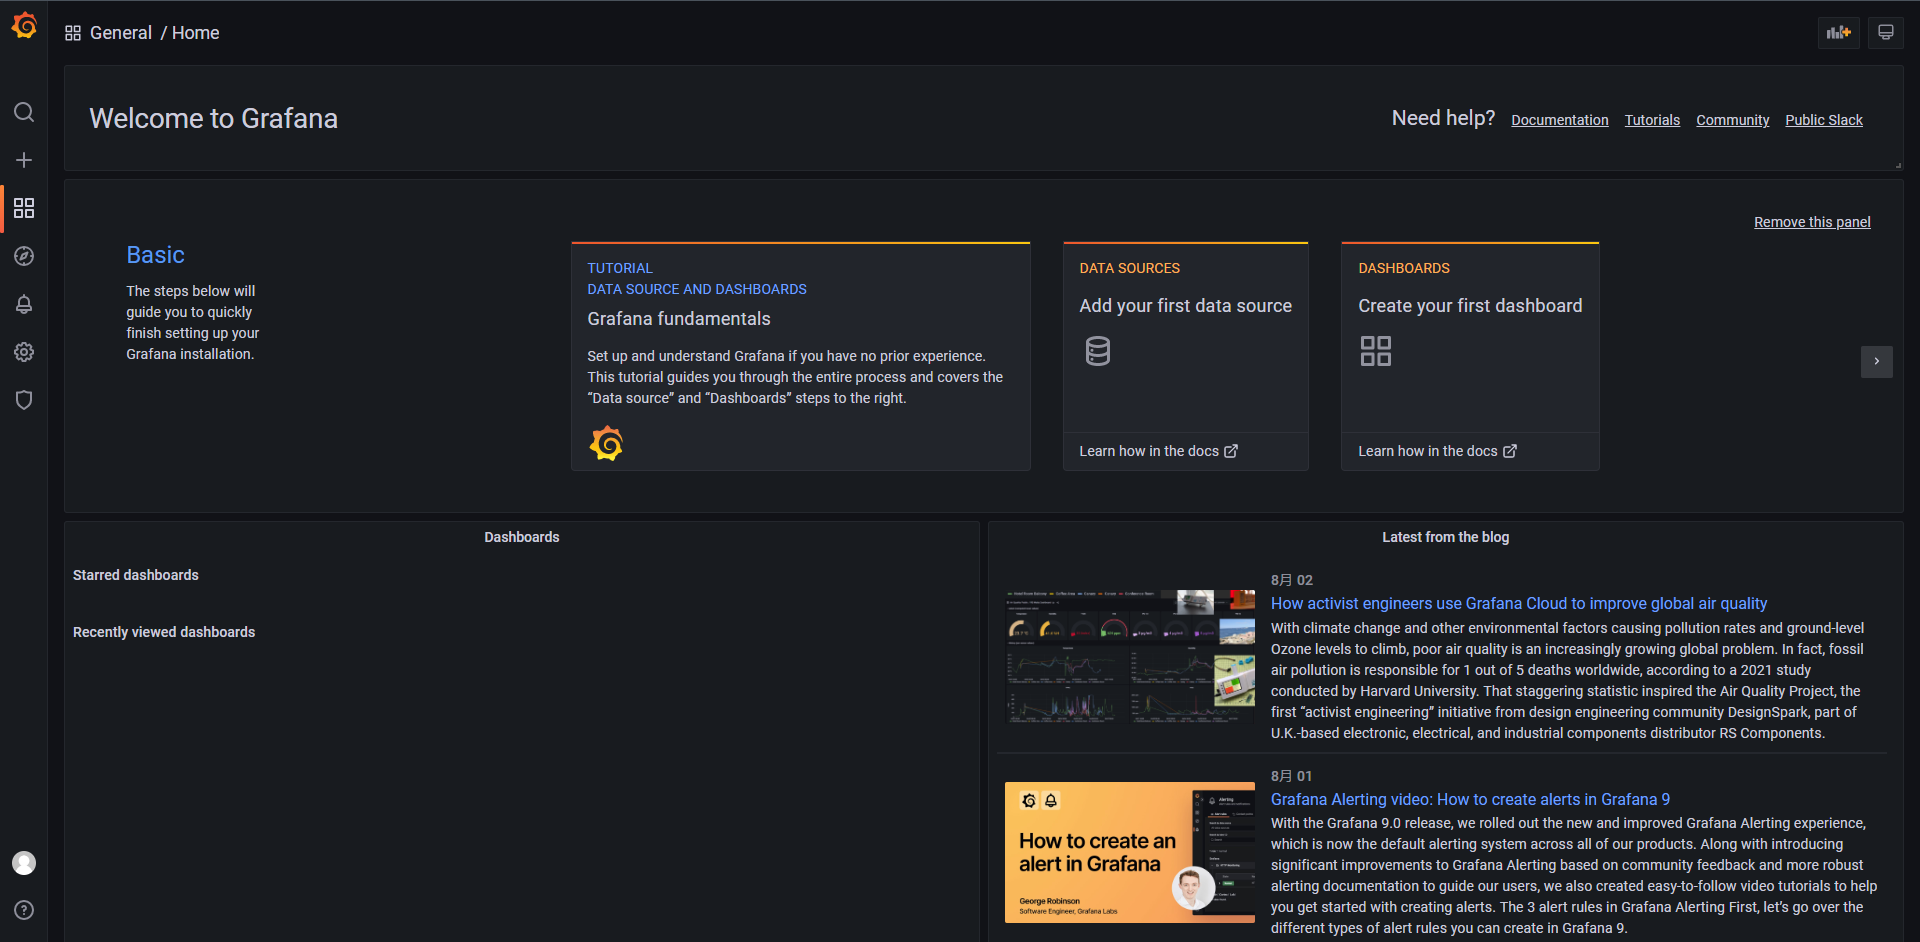
登录进来和我们前面学的Grafana是一摸一样的。
在前面配置过,正常来说是以secrets对象存储的
账号:admin
密码:admin123

下面就是一些个正常操作,添加数据源等
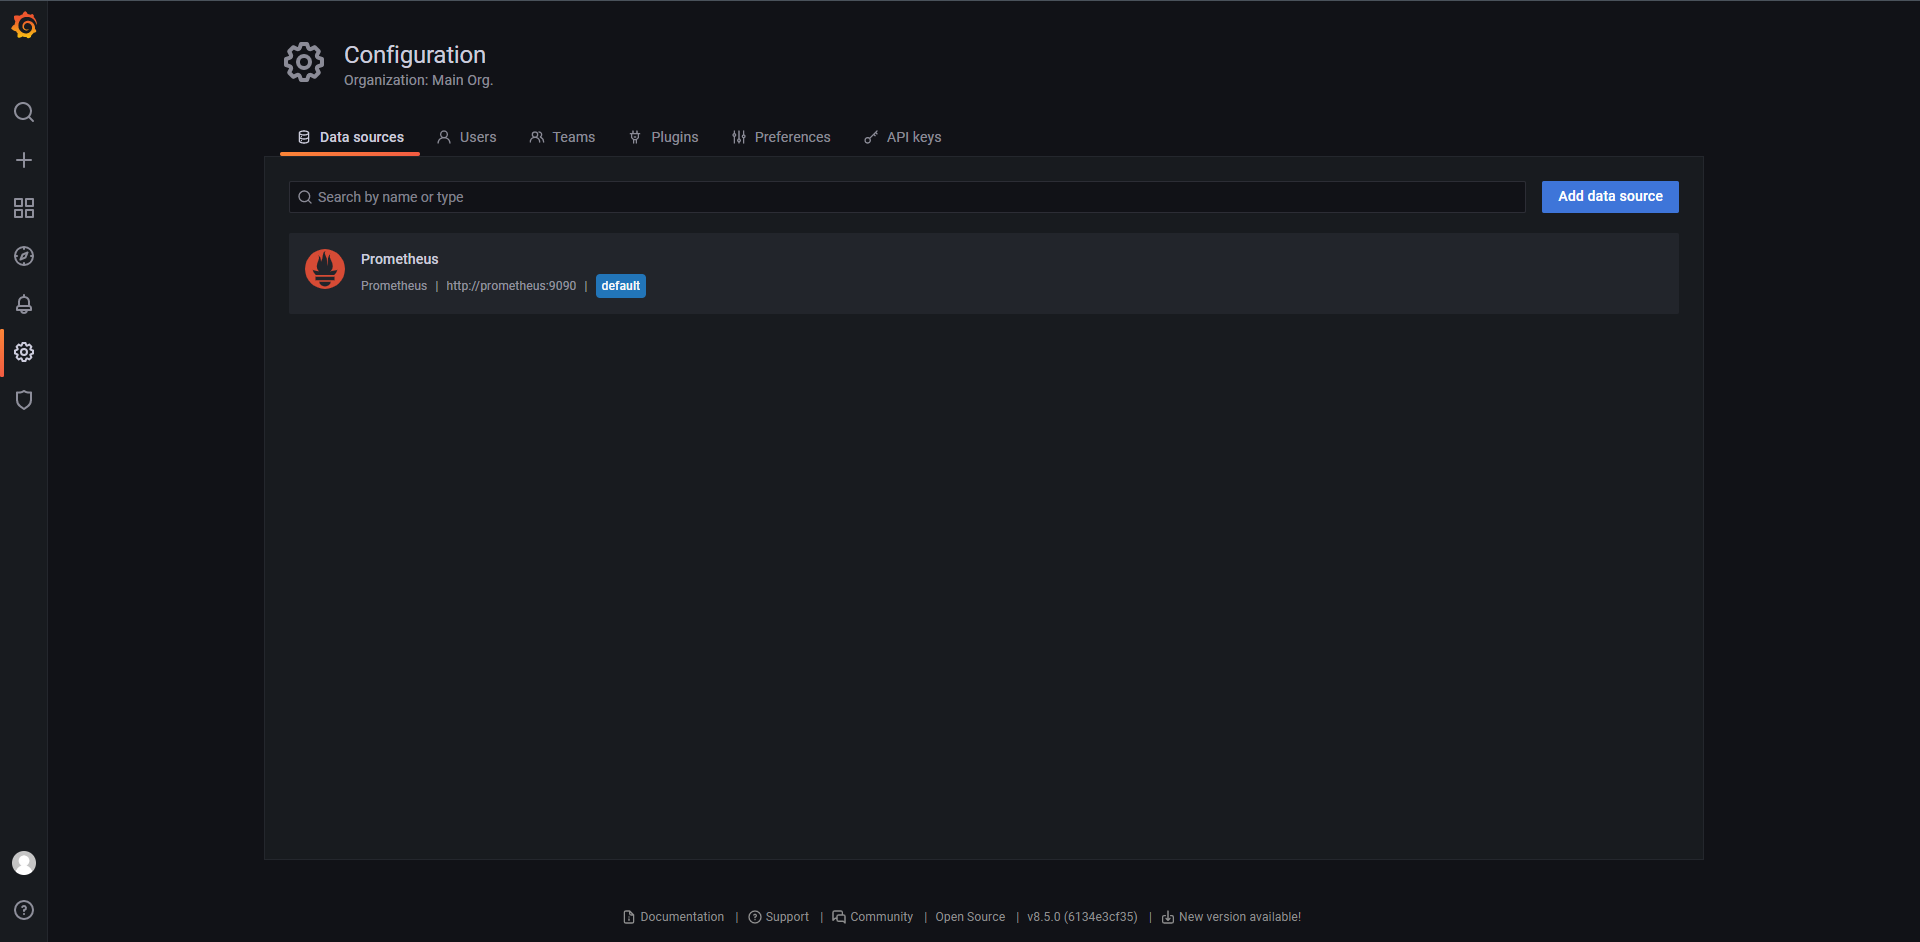
因为都部署在Kubernetes集群上,并且部署在同一个命名空间内,所以可以使用Kubernetes本身的DNS来解析prometheus也就是http://prometheus:9090

其实这个时候主要是给大家引入的一个东西是模板,也就是Grafana官方提供的模板,我们可以引入别人的
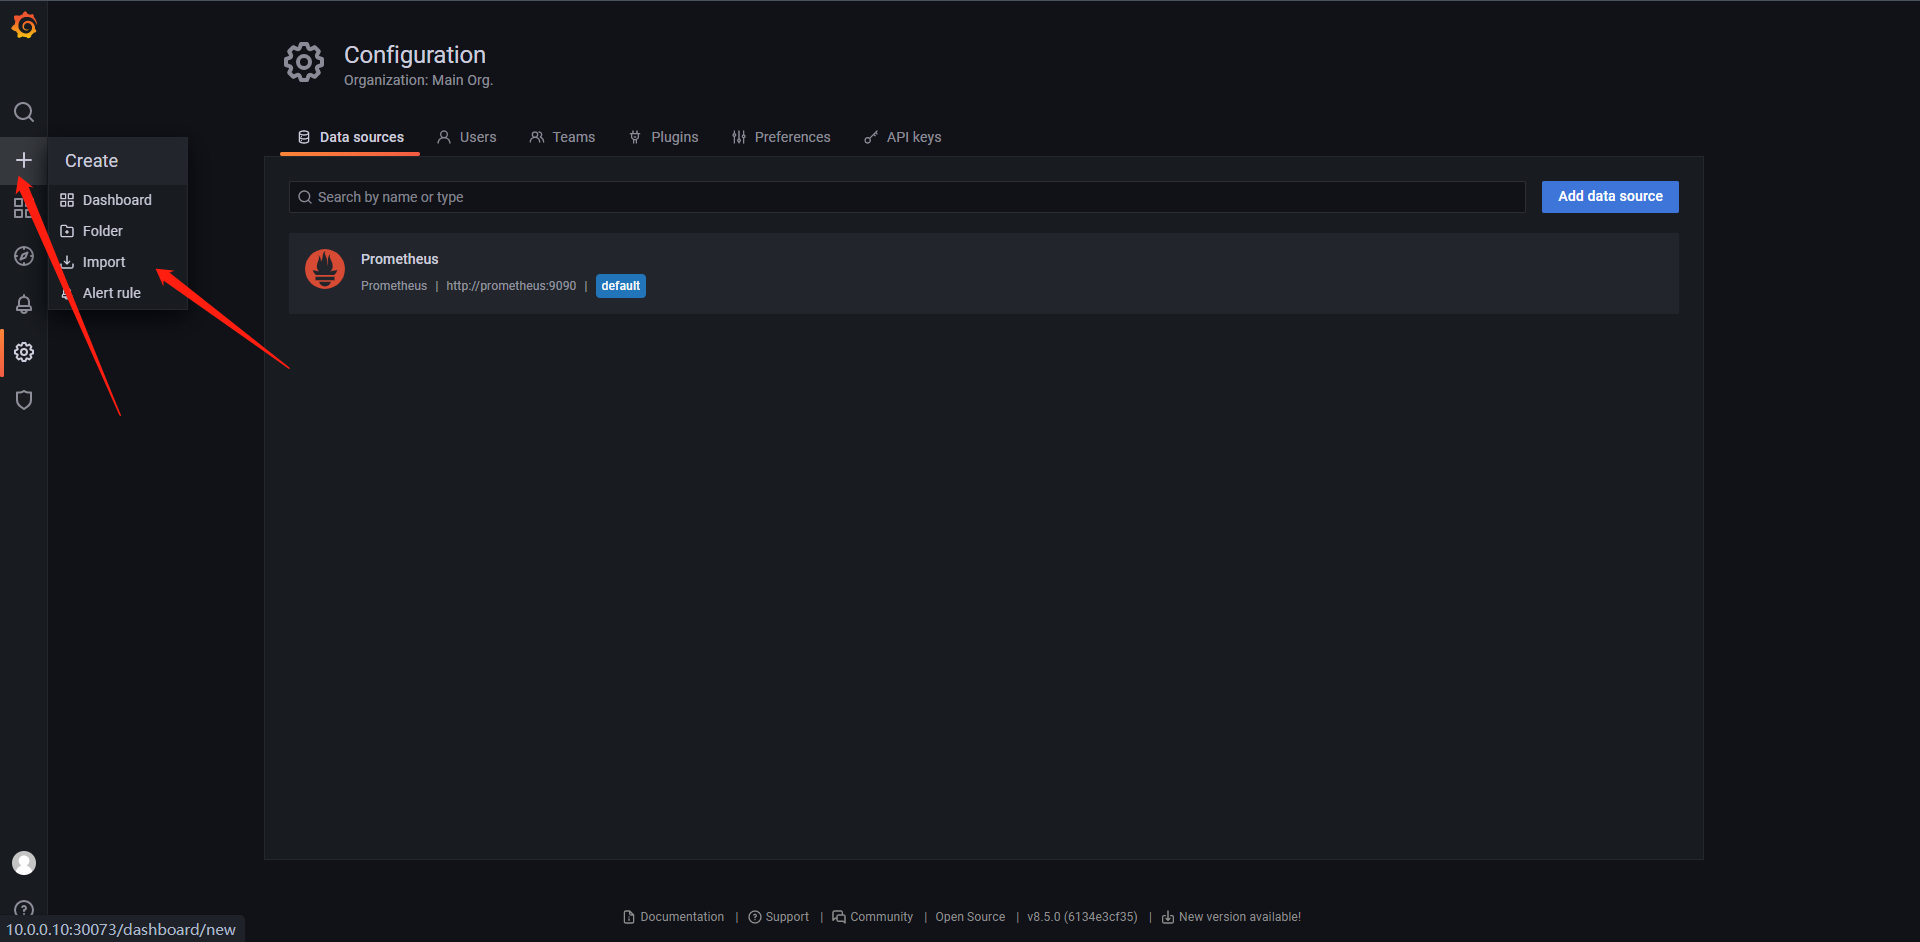
`https://grafana.com/grafana/dashboards/`
可以从上面的网站内找寻我们需要的模板

复制如下代码。然后输入import内的框点击load即可
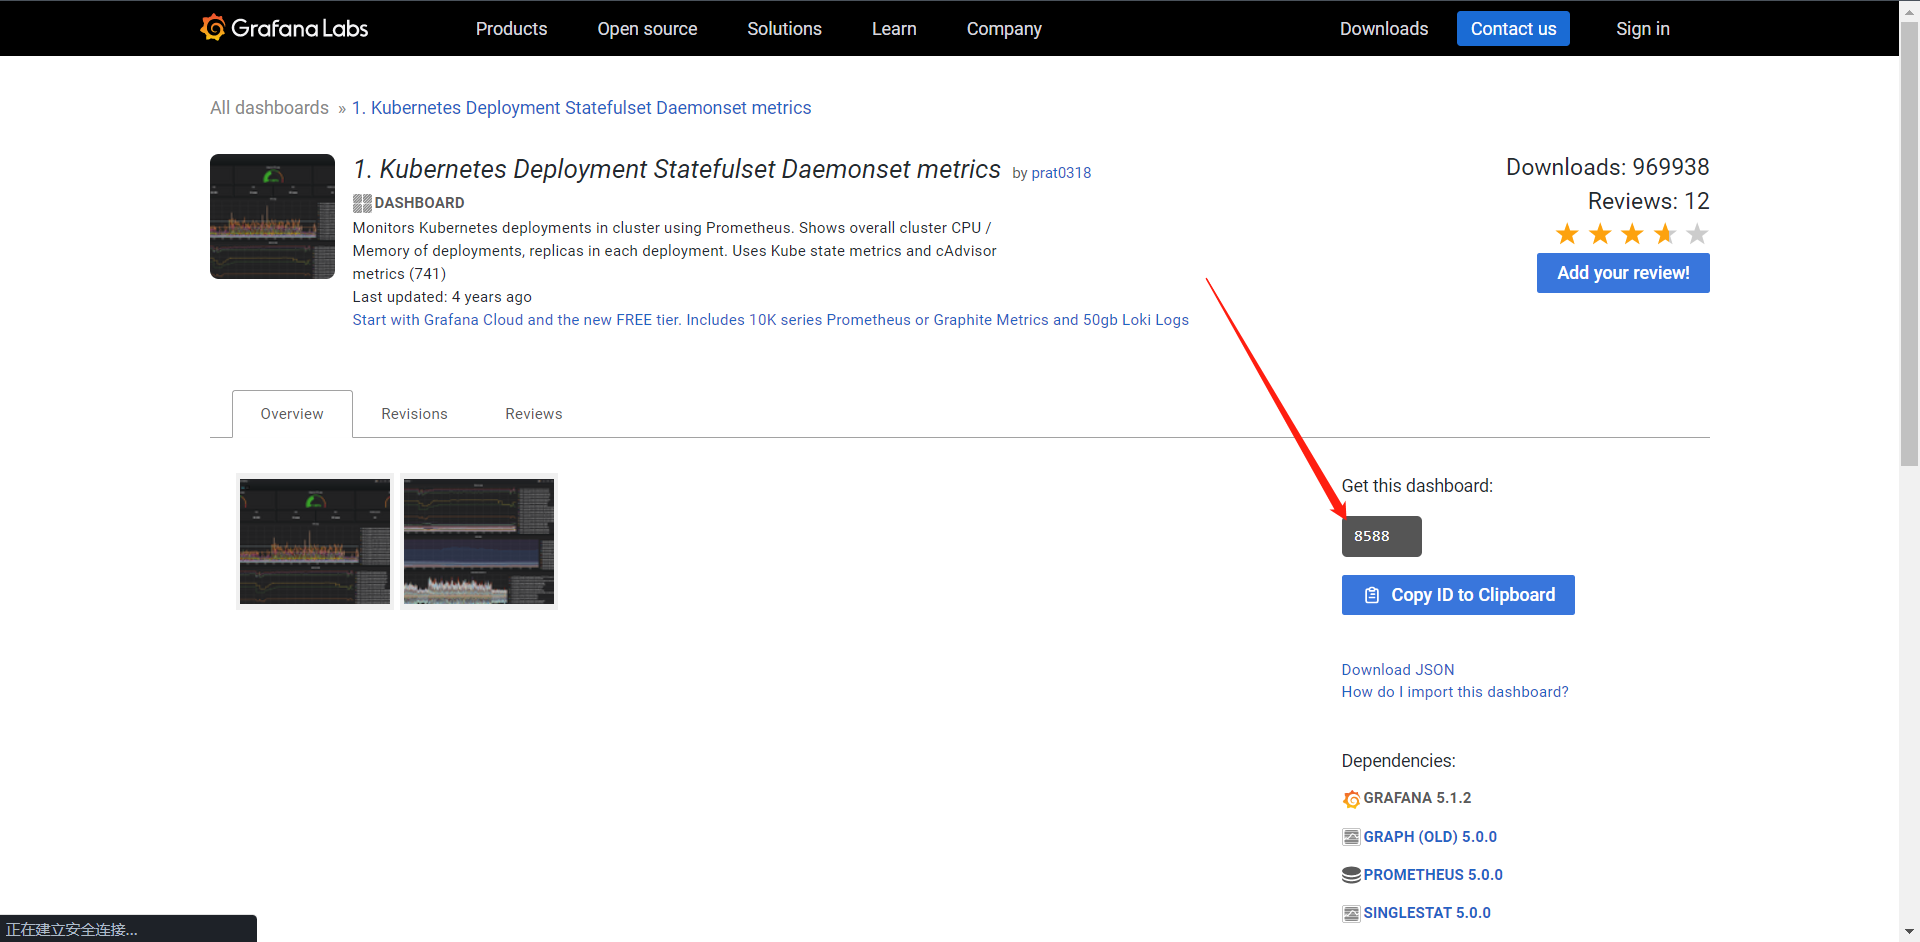
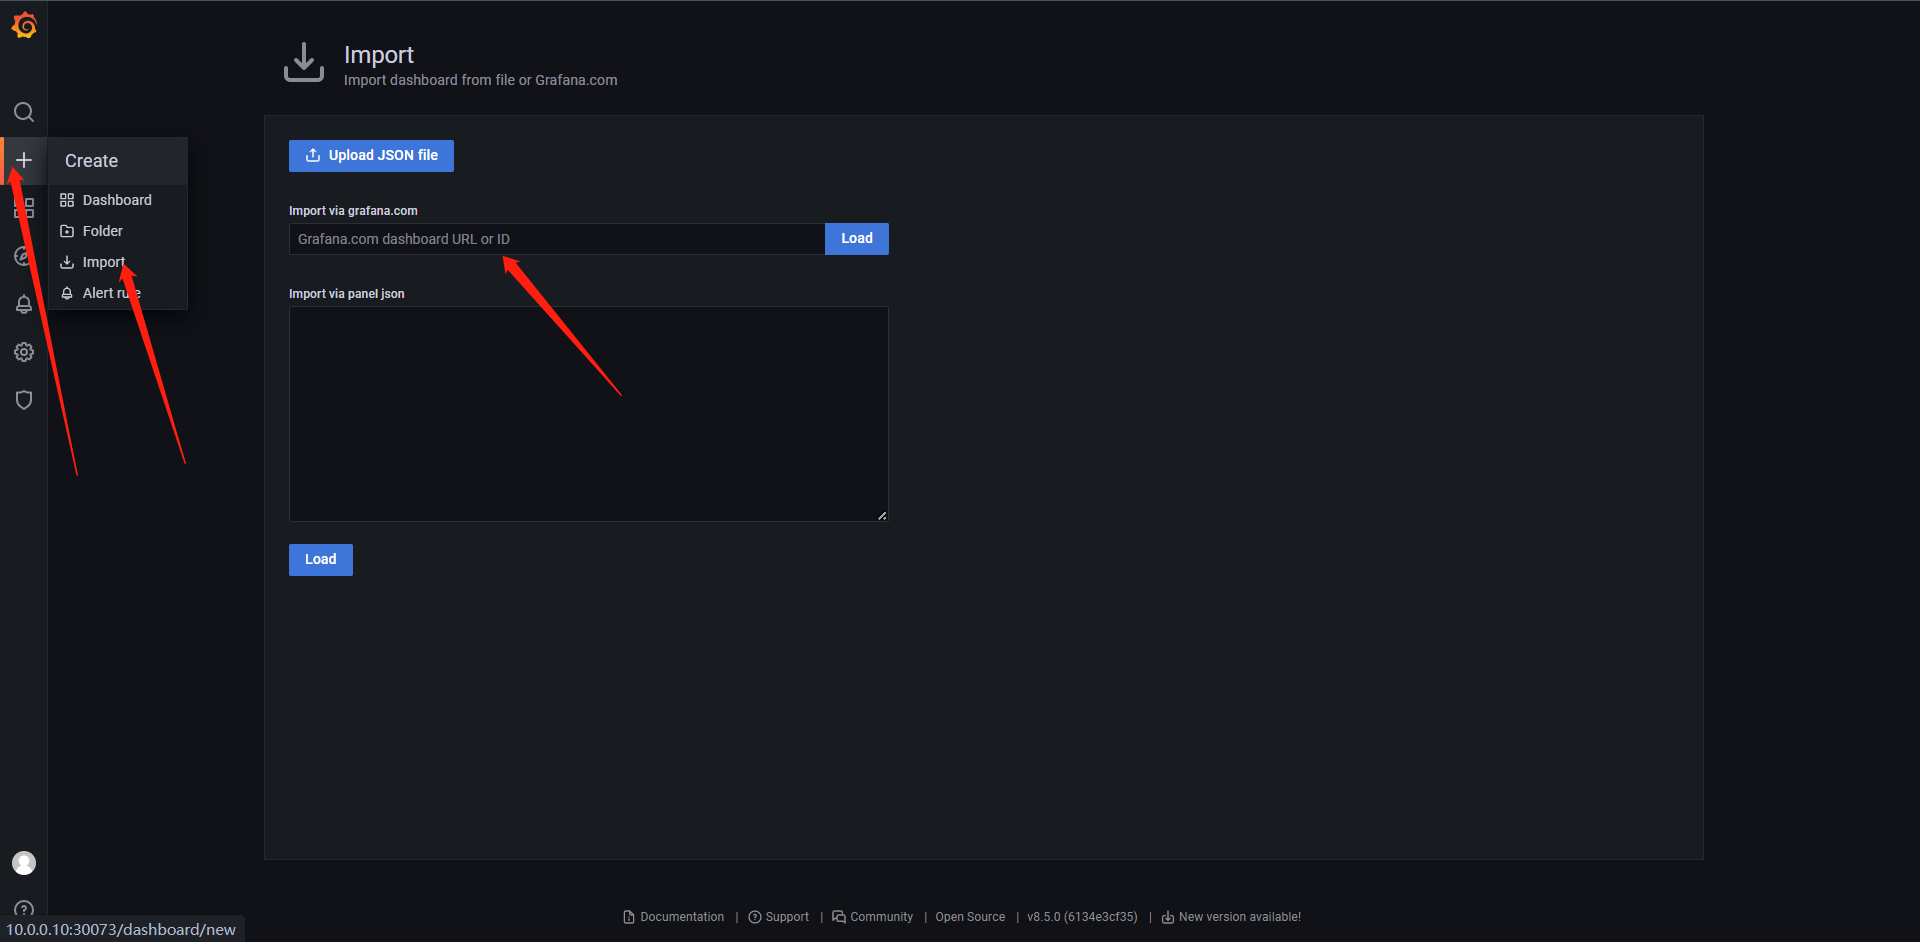
这里面的东西还是主要以自定义为主,因为别人的模板不一定和一的部署的exporter等信息契合,随意这个没有特别的规定如何展示。
17:PushGateway
我们都知道Prometheus采集数据使用的是pull的方式,但是在某些网络下(不在一个子网或者防火墙),Prometheus无法直接拉取监控指标数据,这个时候我们就需要一个和能够主动push的模式了,而PushGateway就是Prometheus生态中来解决这个问题的一个
工具。

但是把PushGateway也不是万能的,其本身也存在一些弊端:

1:将多个节点数据汇聚到pushgateway,如果pushgateway挂了,会收到很大范围的影响。
2:Prometheus拉取状态up只针对pushgateway无法做到对每个目标有效

由于pushgateway可以持久化推送给它所有监控数据,所以即使你的监控已下线,Prometheus还会拉取到旧的监控数据,需要手动清理Pushgateway不要的数据
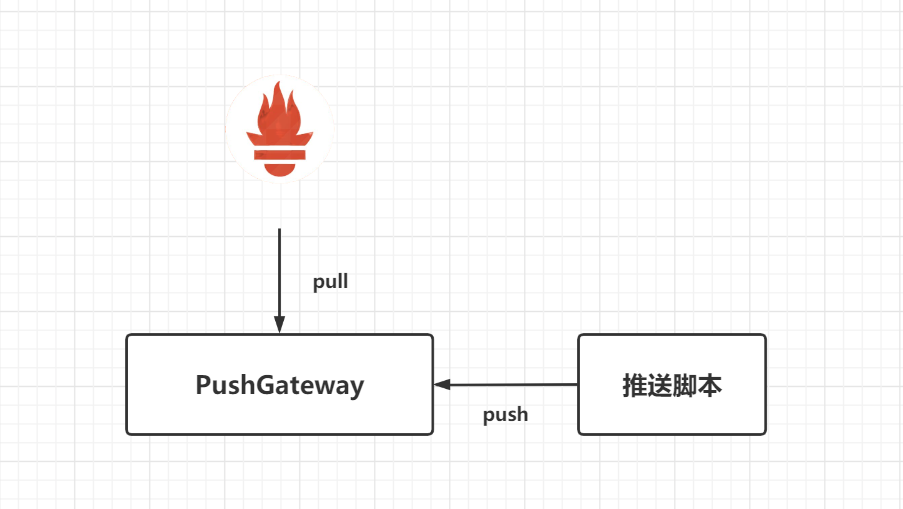
从上图可以看出其实PushGateway就类似于一个存储网关,临时存储数据用,这里我做了一个场景可以看一下。
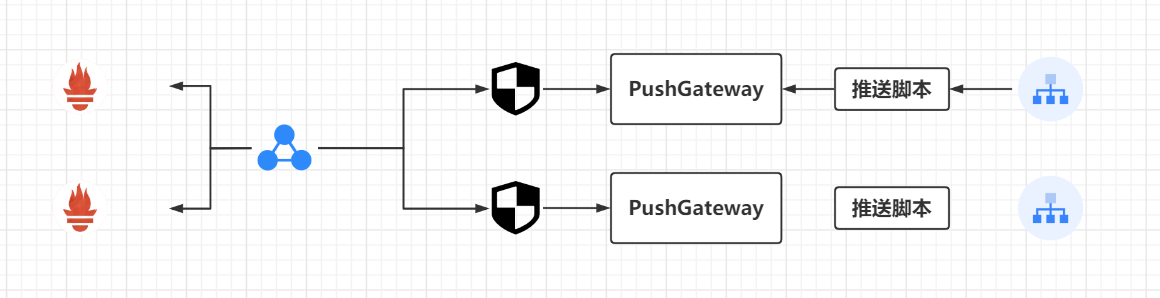
从场景内可以看出,我们著需要在内部部署一个PushGateway然后所有的数据全部推送给它,然后在防火墙使用NAT暴露此服务器即可实现Prometheus的去拉取这个Pushgaway的数据了,这个时候其实我们就不用让Prometheus直接穿过防火墙来一台台的拉取数据了。
17.1:安装
安装方法同样也非常的简单,在官网下载PushGateway对应的包,解压即可使用,因为Prometheus的全部套件都是Go语言编写的,所以不存在任何的依赖,可以通过--web.listen-address指定启动IP和端口如:(0.0.0.0:9091或者:9091),默认情况下Pushgateway不保留指标,但是--persistence.file允许我们指定一个文件,将推送的指标保留在其中,相当于Pushgateway的数据持久化,当PushGateway重启时数据还会保留。

前面我们介绍过node—exporter的textfile收集器,似乎比较类似于Pushgateway,但是二者有区别的:
1:textfile:主要针对的是节点级的指标
2:Pushgateway主要针对的是服务级别的指标。

我这里选择直接Kubernetes部署了

1:创建存储
[root@kubernetes-master-1 pushgateway]# cat localpv.yaml
kind: PersistentVolume
apiVersion: v1
metadata:
  name: pushgateway-local
  labels:
    app: pushgateway
spec:
  accessModes:
    - ReadWriteOnce
  capacity:
    storage: 10Gi
  storageClassName: local-storage
  local:
    path: /data/pushgateway
  persistentVolumeReclaimPolicy: Retain
  nodeAffinity:
    required:
      nodeSelectorTerms:
        - matchExpressions:
            - key: kubernetes.io/hostname
              operator: In
              values:
                - kubernetes-worker-1
---
kind: PersistentVolumeClaim
apiVersion: v1
metadata:
  name: pushgateway-data
  namespace: kube-monitor
spec:
  selector:
    matchLabels:
      app: pushgateway
  accessModes:
    - ReadWriteOnce
  resources:
    requests:
      storage: 10Gi
  storageClassName: local-storage

2:创建Deployment实例
[root@kubernetes-master-1 pushgateway]# cat pushgateway-deploy.yaml
kind: Deployment
apiVersion: apps/v1
metadata:
  name: pushgateway
  namespace: kube-monitor
  labels:
    app: pushgateway
spec:
  selector:
    matchLabels:
      app: pushgateway
  template:
    metadata:
      labels:
        app: pushgateway
    spec:
      volumes:
        - name: data
          persistentVolumeClaim:
            claimName: pushgateway-data
      containers:
        - name: pushgateway
          image: prom/pushgateway:latest
          args:
            - "--persistence.file=/data/metrics_file"    # 这里是使用了这个参数进行数持久化
          ports:
            - containerPort: 9091
              name: http
          volumeMounts:
            - mountPath: /data/
              name: data
          resources:
            requests:
              cpu: 100m
              memory: 500Mi
            limits:
              cpu: 100m
              memory: 500Mi
---
kind: Service
apiVersion: v1
metadata:
  name: pushgateway
  namespace: kube-monitor
  labels:
    app: pushgateway
spec:
  selector:
    app: pushgateway
  type: NodePort
  ports:
    - name: http
      port: 9091
      targetPort: http

部署PVC和Deployment

[root@kubernetes-master-1 pushgateway]# kubectl apply -f .
persistentvolume/pushgateway-local created
persistentvolumeclaim/pushgateway-data created
deployment.apps/pushgateway created
service/pushgateway created


[root@kubernetes-master-1 pushgateway]# kubectl get pod,svc -n kube-monitor -l app=pushgateway
NAME                               READY   STATUS    RESTARTS   AGE
pod/pushgateway-5c77455f67-l5f5z   1/1     Running   0          70s

NAME                  TYPE       CLUSTER-IP        EXTERNAL-IP   PORT(S)          AGE
service/pushgateway   NodePort   200.111.247.227   <none>        9091:30052/TCP   70s

访问节点IP+30052来看一下

17.2:基本使用
Pushgateway的数据推送支持两种方式:Prometheus Client SDK推送和API推送。
17.2.1:Client SDK 推送
Prometheus本身其实支持了多种语言的SDK,可通过SDK的方式生成相关的数据,并推送到Pushgateway,当然了这种方式需要客户端代码支持,这也是官方推荐的方案,目前SDK支持的语言:

1:Go
2:Java or Scala
3:Python
4:Ruby
5:Rust

当然也有许多的第三方库,详情参考:https://prometheus.io/docs/instrumenting/clientlibs

这里我们可以使用Python为例,因为我这里是Python3,所以需要使用pip3 安装一下 prometheus的sdk开发包

PS E:\code\pushgateway> pip3 install prometheus-client -i "https://mirrors.aliyun.com/pypi/simple"

一个简单的SDK如下:

from prometheus_client import CollectorRegistry, Counter, Gauge, push_to_gateway

registry = CollectorRegistry()   # 可以理解为实例化采集器

g = Gauge('container_memory', 'Container memory data', ['node'], registry=registry)
g.labels(node='kubernetes-master-1').inc()
g.labels(node='kubernetes-worker-1').dec()
g.labels(node='kubernetes-worker-2').set(3.1)

c = Counter('requests_total', 'HTTP requests total', ['method', 'endpoint'], registry=registry)
c.labels(method='GET', endpoint='/').inc()
c.labels(method='POST', endpoint='/admin').inc()

push_to_gateway('10.0.0.10:30052', job='k8s-demon-data',registry=registry)

这里其实我模拟了两个数据 一个是Guage一个是Counter,在每个数据的里面都有 registry=registry,这是指明数据属于哪儿个采集器。

我们仅仅需要执行以下这个脚本就可以了

PS E:\code\pushgateway> python .\push.py
然后我们去PushGateway看一下数据是否已经推送上来了。
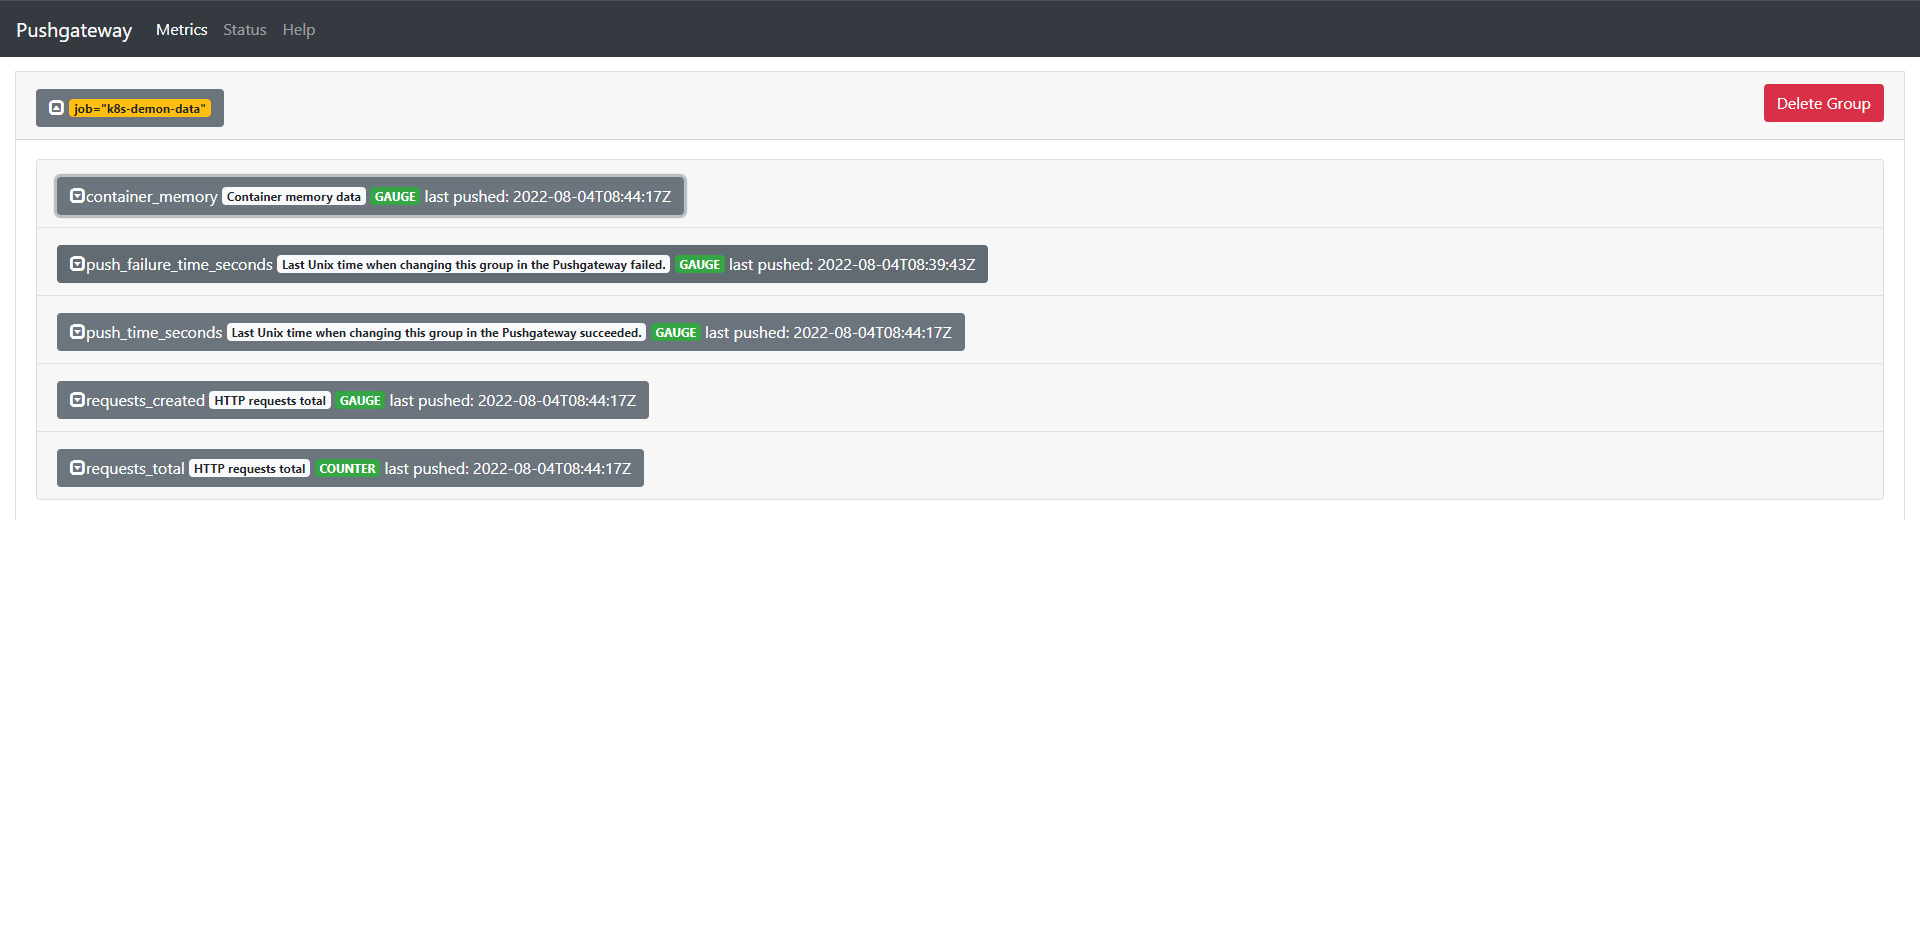
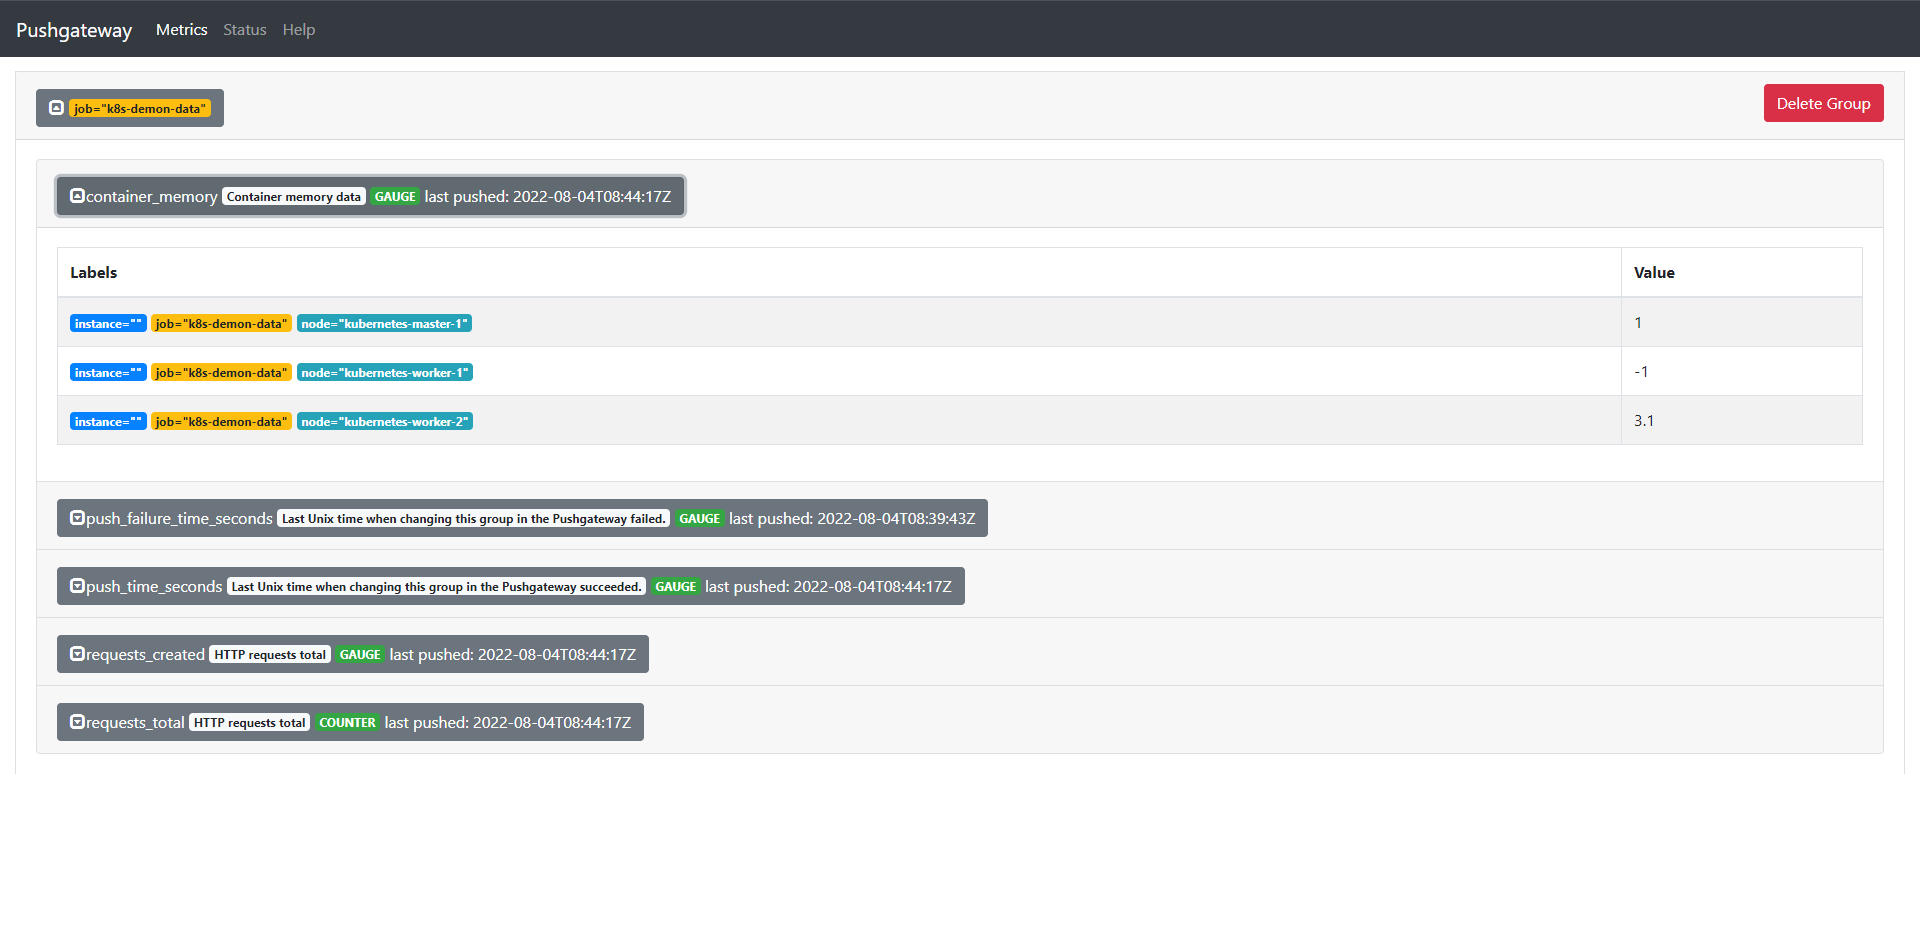
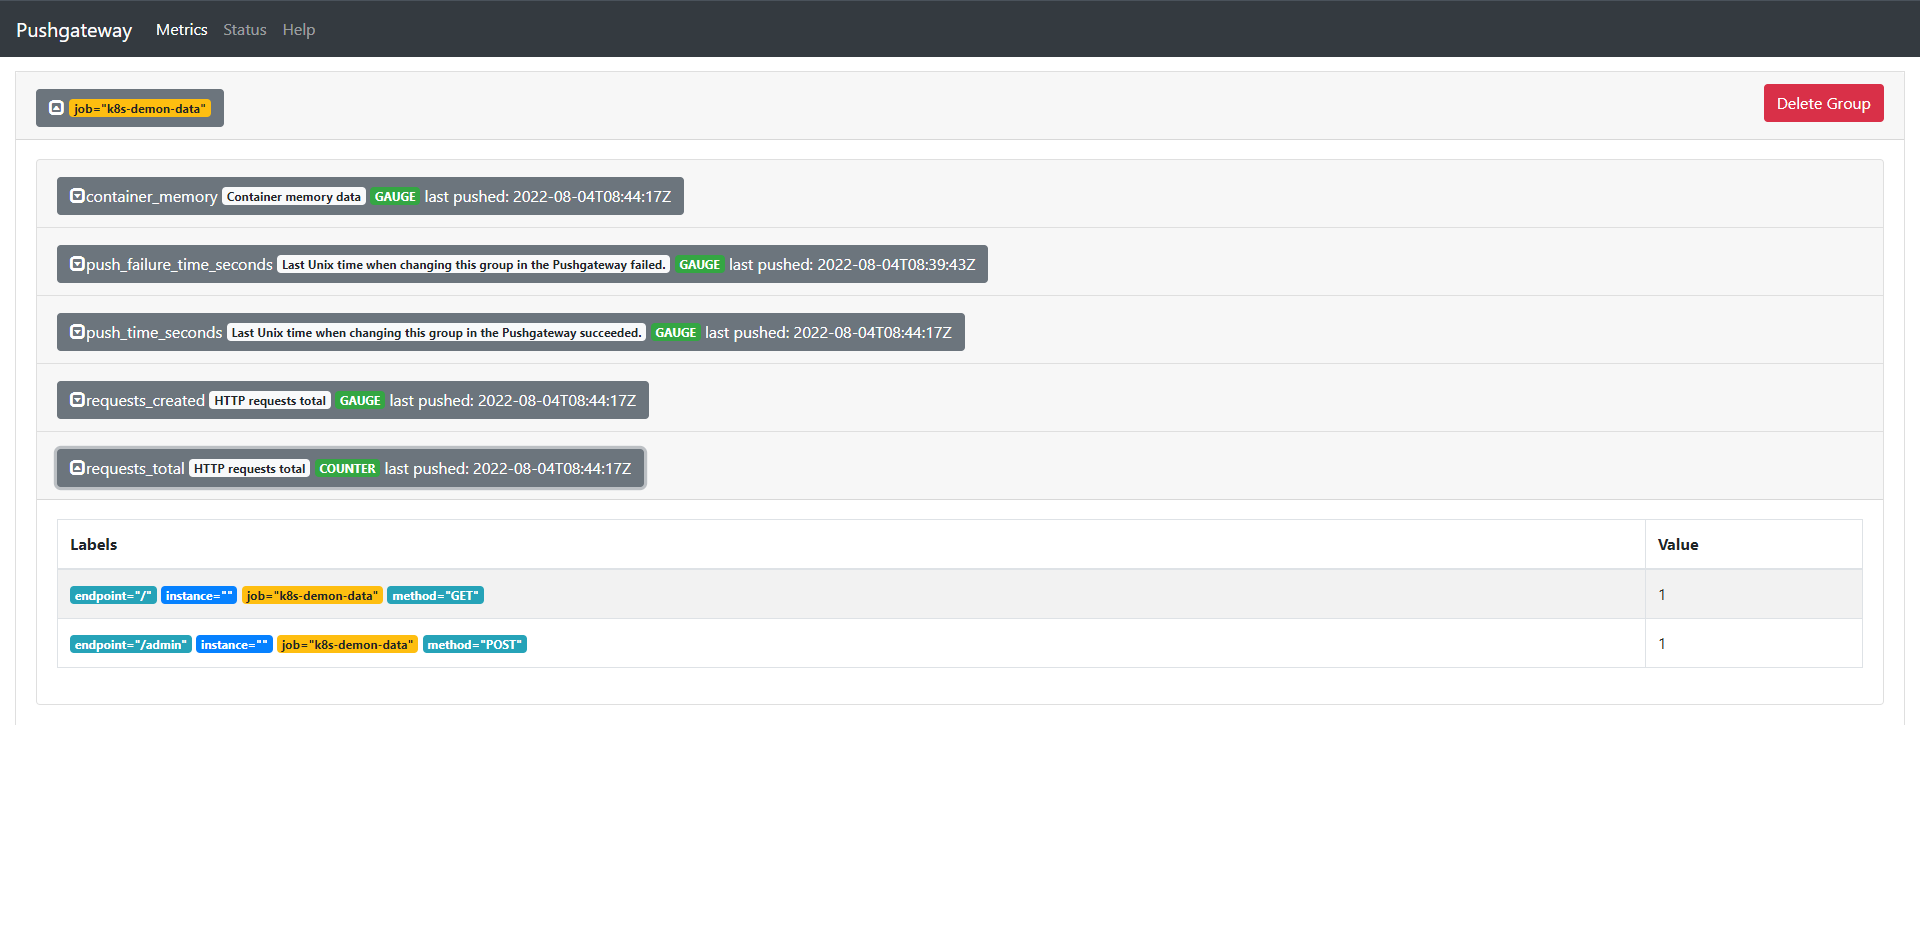
我们发现数据已经被推送上来了。数据也都是我们定义的数据。
17.2.2:API 推送
我们还可以使用Prometheus文本协议推送指标,无需借助单独的CLI,只需要curl之类的工具即可。不过需要注意的是文本中必须包含("LF"或者"\n")来结尾,以其他方式结束一行,例如:"CR" ('r'),'CRLF' ('\r\n')或者只是数据包结尾,将导致协议错误。

推送的指标按照组进行管理,由任意数量的标签组成的分组键识别,其中第一个必须是"job"标签。
比如我们单个推送:

echo "some_metrics 3.14" | curl --data-binary @- http://10.0.0.10:30052/metrics/job/web_requests

这里是将数据样本推送到了job名为web_requests的标识组中
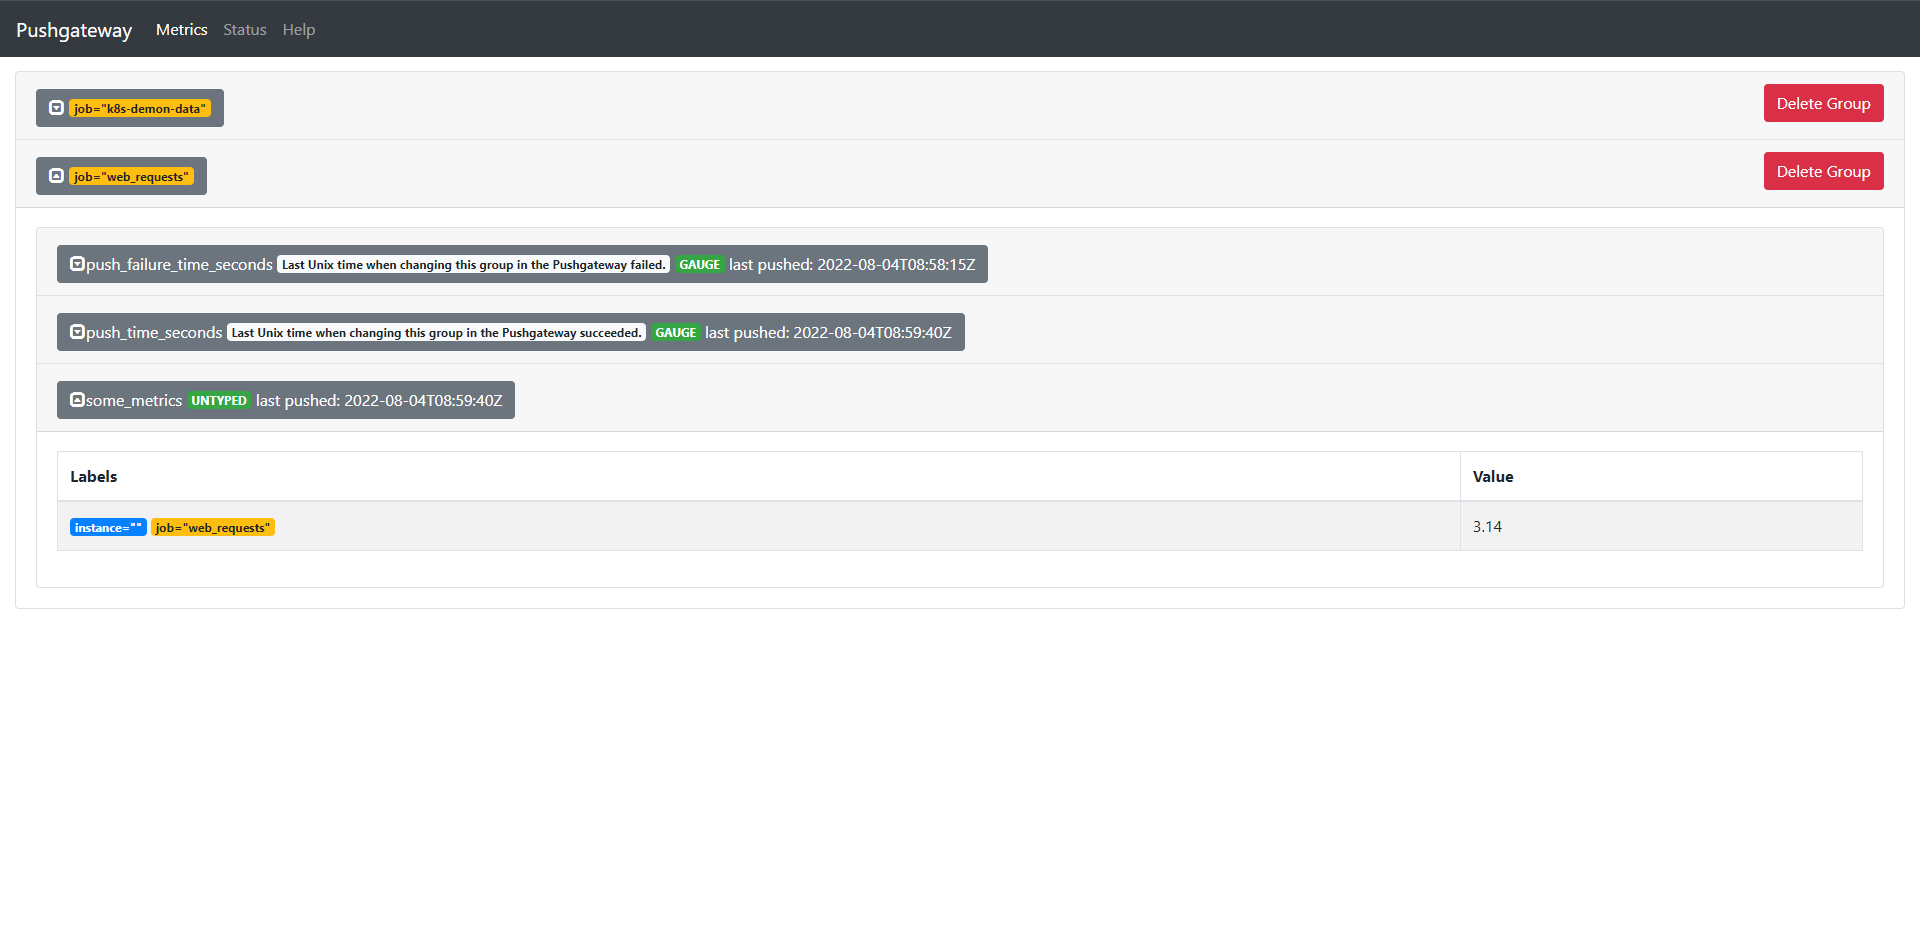
接下来我们推送一个更麻烦点的,
cat <<EOF | curl --data-binary @- http://10.0.0.10:30052/metrics/job/web_requests/instance/web
# TYPE some_metric counter
some_metrics{label="vall"} 22
# TYPE another_metric gauge
# HELP another_metric Just an example.
another_metric 2991.132
EOF
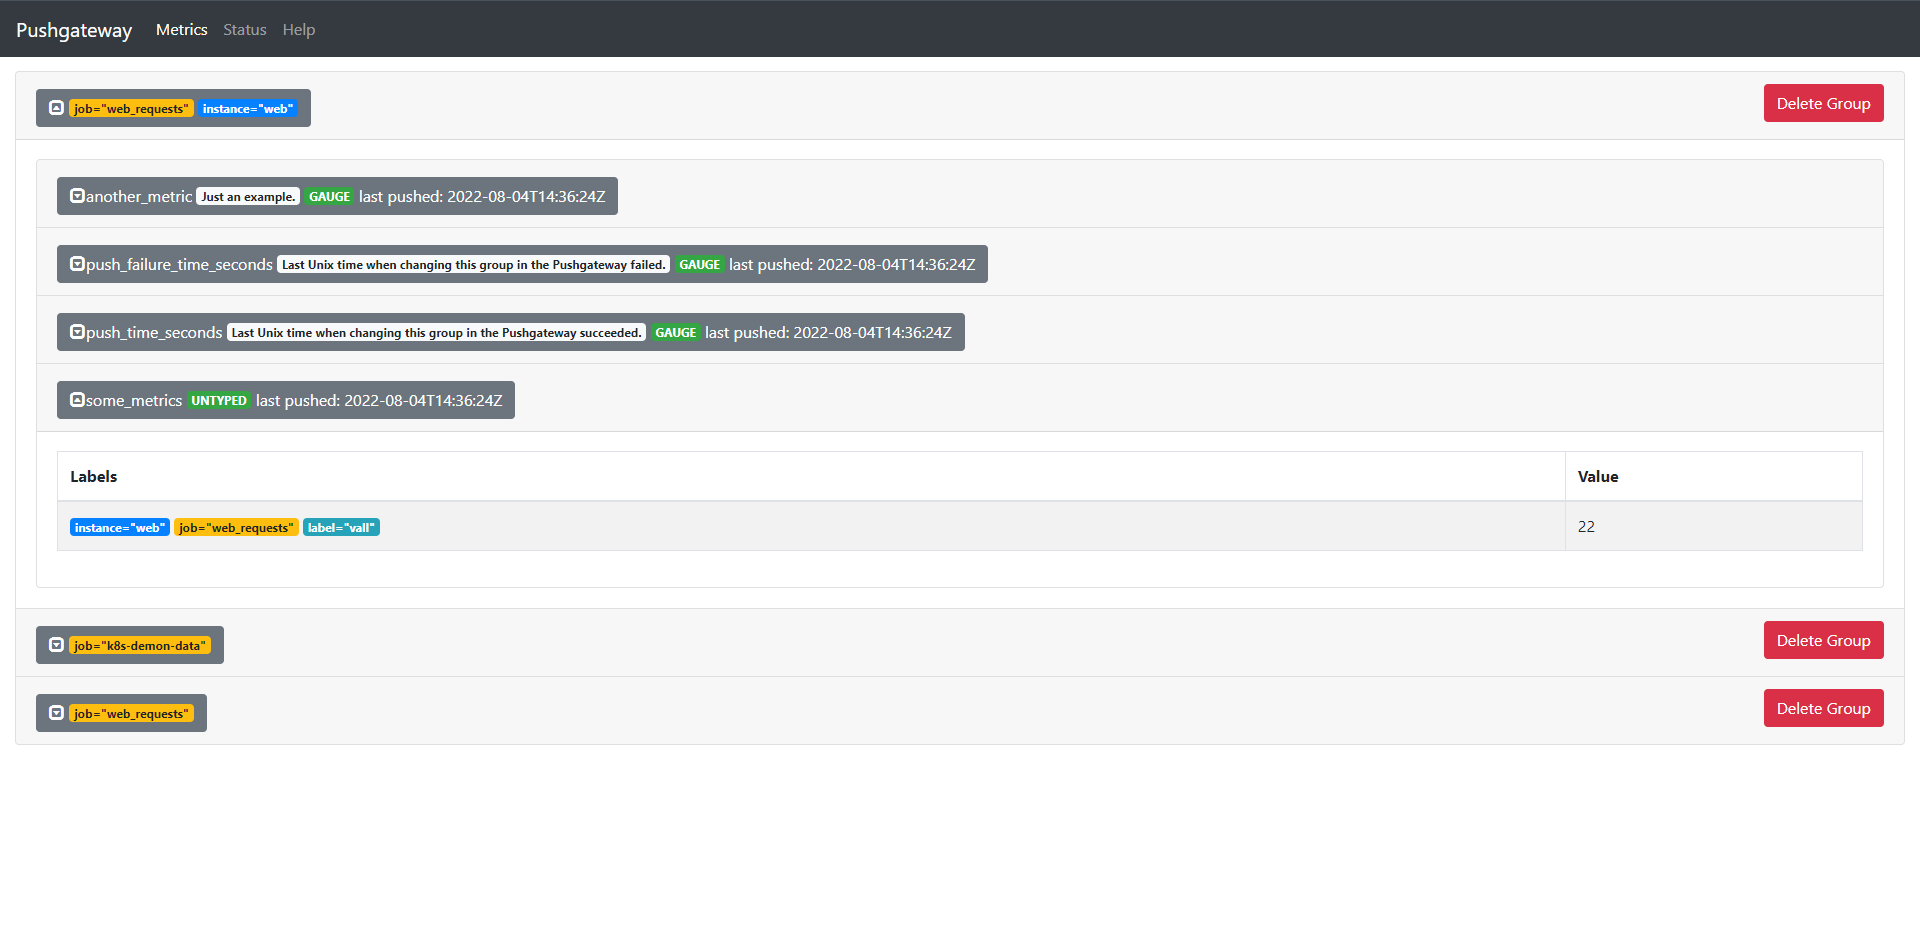
可以看到,虽然是同一个job但是instance是不同的,这个时候他们的数据是不在一起展示的。

这里删除指标也非常的简单,这个时候就使用到我们的HTTP 协议中的DELETE了,我们来删除刚刚创建的一个分组

curl -X DELETE http://10.0.0.10:30052/metrics/job/web_requests/instance/web
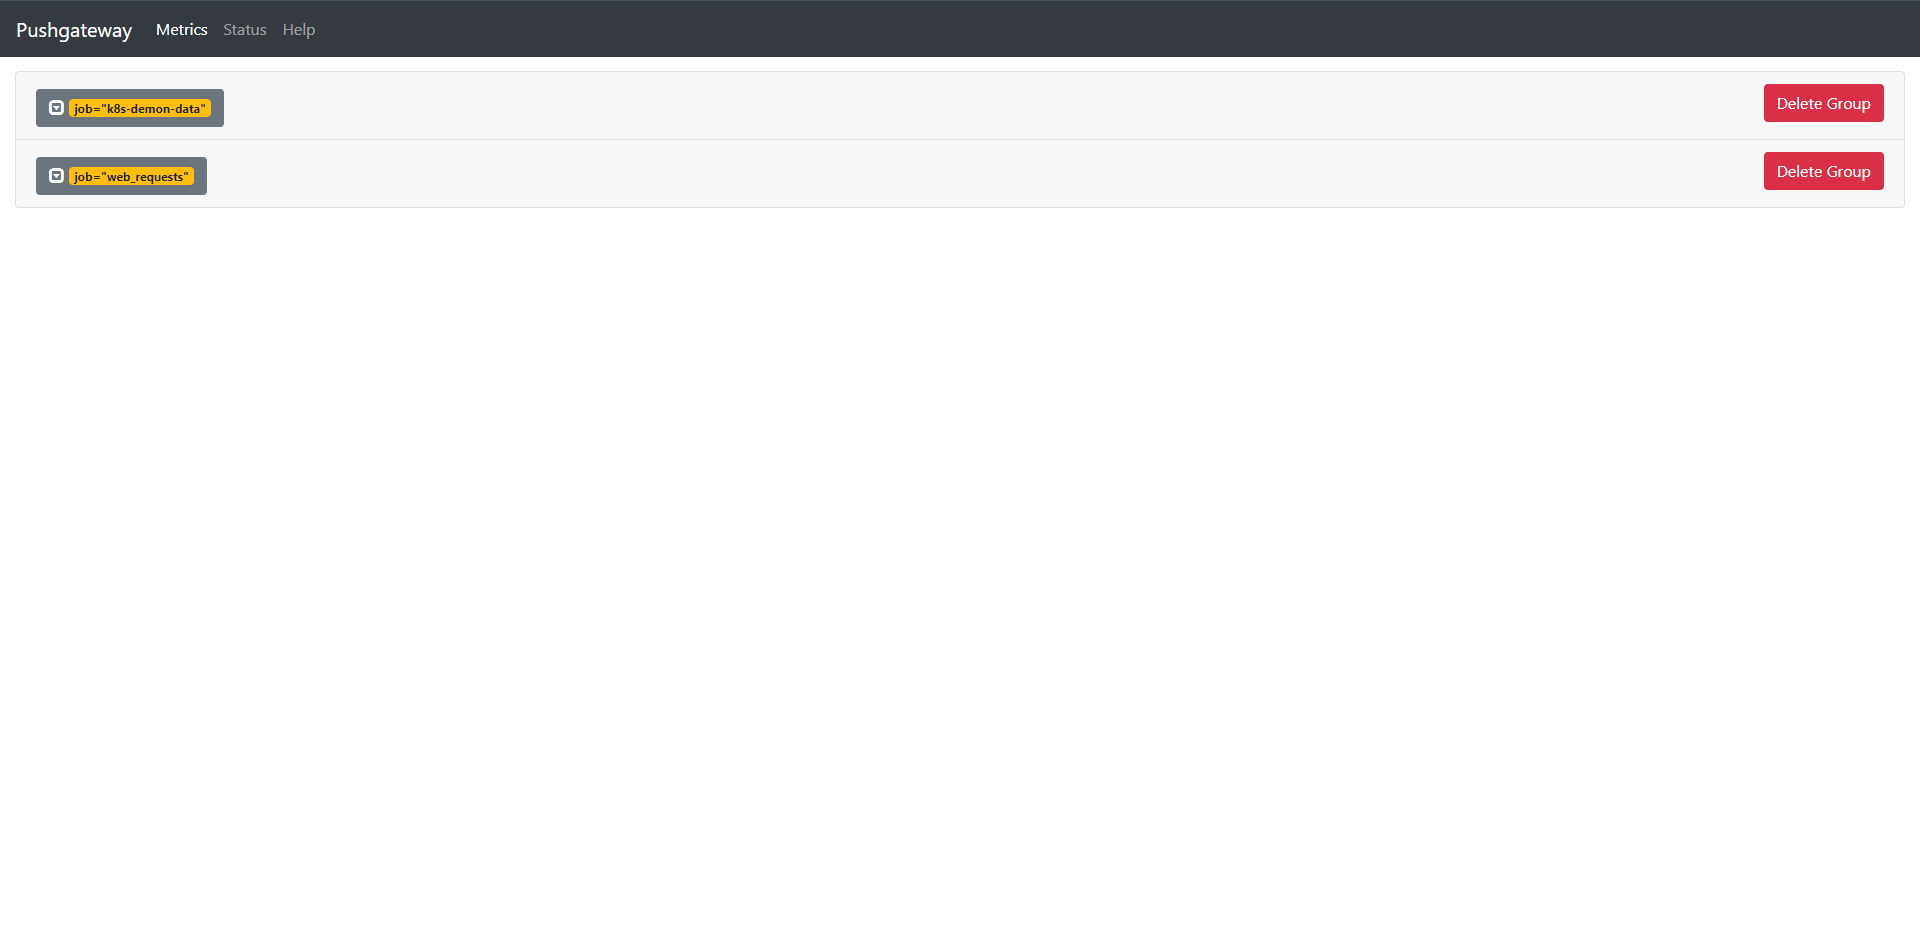
可以看到,这里已经将其删除了,需要注意的是,这里的删除是根据分组标识进行删除的比如删除{job="web_requests"}下的所有指标

curl -X DELETE http://10.0.0.10:30052/metrics/job/web_requests

但这里需要注意的时即使有相同Job的分组也不影响的,所以这个对操作的严谨性还是非常的高的。

如果你想删除所有组中的指标可以用下面的命令实现:

curl -X PUT http://10.0.0.10:30052/metrics/job/web_requests

但是执行前面的命令的前提是你必须开启--web.enable-admin-api来管理API。
    spec:
      containers:
      - args:
        - --persistence.file=/data/metrics_file
        - --web.enable-admin-api
        image: prom/pushgateway:latest

curl -X PUT http://10.0.0.10:32159/metrics/job/web_requests
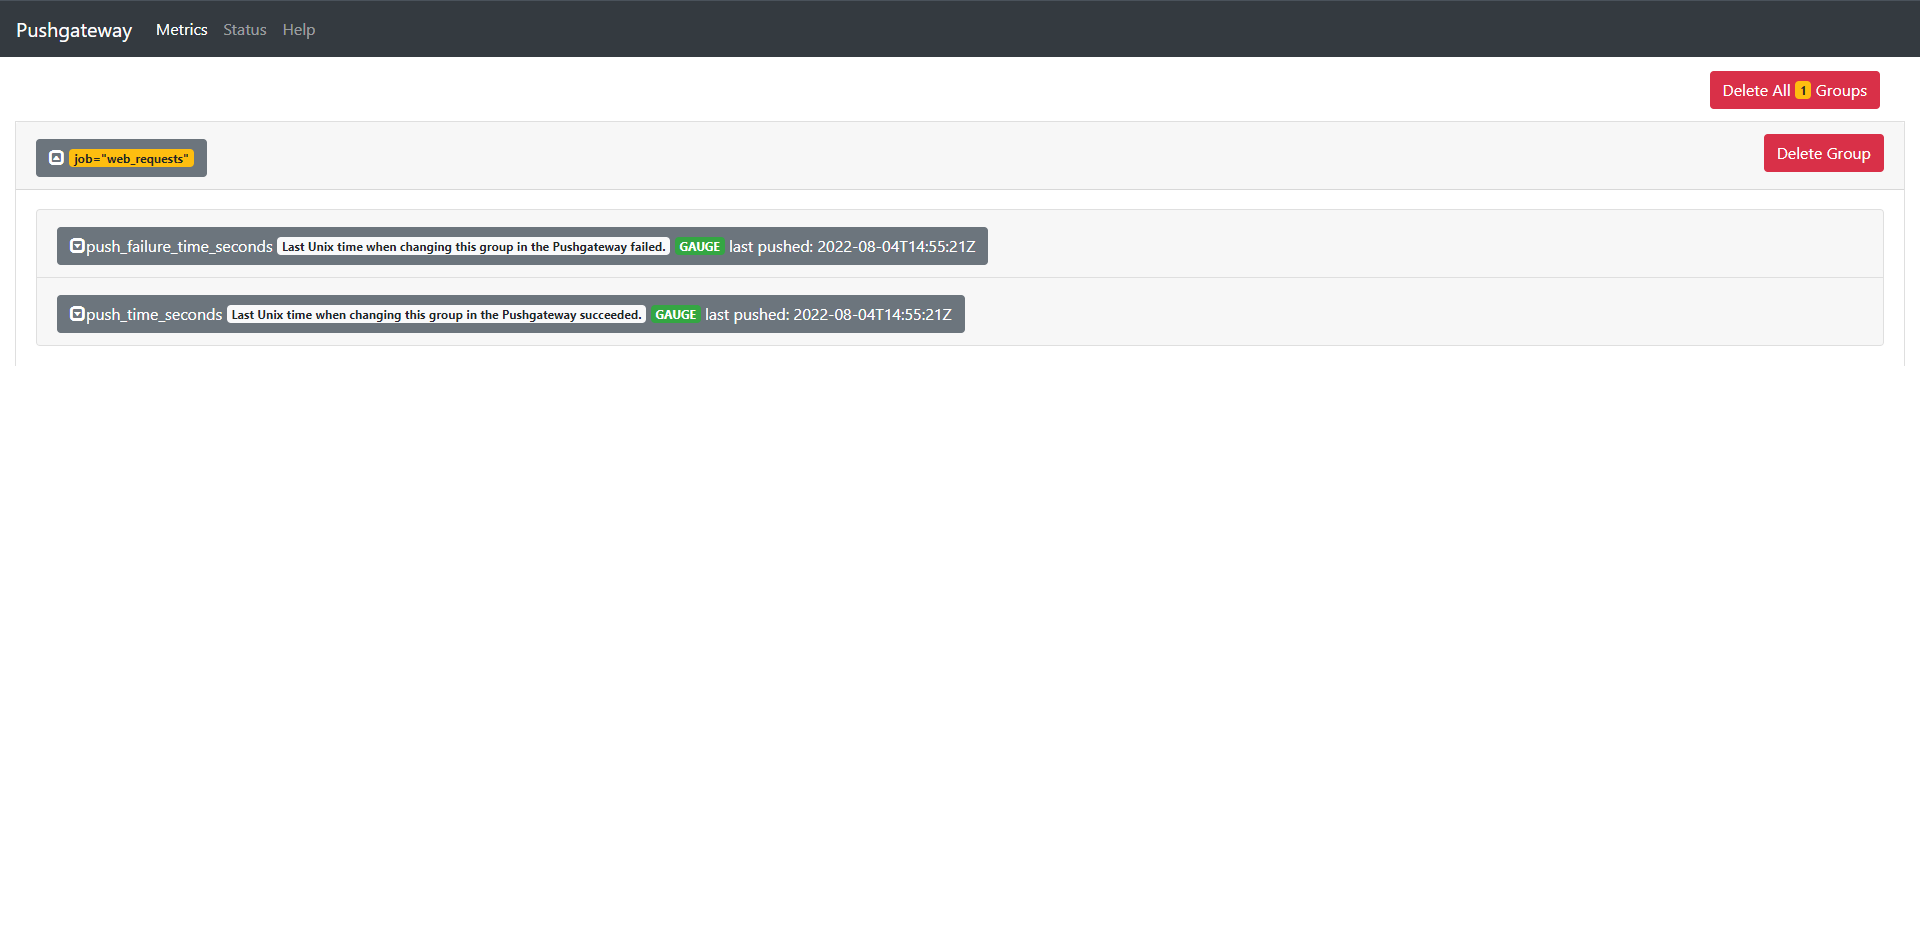
这样分组内的指标就被清除了,而且分组还保留着。
17.2.3:抓取目标
现在我们需要将Pushgateway的指标配置到Prometheus中去,让Prometheus主动去抓取Pushgateway中的数据,当然我们可以使用服务发现的方式,这里单独给Pushgateway创建一个抓取任务,

    - job_name: 'pushgateway'
      honor_labels: true
      kubernetes_sd_configs:
      - role: endpoints
      relabel_configs:
        - source_labels:
            [__meta_kubernetes_namespace, __meta_kubernetes_service_name]
          action: keep
          regex: kube-monitor;pushgateway

或者直接加注解

kind: Service
apiVersion: v1
metadata:
  annotations:
    prometheus.io/port: "9091"
    prometheus.io/scrape: "true"
  name: pushgateway
  namespace: kube-monitor
  labels:
    app: pushgateway
spec:
  selector:
    app: pushgateway
  type: NodePort
  ports:
    - name: http
      port: 9091
      targetPort: http

重载Prometheus
curl -X POST http://10.0.0.10:31656/-/reload
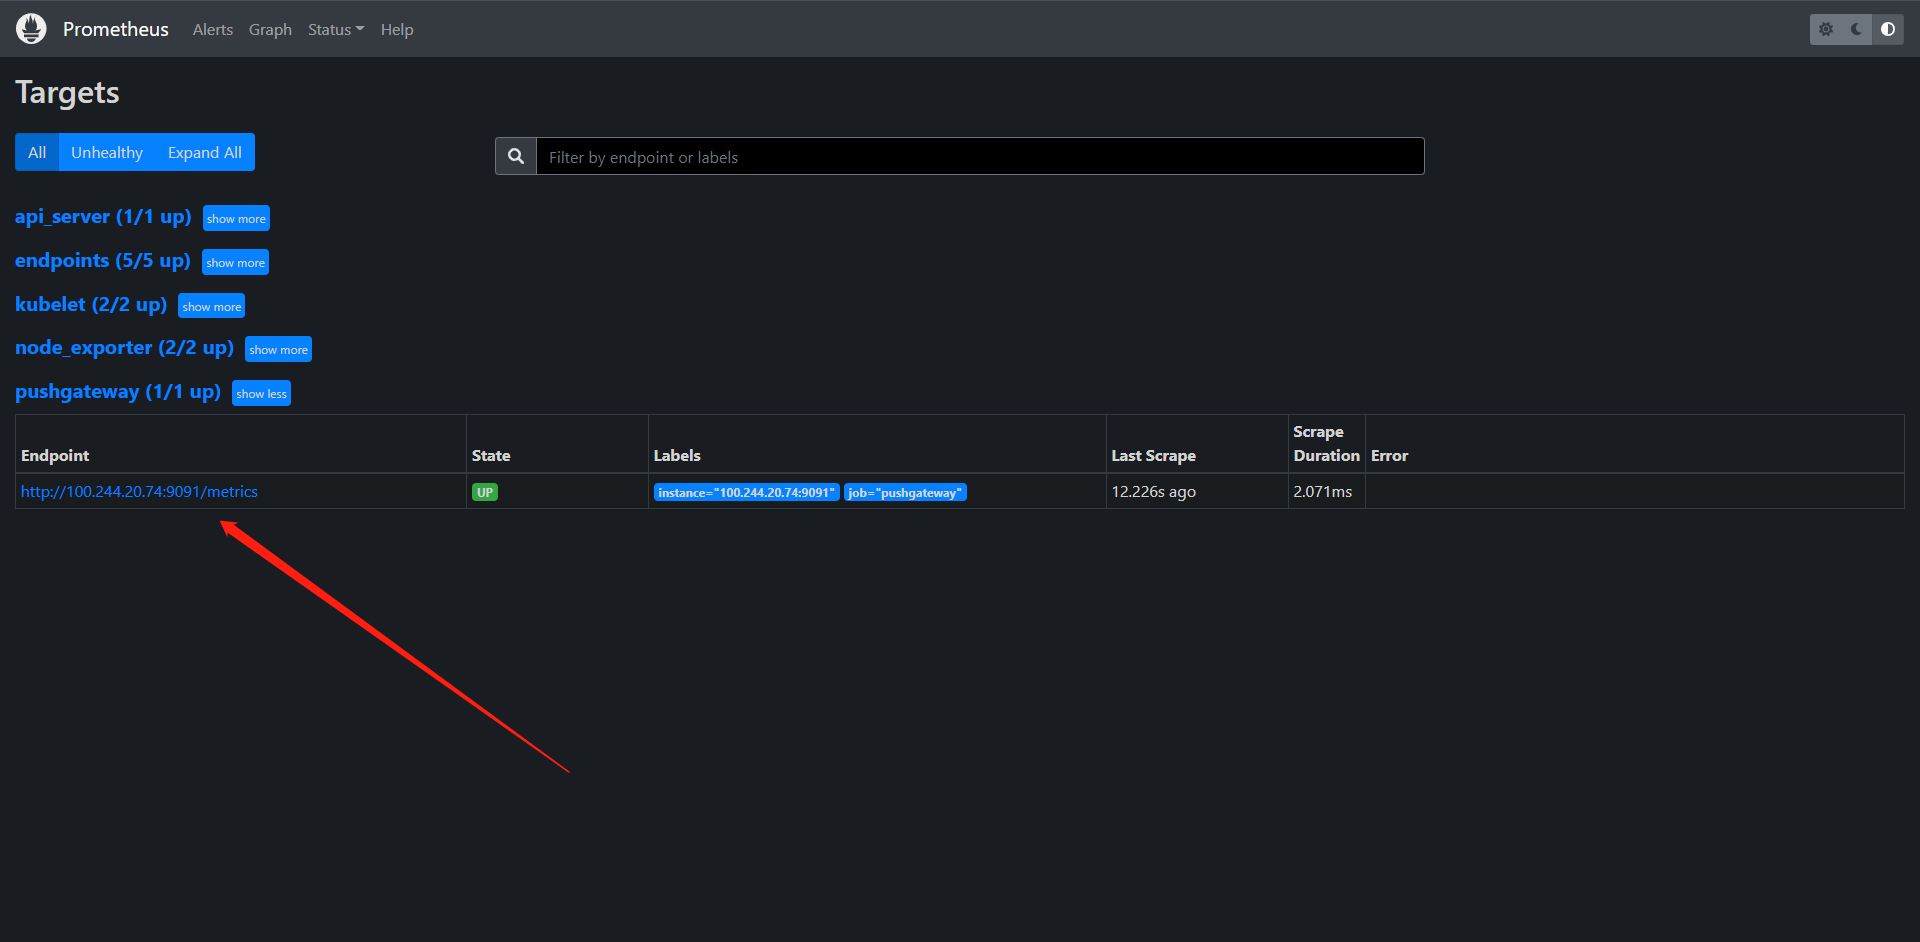
这里也发现到了Pushgateway了。

PromQL来查询我们的推送上去的语句
PromQL:some_metrics{job=~'pushgateway'}
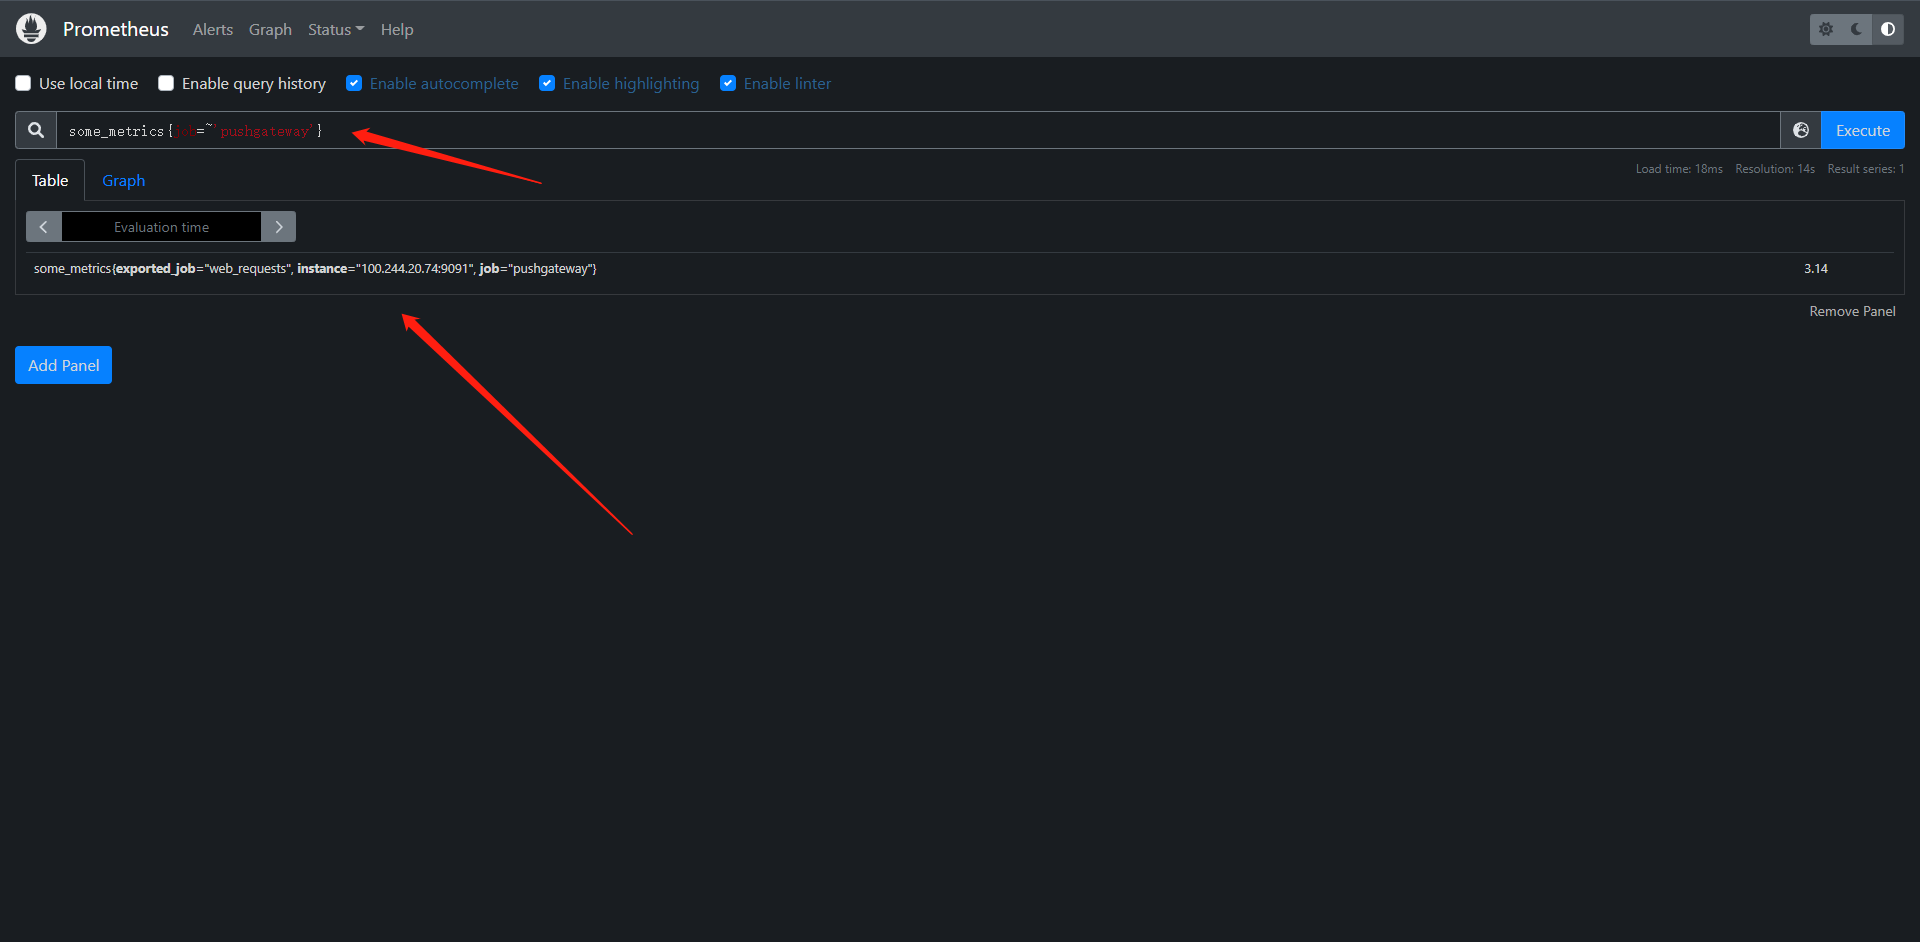
客观来讲我们的生产中能不使用这个就尽量不要使用这个Pushgateway。
18:AlertManager
18.1:Alertmanager安装配置
前面我们学习了Prometheus的时候了解到了Prometheus包含一个告警模块,也就是我们今天来学的AlertManager,Alertmanager主要用于接收Prometheus发送的告警信息,它支持丰富的告警通知渠道,而且很容易做到告警信息去重,降噪,分组等,是一款非常前卫的告警系统。

通过在Prometheus中定义告警规则,Prometheus会周期性的对告警策略进行计算,如果满足告警触发条件就会想Alertmanager发送告警信息。
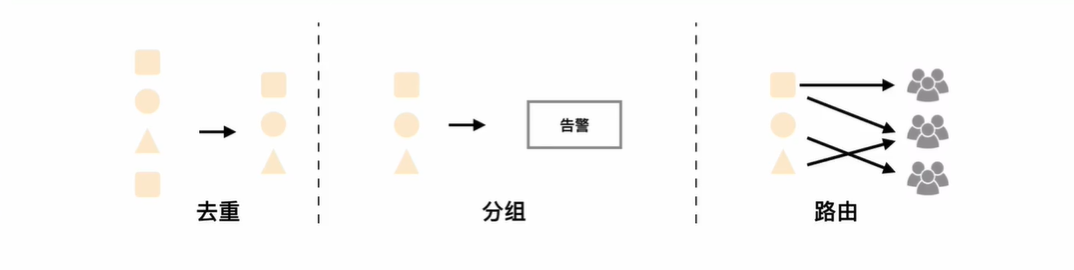
在Prometheus中一条告警规则组要包含以下几部分:
1:告警名称:用户需要为告警规则命名,当然对于命名而言,需要能够直接表达出该告警的主要内容。
2:告警规则:告警规则实际上是由PromQL进行定义,其实际意义是当表达式(PromQL)查询结果持续多长时间(During)后触发告警
在Prometheus中还可以通过Group(告警祖)对一组相关的告警进行统一定义,Alertmanager作为一个独立的组件,负责接收处理来自Prometheus Server的告警信息,Alertmanager可以对这些告警信息进行进一步处理,比如当接收到大量重复告警时能够消除重复的告警信息,同时对告警信息进行分组并且路由到正确的通知方,Prometheus内置了对Email,Slack多种通知方式,同时还支持与WebHook的集成,以支持更多定制化的场景,例如,目前Alertmanager还不支持钉钉,用户完全可以通过WebHook与钉钉机器人进行集成,从而通过钉钉接收告警信息,同时Alertmanager还提供了静默和告警抑制机制来对告警通知行为进行优化。
18.1.1:安装
从官方文档`https://prometheus.io/docs/alerting/configuration`中我们可以看到下载Alertmanager二进制文件后可以通过 ./alertmanager --config.file=simple.yml 运行,其中--config.file参数是用来指定配置文件,由于我们这里也同样是Kubernetes部署,所以我们采用的是镜像 prom/alertmanager:latest
1:配置Config,创建ConfigMap文件
kind: ConfigMap
apiVersion: v1
metadata:
name: alert-config
namespace: kube-monitor
data:
config.yml: |-
global:
# 当alertmanager持续多长时间未接收到告警后标记告警状态位resolved
resolve_timeout: 5m
# 配置邮件发送信息
smtp_smarthost: 'smtp.163.com:25'
smtp_from: 'xxxxxx@163.com'
smtp_auth_username: 'xxxxxx@163.com'
smtp_auth_password: 'XXXXXXX' # 授权码
smtp_hello: '163.com'
smtp_require_tls: false
# 所有告警接入根路由,用来设置报警分发策略
route:
# 这里的标签列表是接收到报警信息后的重信分组标签,例如,接收到告警信息里面有许多具有cluster=A和alertname=LatncyHigh,这样标签的告警信息将会批量聚合到一个分组内。
group_by: ['alertname', 'cluster']
# 当一个告警分组被创建后,需要等待至少group_wait时间来初始化通知,这种方式可以确保您能有足够的时间为同一个分组来获取多个警报,然后一起触发这个报警信息,
group_wait: 30s
# 相同的group之间发送告警通知的时间间隔
group_interval: 30s
# 如果一个报警信息已经发送成功了,等待repeat_interval时间来重新发送给他们。不同类型的告警发送频率需要具体配置。
repeat_interval: 1h
# 默认的receiver:如果一个报警没有被一个route匹配,则发送给默认的接收器
receiver: default
# 上面所有的属性都由子路由继承,并且可以在每个子路由上进行覆盖
routes:
- receiver: email
group_wait: 10s
match
team: node
receviers:
- name: 'default'
email_configs:
- to: '2054076300@qq.com' # 这里其实是没有匹配到路由规则的告警则发送到这里
send_resolved: true # 接收告警恢复通知
- name: 'email'
email_configs:
- to: '2054076300@qq.com'
send_resolved: true # 接收告警恢复通知
[root@kubernetes-master-1 alertmanager]# cat config.yaml
kind: ConfigMap
apiVersion: v1
metadata:
name: alert-config
namespace: kube-monitor
data:
config.yml: |-
global:
resolve_timeout: 5m
smtp_smarthost: 'smtp.163.com:465'
smtp_from: 'xxxxxxx@163.com'
smtp_auth_username: 'xxxxxxx@163.com'
smtp_auth_password: 'XXXXXX'
smtp_hello: '163.com'
smtp_require_tls: false
route:
group_by: ['alertname', 'cluster']
group_wait: 30s
group_interval: 30s
repeat_interval: 1h
receiver: default
routes:
- receiver: email
group_wait: 10s
match:
team: node
receivers:
- name: 'default'
email_configs:
- to: '2054076300@qq.com'
send_resolved: true
- name: 'email'
email_configs:
- to: '2054076300@qq.com'
send_resolved: true
分组:分组机制可以将详细的告警信息合并成一个通知,在某些情况下,比如由于系统宕机导致大量告警被同时触发,在这种情况下分组机制可以将这些被触发的告警合并为一个告警通知,避免一次性接收大量的告警通知,而无法快速定位问题。
创建ConfigMap
[root@kubernetes-master-1 alertmanager]# kubectl apply -f config.yaml
configmap/alert-config created
然后配置一个Deployment控制器来管理Alertmanager的容器
[root@kubernetes-master-1 alertmanager]# cat alertmanager-deploy.yaml
kind: Deployment
apiVersion: apps/v1
metadata:
name: alertmanager
namespace: kube-monitor
labels:
app: alertmanager
spec:
selector:
matchLabels:
app: alertmanager
template:
metadata:
labels:
app: alertmanager
spec:
volumes:
- name: alertconf
configMap:
name: alert-config
containers:
- name: alertmanager
image: prom/alertmanager:latest
args:
- "--config.file=/etc/alertmanager/config.yml"
- "--cluster.advertise-address=0.0.0.0:9093"
ports:
- containerPort: 9093
name: http
volumeMounts:
- mountPath: '/etc/alertmanager'
name: alertconf
resources:
requests:
cpu: 100m
memory: 256Mi
limits:
cpu: 100m
memory: 256Mi
[root@kubernetes-master-1 alertmanager]# kubectl apply -f alertmanager-deploy.yaml
deployment.apps/alertmanager created
[root@kubernetes-master-1 alertmanager]# kubectl get pod -A -l app=alertmanager
NAMESPACE NAME READY STATUS RESTARTS AGE
kube-monitor alertmanager-547d5776fc-r77f6 1/1 Running 0 2m7s
AlertManager给了一个web我们可以用svc暴露以下
[root@kubernetes-master-1 alertmanager]# cat service.yaml
kind: Service
apiVersion: v1
metadata:
name: alertmanager
namespace: kube-monitor
labels:
app: alertmanager
spec:
selector:
app: alertmanager
type: NodePort
ports:
- name: web
port: 9093
targetPort: http
[root@kubernetes-master-1 alertmanager]# kubectl apply -f service.yaml
service/alertmanager created
[root@kubernetes-master-1 alertmanager]# kubectl get svc -n kube-monitor -l app=alertmanager
NAME TYPE CLUSTER-IP EXTERNAL-IP PORT(S) AGE
alertmanager NodePort 200.104.209.168 <none> 9093:30493/TCP 23s
我们访问测试下
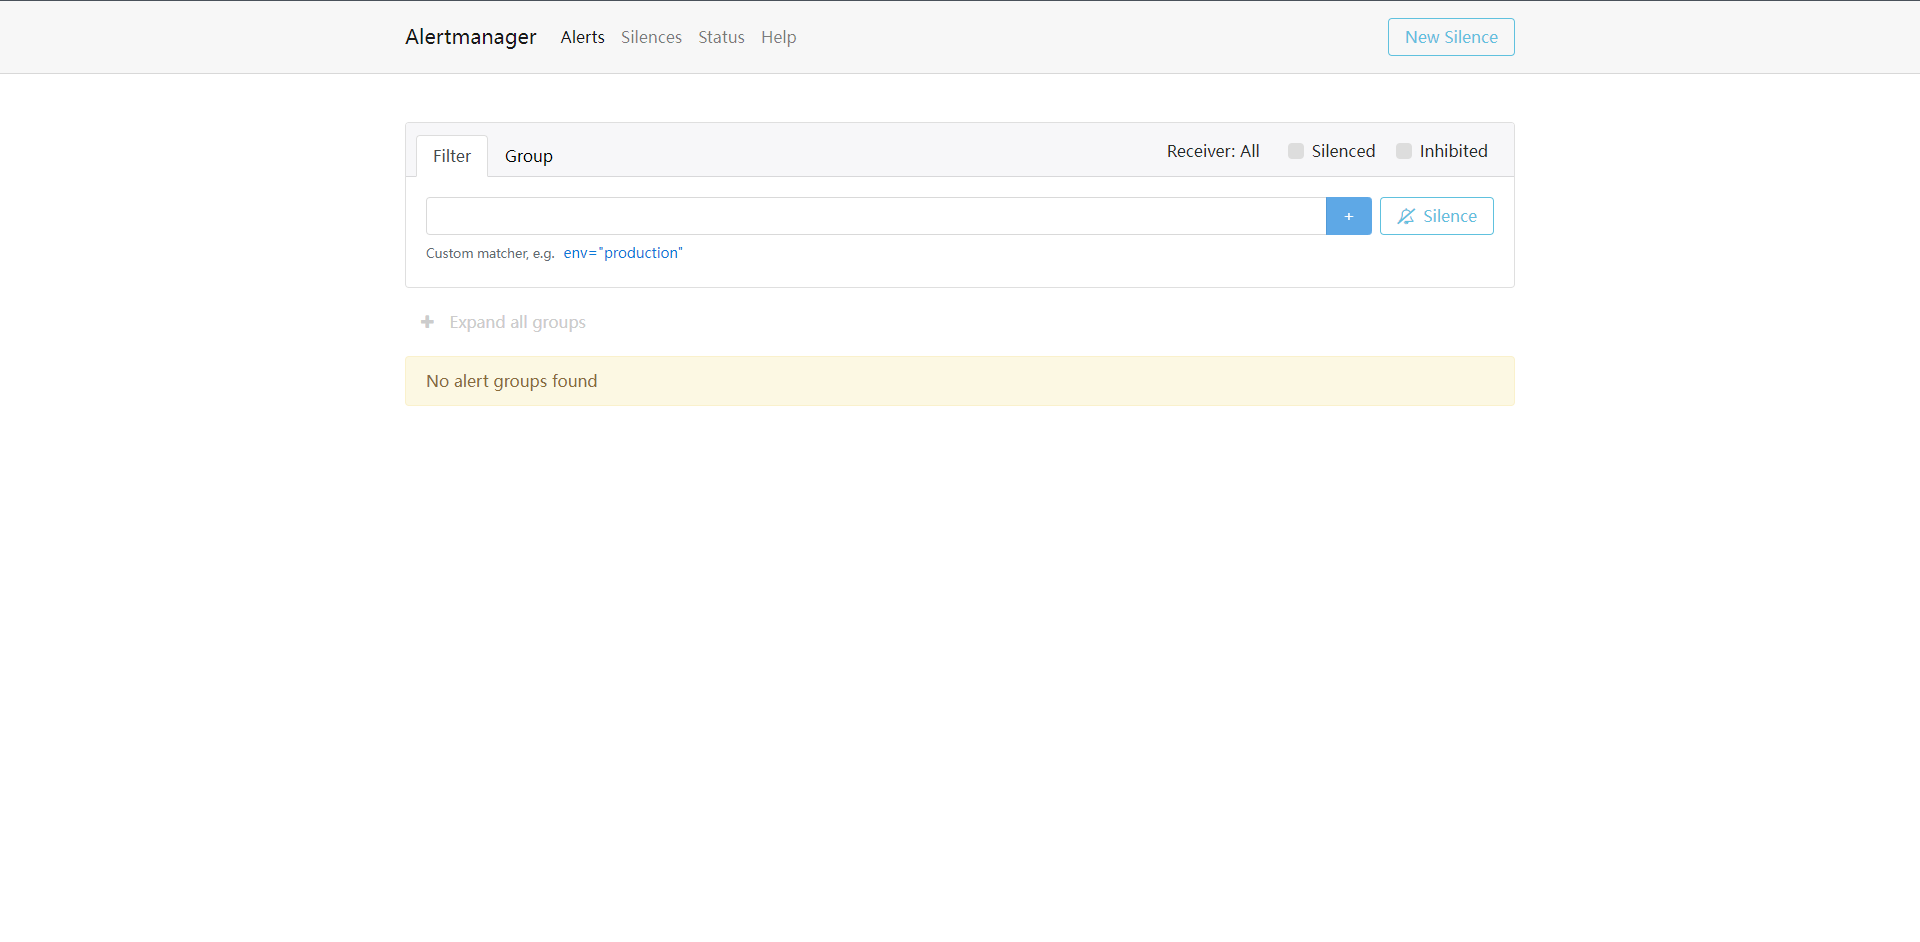
当然了,这个时候我们部署好了alertmanager是一个独立的组件,我们需要让它与Prometheus关联起来,因为需要它去计算我们定义的报警规则,然后再决定是否触发报警,这个时候我们需要去配置以下Prometheus的配置文件了。
alerting:
alertmanagers:
- static_configs: # 这里完全可以使用自动发现的机制
- targets: ['alertmanager:9093']
重载Prometheus
curl -X POST http://10.0.0.10:31656/-/reload
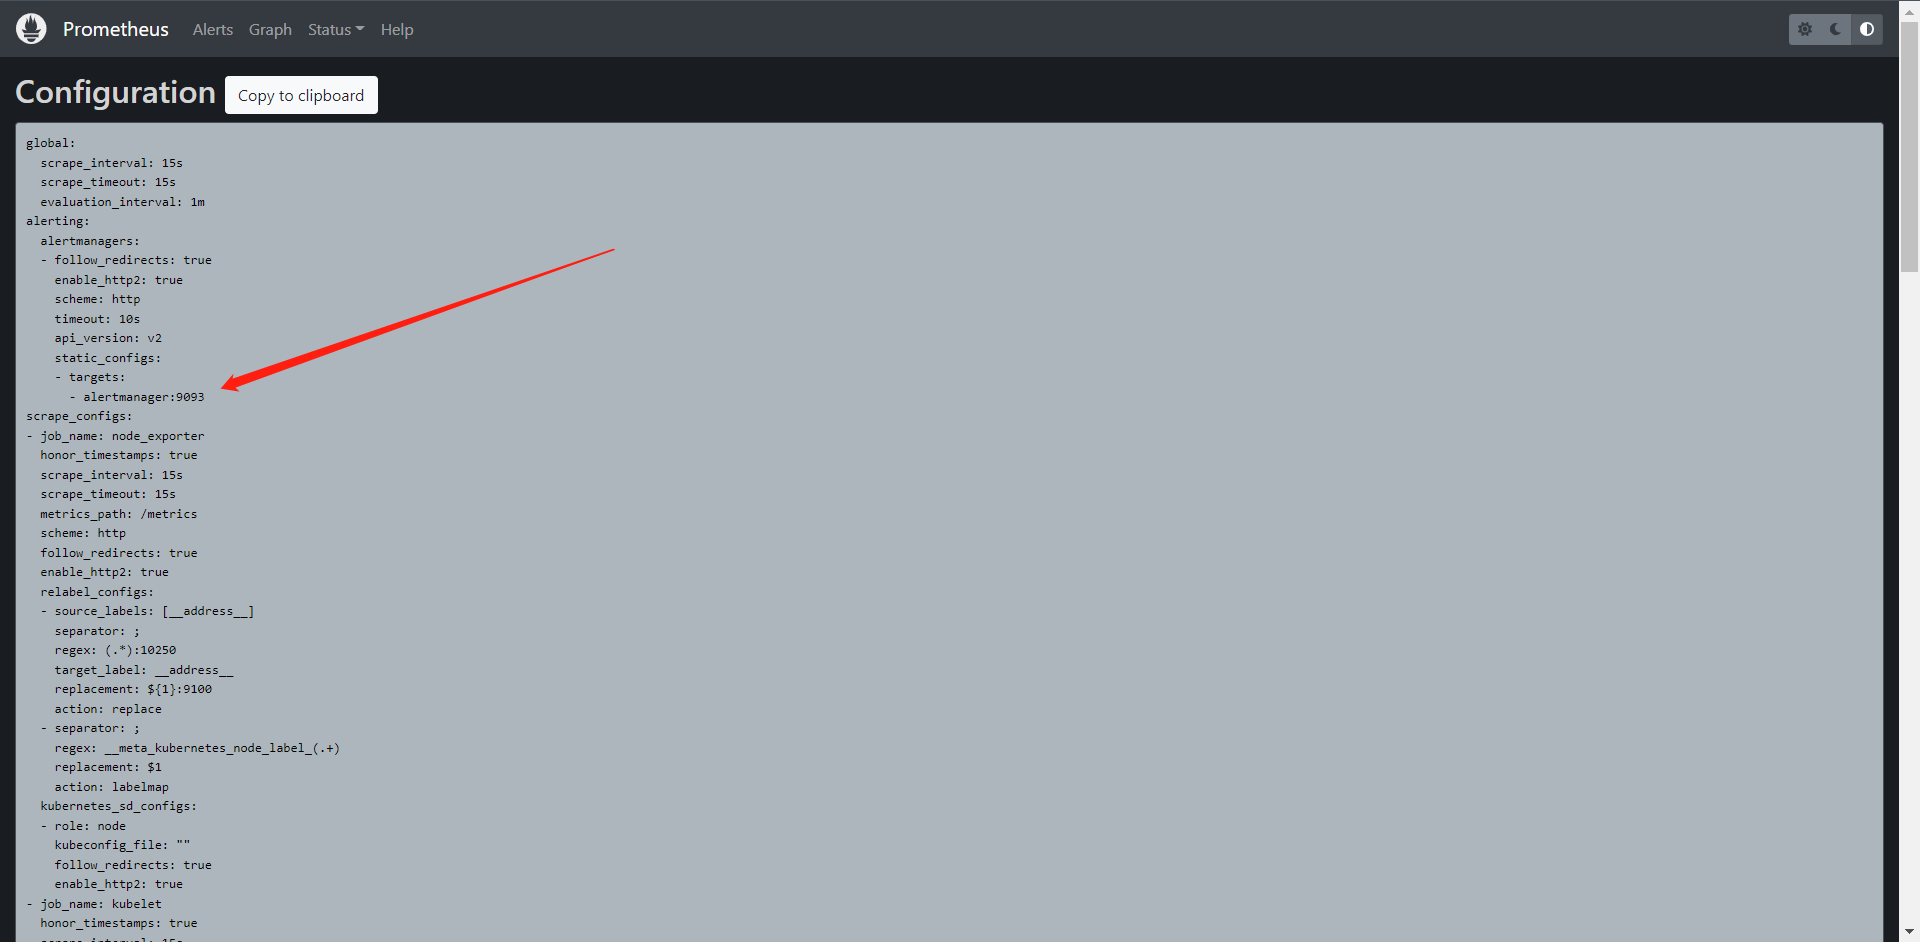
18.2:报警规则
上面我们配置好了Alertmanager已经启动并配置到了Prometheus内,但是现在我们还不知道要做什么告警,因为没有任何地方告诉我们告警,所以我们需要配置一些告警规则来告诉我们要对哪儿些数据进行告警,
报警规则允许你基于Prometheus表达式(PromQL)语言的方式定义报警条件,并在触发报警时发送通知给外部的接收者。
同样在Prometheus的配置文件内配置。
rule_files:
- /etc/prometheus/rules.yml
其中rule_files就是用来指定报警规则的,这里我们同样将rules.yml文件使用ConfigMap形式挂载到/etc/prometheus/目录下即可,
我们可以吧rules规则和prometheus的config写在一个configmap内
[root@kubernetes-master-1 prometheus]# cat config.yaml
apiVersion: v1
data:
prometheus.yml: |
global:
scrape_interval: 15s
scrape_timeout: 15s
alerting:
alertmanagers:
- static_configs:
- targets: ['alertmanager:9093']
rule_files:
- /etc/prometheus/rules.yml
scrape_configs:
- job_name: 'node_exporter'
kubernetes_sd_configs:
- role: node
relabel_configs:
- source_labels: [__address__]
regex: "(.*):10250"
replacement: "${1}:9100"
target_label: __address__
action: replace
- action: labelmap
regex: __meta_kubernetes_node_label_(.+)
- job_name: 'kubelet'
kubernetes_sd_configs:
- role: node
scheme: https
tls_config:
ca_file: /var/run/secrets/kubernetes.io/serviceaccount/ca.crt
insecure_skip_verify: true
bearer_token_file: /var/run/secrets/kubernetes.io/serviceaccount/token
relabel_configs:
- action: labelmap
regex: __meta_kubernetes_node_label_(.+)
- job_name: 'api_server'
kubernetes_sd_configs:
- role: endpoints
scheme: https
tls_config:
ca_file: /var/run/secrets/kubernetes.io/serviceaccount/ca.crt
insecure_skip_verify: true
bearer_token_file: /var/run/secrets/kubernetes.io/serviceaccount/token
relabel_configs:
- source_labels:
[
__meta_kubernetes_namespace,
__meta_kubernetes_service_name,
__meta_kubernetes_endpoint_port_name,
]
action: keep
regex: default;kubernetes;https
- job_name: "endpoints"
kubernetes_sd_configs:
- role: endpoints
relabel_configs:
- source_labels: [__meta_kubernetes_service_annotation_prometheus_io_scrape]
action: keep
regex: true
- source_labels: [__meta_kubernetes_service_annotation_prometheus_io_scheme]
action: replace
target_label: __scheme__
regex: (https?)
- source_labels: [__meta_kubernetes_service_annotation_prometheus_io_path]
action: replace
target_label: __metrics_path__
regex: (.+)
- source_labels:
[__address__, __meta_kubernetes_service_annotation_prometheus_io_port]
action: replace
target_label: __address__
regex: ([^:]+)(?::\d+)?;(\d+)
replacement: $1:$2
- action: labelmap
regex: __meta_kubernetes_service_label_(.+)
- source_labels: [__meta_kubernetes_namespace]
action: replace
target_label: kubernetes_namespace
- source_labels: [__meta_kubernetes_service_name]
action: replace
target_label: kubernetes_name
- source_labels: [__meta_kubernetes_pod_name]
action: replace
target_label: kubernetes_pod_name
- job_name: 'pushgateway'
kubernetes_sd_configs:
- role: endpoints
relabel_configs:
- source_labels:
[__meta_kubernetes_namespace, __meta_kubernetes_service_name]
action: keep
regex: kube-monitor;pushgateway
rules.yml: |
groups:
- name: Test_Memory_Node
rules:
- alert: NodeMemoryUsage
expr: (node_memory_MemTotal_bytes - (node_memory_MemFree_bytes + node_memory_Buffers_bytes + node_memory_Cached_bytes)) / node_memory_MemTotal_bytes * 100 > 20
for: 1m
labels:
team: node
annotations:
summary: "{{$labels.instance}}: High Memory usage detected"
description: "{{$labels.instance}}: Memory usage is above 20% (current value is: {{ $value }})"
kind: ConfigMap
metadata:
annotations:
kubectl.kubernetes.io/last-applied-configuration: |
{"apiVersion":"v1","data":{"prometheus.yml":"global:\n scrape_interval: 15s\n scrape_timeout: 15s\n\nscrape_configs:\n- job_name: 'prometheus'\n static_configs:\n - targets: ['localhost:9090']\n"},"kind":"ConfigMap","metadata":{"annotations":{},"name":"prometheus-config","namespace":"kube-monitor"}}
creationTimestamp: "2022-08-01T17:32:49Z"
name: prometheus-config
namespace: kube-monitor
resourceVersion: "138044"
uid: 08f157ef-f1a7-4664-b1db-686b1d6d2ca4
解释:
1:alert:告警规则名称
2:expr:用于进行报警规则PromQL查询语句
3:for:评估等待时间(Pending Duration),用于表示只有触发条件持续一段时间后才发送告警,在等待期间新产生的告警吃鱼pending状态。
4:labels:自定义标签,允许用户指定额外的标签列表把他们附在告警上
5:annotations:指定另一组标签,他们不被当作告警实例的身份标识,它们经常用于存储额外的信息用于报警信息的展示之类。
部署一下
[root@kubernetes-master-1 prometheus]# kubectl apply -f config.yaml
configmap/prometheus-config created
[root@kubernetes-master-1 prometheus]# kubectl exec -it -n kube-monitor prometheus-f78c85b87-ptn5l -- ls /etc/prometheus/
Defaulted container "prometheus" out of: prometheus, fix-prometheus (init)
prometheus.yml rules.yml
去Prometheus重载之后再次看一下
curl -X POST http://10.0.0.10:31656/-/reload
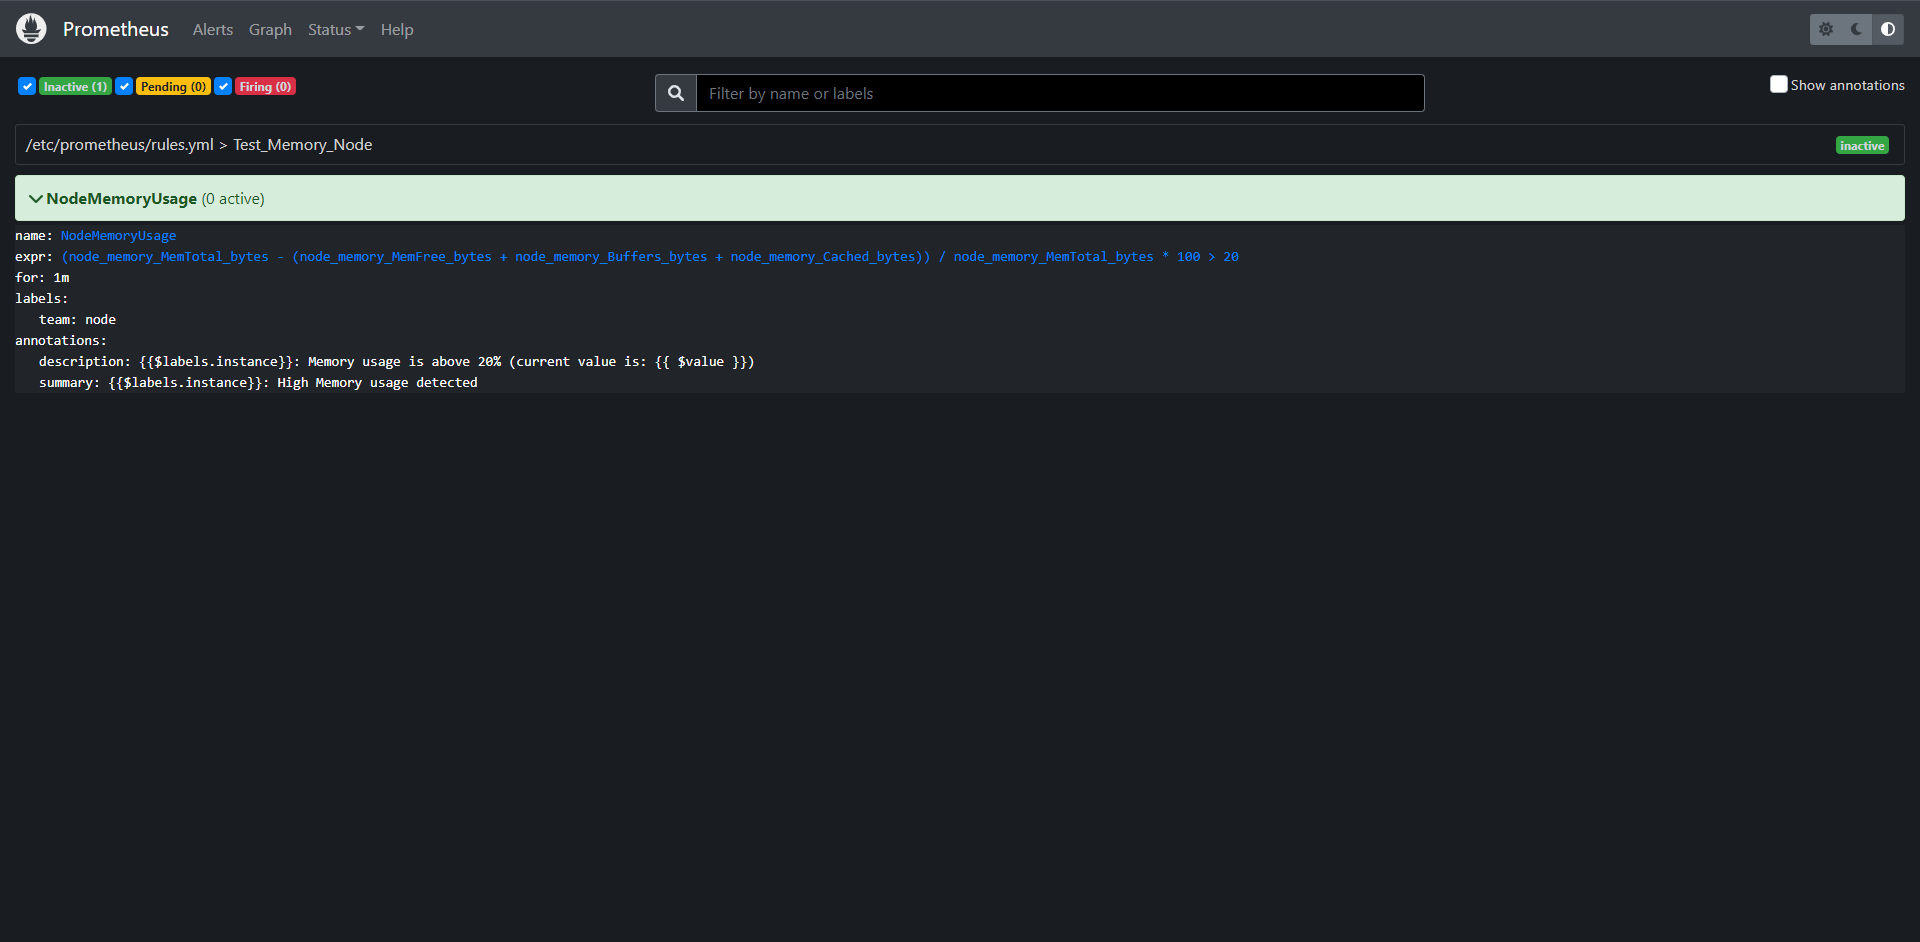
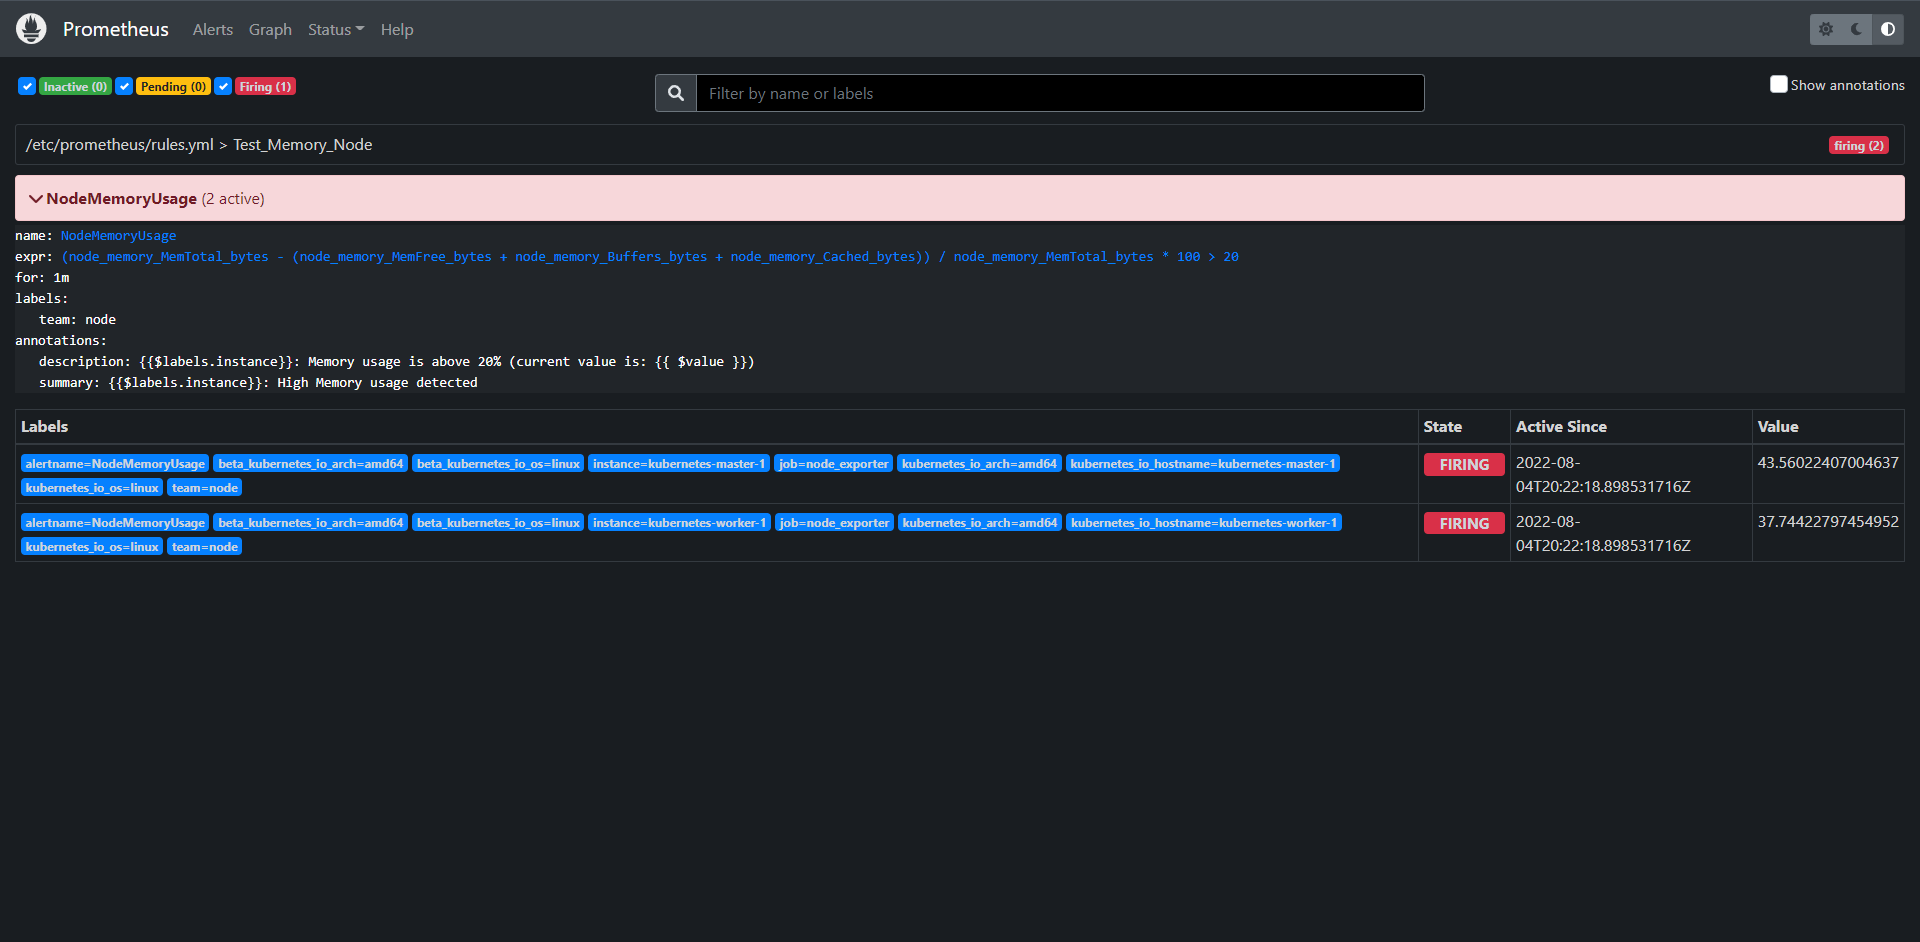
可以看到规则生效已经触发了告警了。
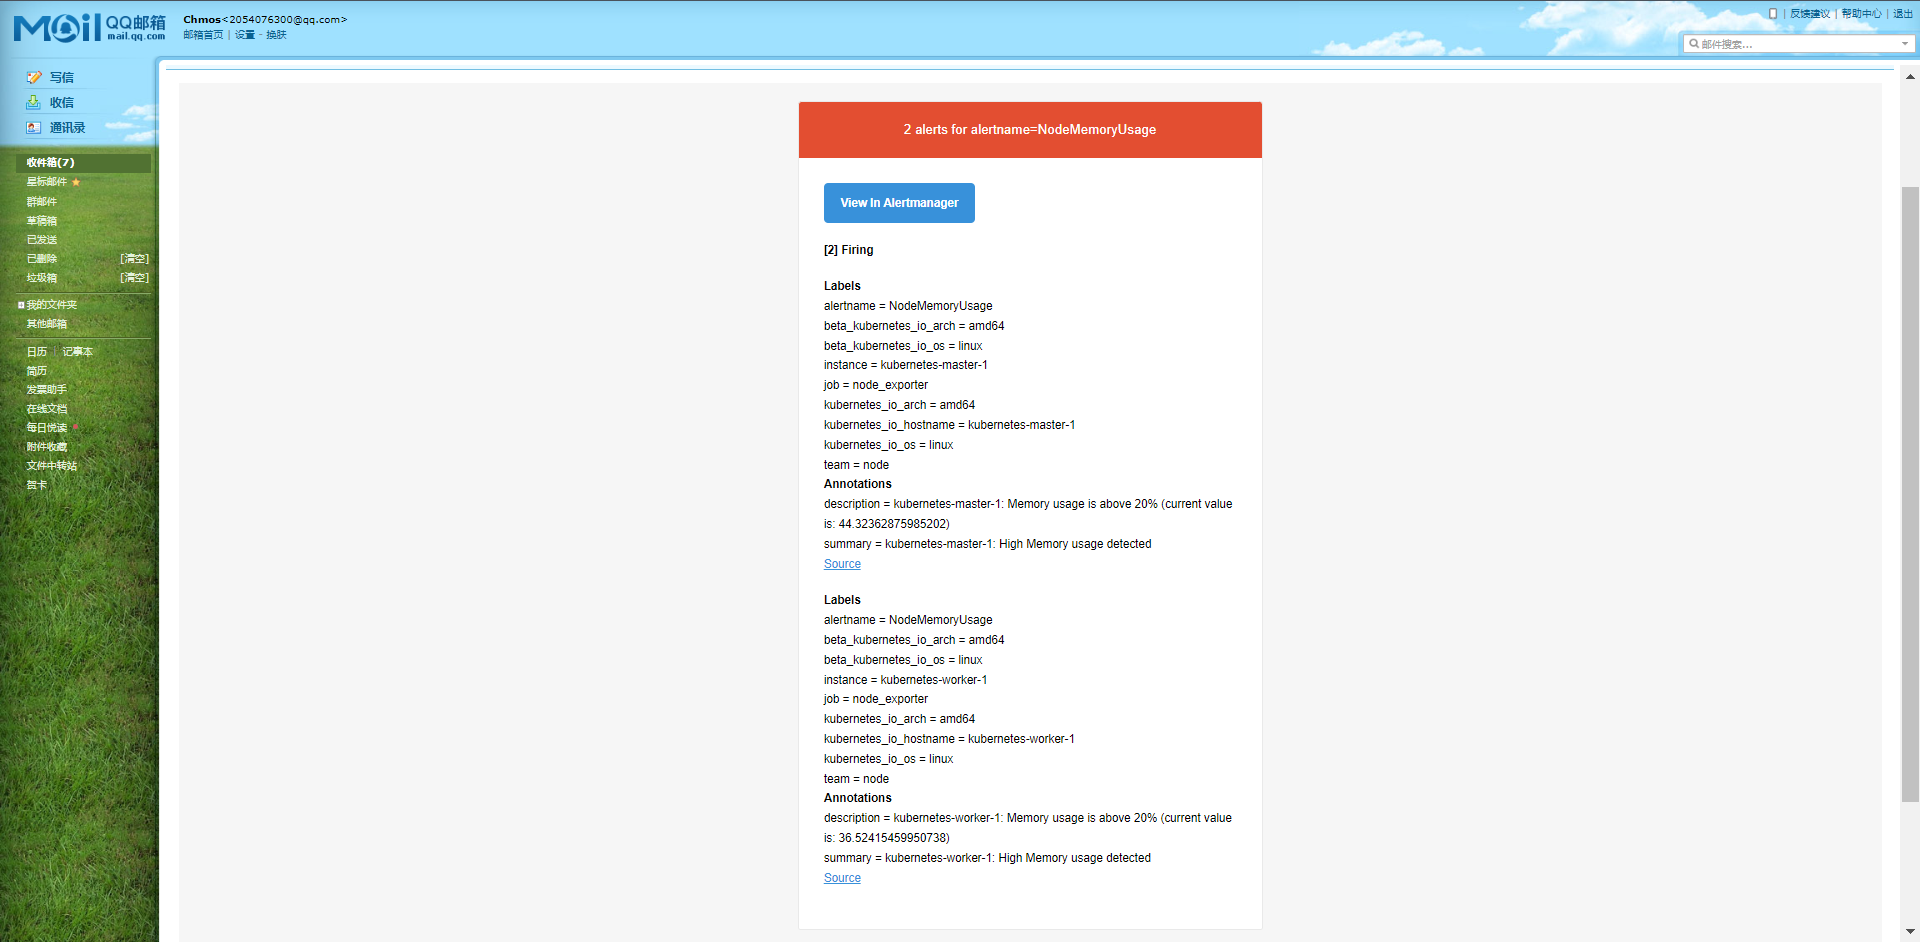
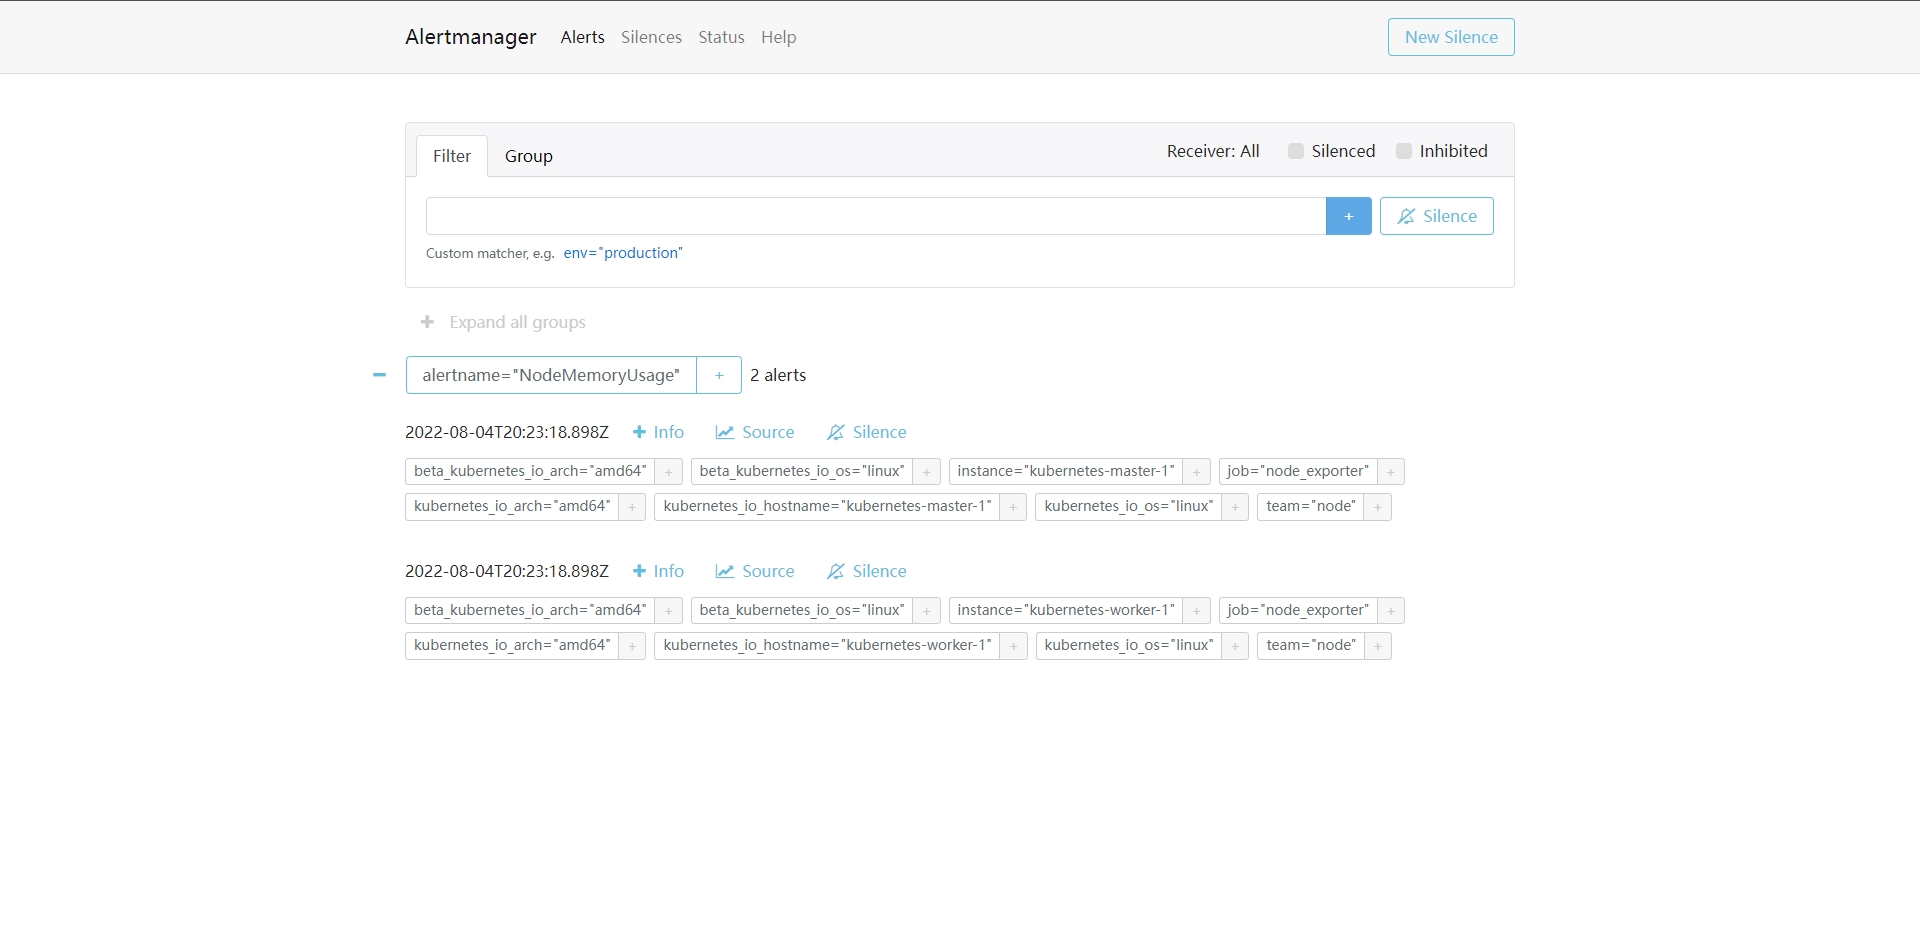
这样告警就接收到了
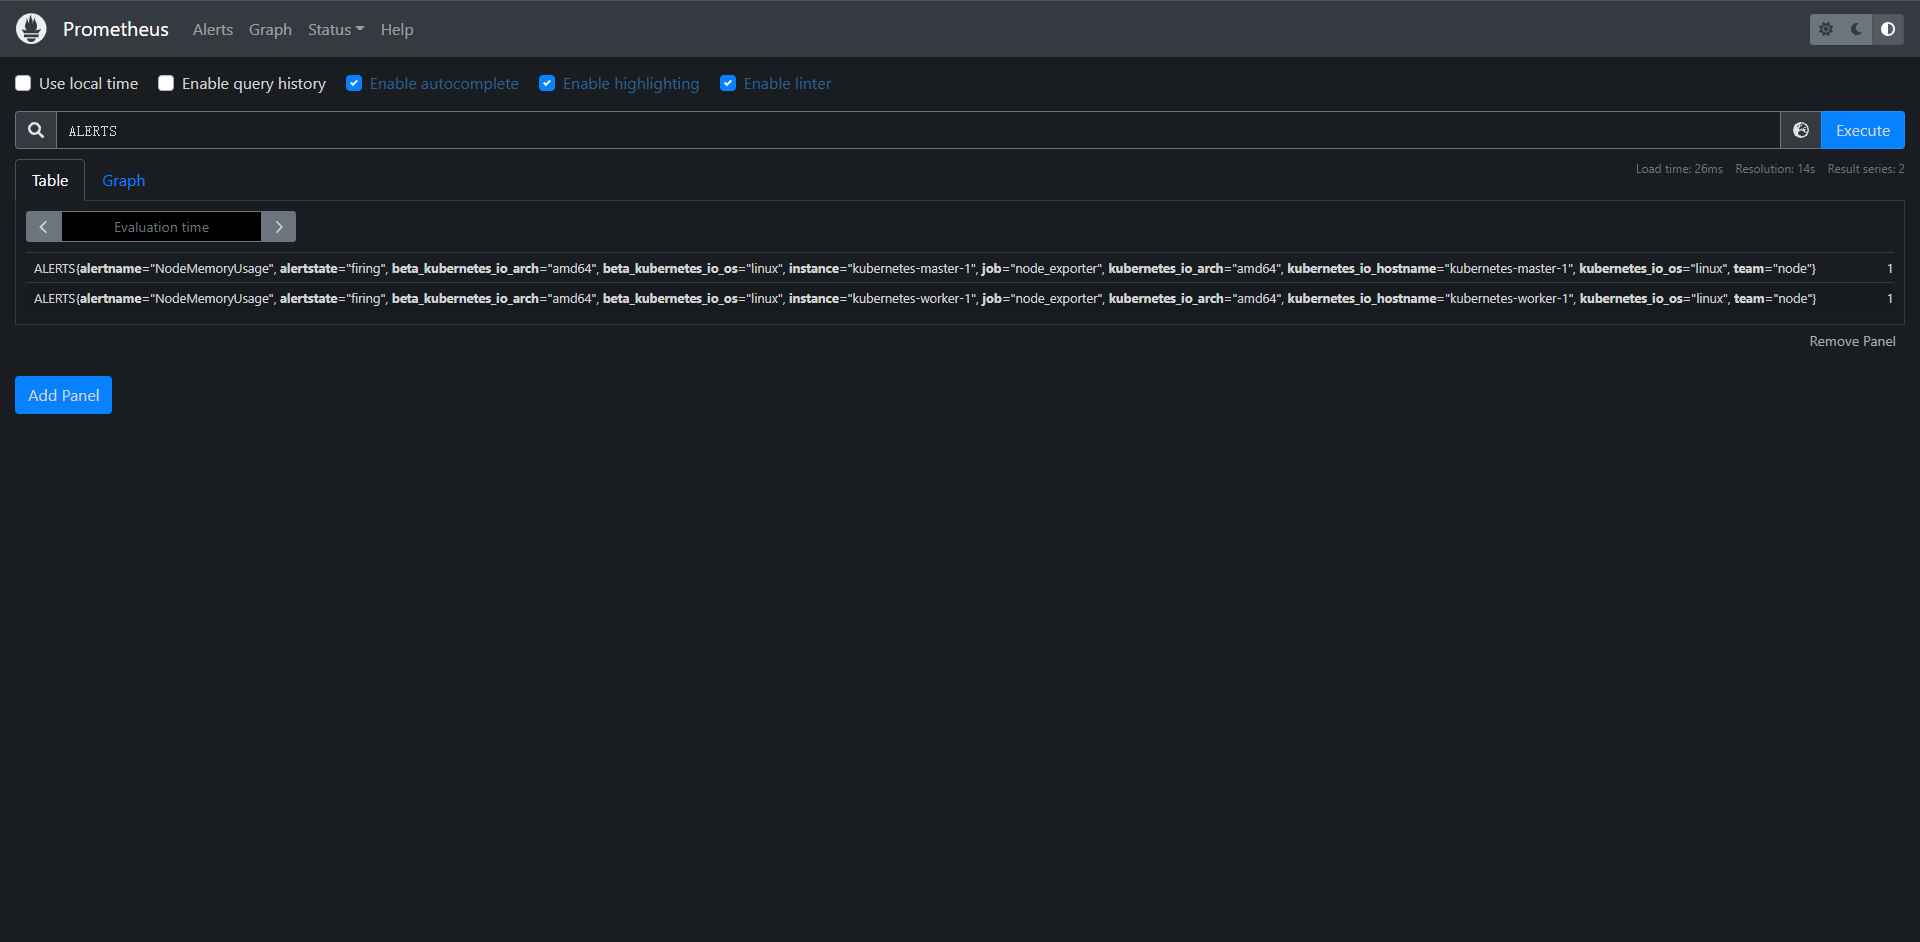
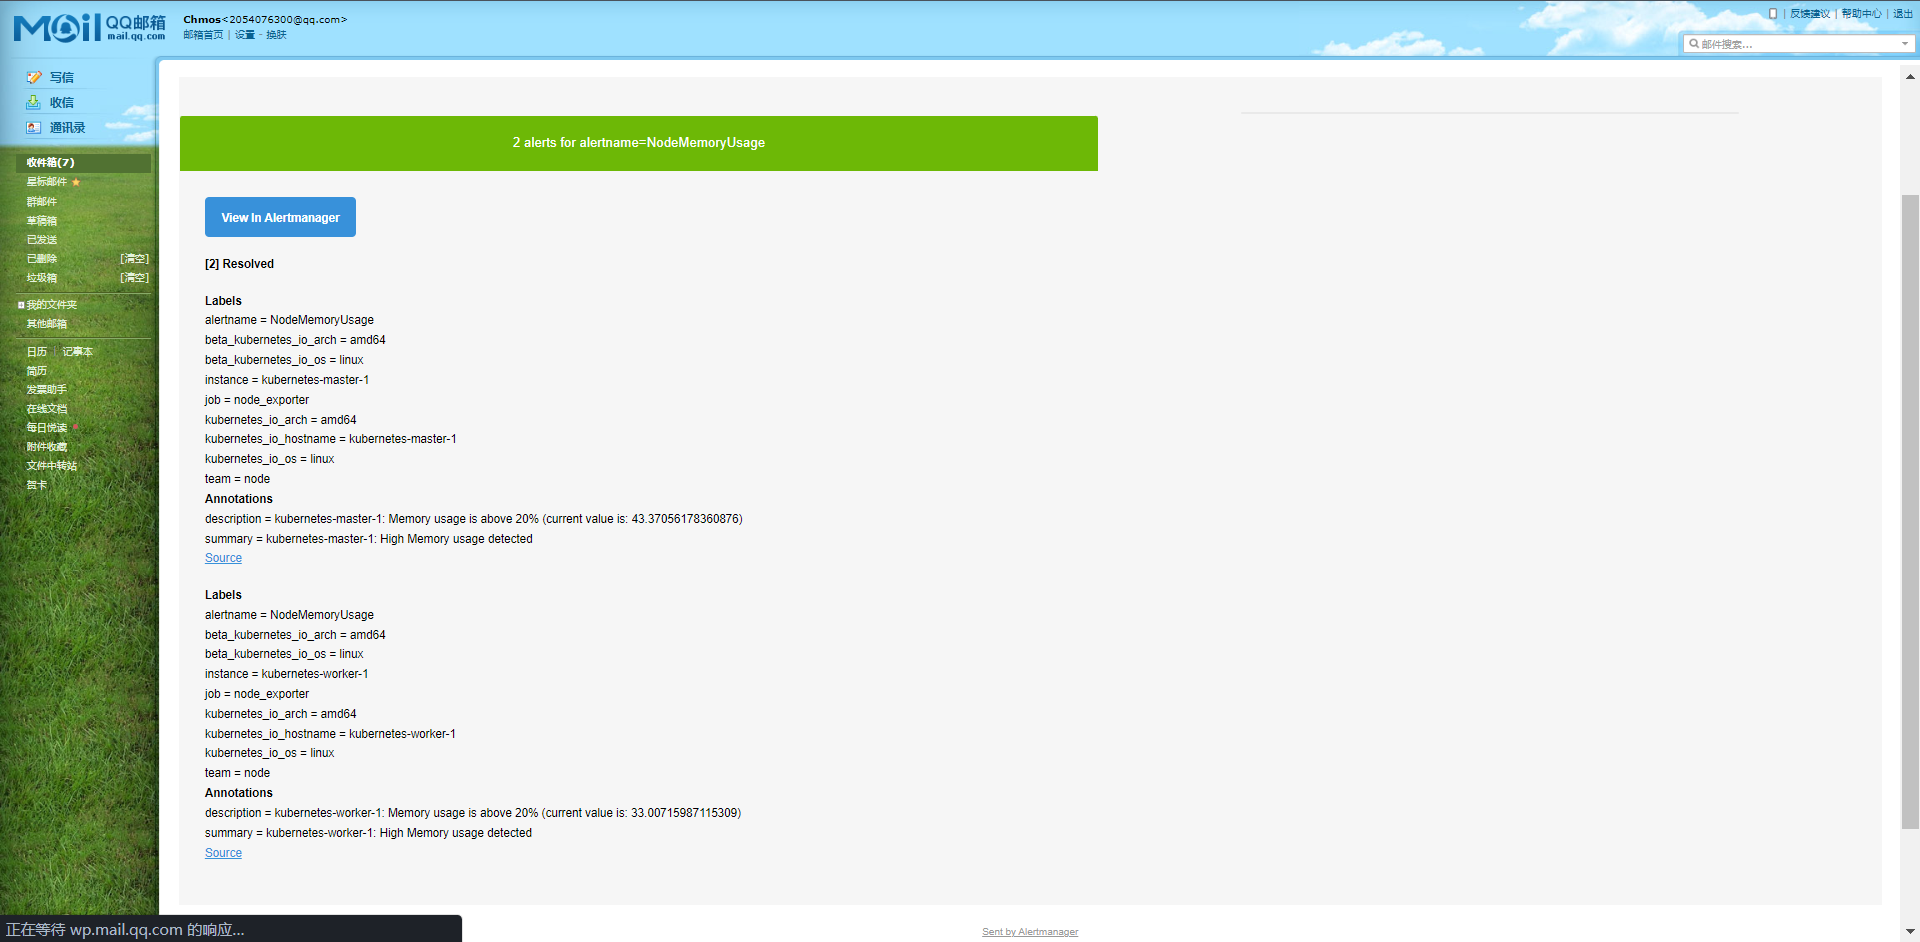
当然Prometheus也可以查看我们的告警规则,还有我们的报警恢复。
18.3:何时报警
在Prometheus与Alertmanager中由很多地方涉及到报警时机的配置,那么我们的报警应该在什么时候报警呢。
首先在Prometheus的全局配置中有一个evaluation_interval属性,该属性表示间隔多长时间对报警规则进行评估,比如我们这里配置了30s,那么每30秒就会去验证一下我们的报警规则是否达到了阈值。
此时我们的报警处于inactive状态,如果评估达到了阈值,则会处于Pending状态,这个时候其实报警还没有发送给Alertmanager,那么什么时候发送呢,这个其实就依赖于报警规则内的for属性配置了,比如我们配置1m,那么也就是说在后续的1m内评估结果都持续达到了阈值,那么就会变成Pending状态,并发送报警给Alertmanager来处理了
比如说有一种情况就是,我们设置的for属性阈值是1m,但是我们的报警阈值只达到了30s就降下去了,这个时候就不会触发告警,它只会处于Pending状态,然后就又退回inactive状态了。
具体什么时候发送报警就要看报警路由给规则如何配置了。核心属性是下面几个:
group_by: ['alertname', 'cluster'] # 报警分组
group_wait: 30s # 在组内等待所配置的时间如果同组内30s出现相同的报警,则使其在一个组内出现
group_interval: 30s # 每个分组中最多30s发送一次告警。
repeat_interval: 1h # 发送报警的时间间隔,如果指定时间内没有恢复,则重新发送告警。
Alertmanager会将收到的报警规则按照group_by进行分组,当一个报警触发之后,如果之前没有分组,那么就会创建一个分组,等创建完之后会等待group_wait这么长时间才会发送报警,这里不会马上发送就是需要积攒一定数量的报警,防止报警数量过多,形成报警风暴。
当一个报警触发后,如果这么报警属于某个group,但这个group距离第一个alert已经足够group_wait时间了,发送给一次了,那么会等待group_interval时间再次发送新的告警group了
这里我们在报警规则内新增一个关于CPU的报警
groups:
...
- name: Test_CPU_Node
rules:
- alert: NodeCPUUsage
expr: ((1 - sum(increase(node_cpu_seconds_total{mode="idle"}[1m])) by (instance) / sum(increase(node_cpu_seconds_total[1m])) by (instance) ) * 100) > 1
for: 2m
labels:
team: node
annotations:
summary: "{{$labels.instance}}: High CPU usage detected"
description: "{{$labels.instance}}: CPU usage is above 1% (current value is: {{ $value }})"
重载Prometheus
curl -X POST http://10.0.0.10:31656/-/reload
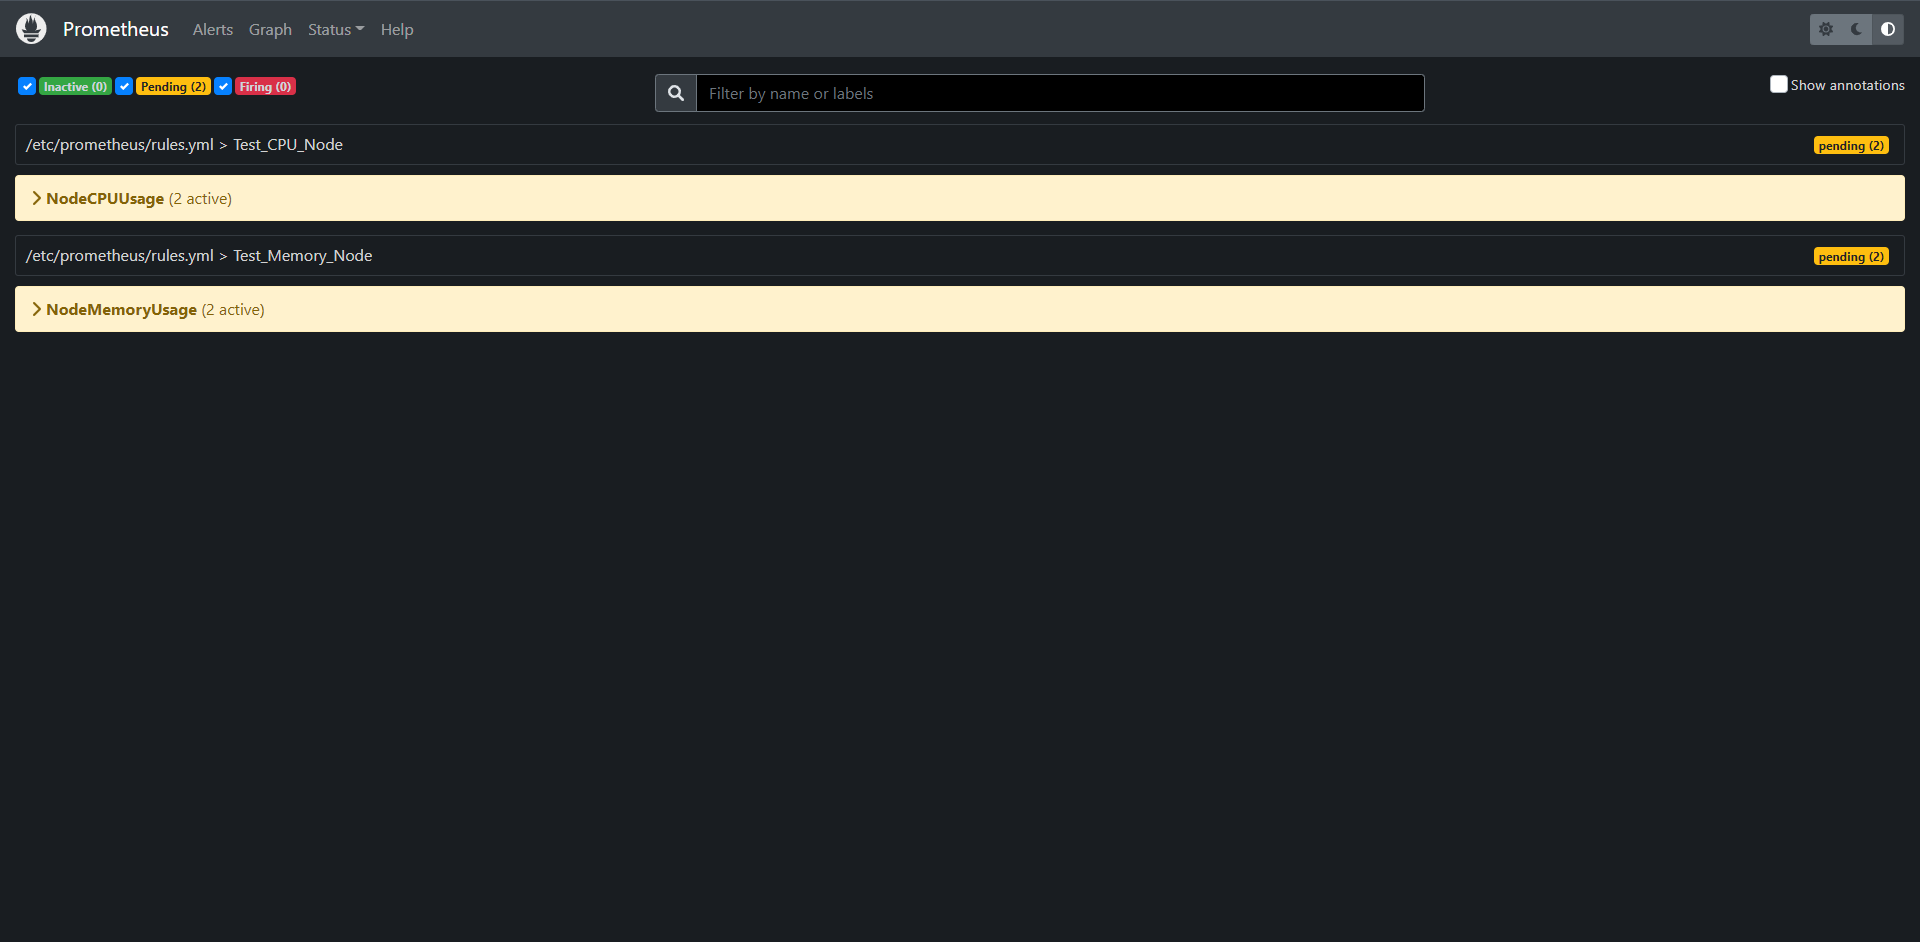
这个时候阈值已经触发了,但是还没有触发告警
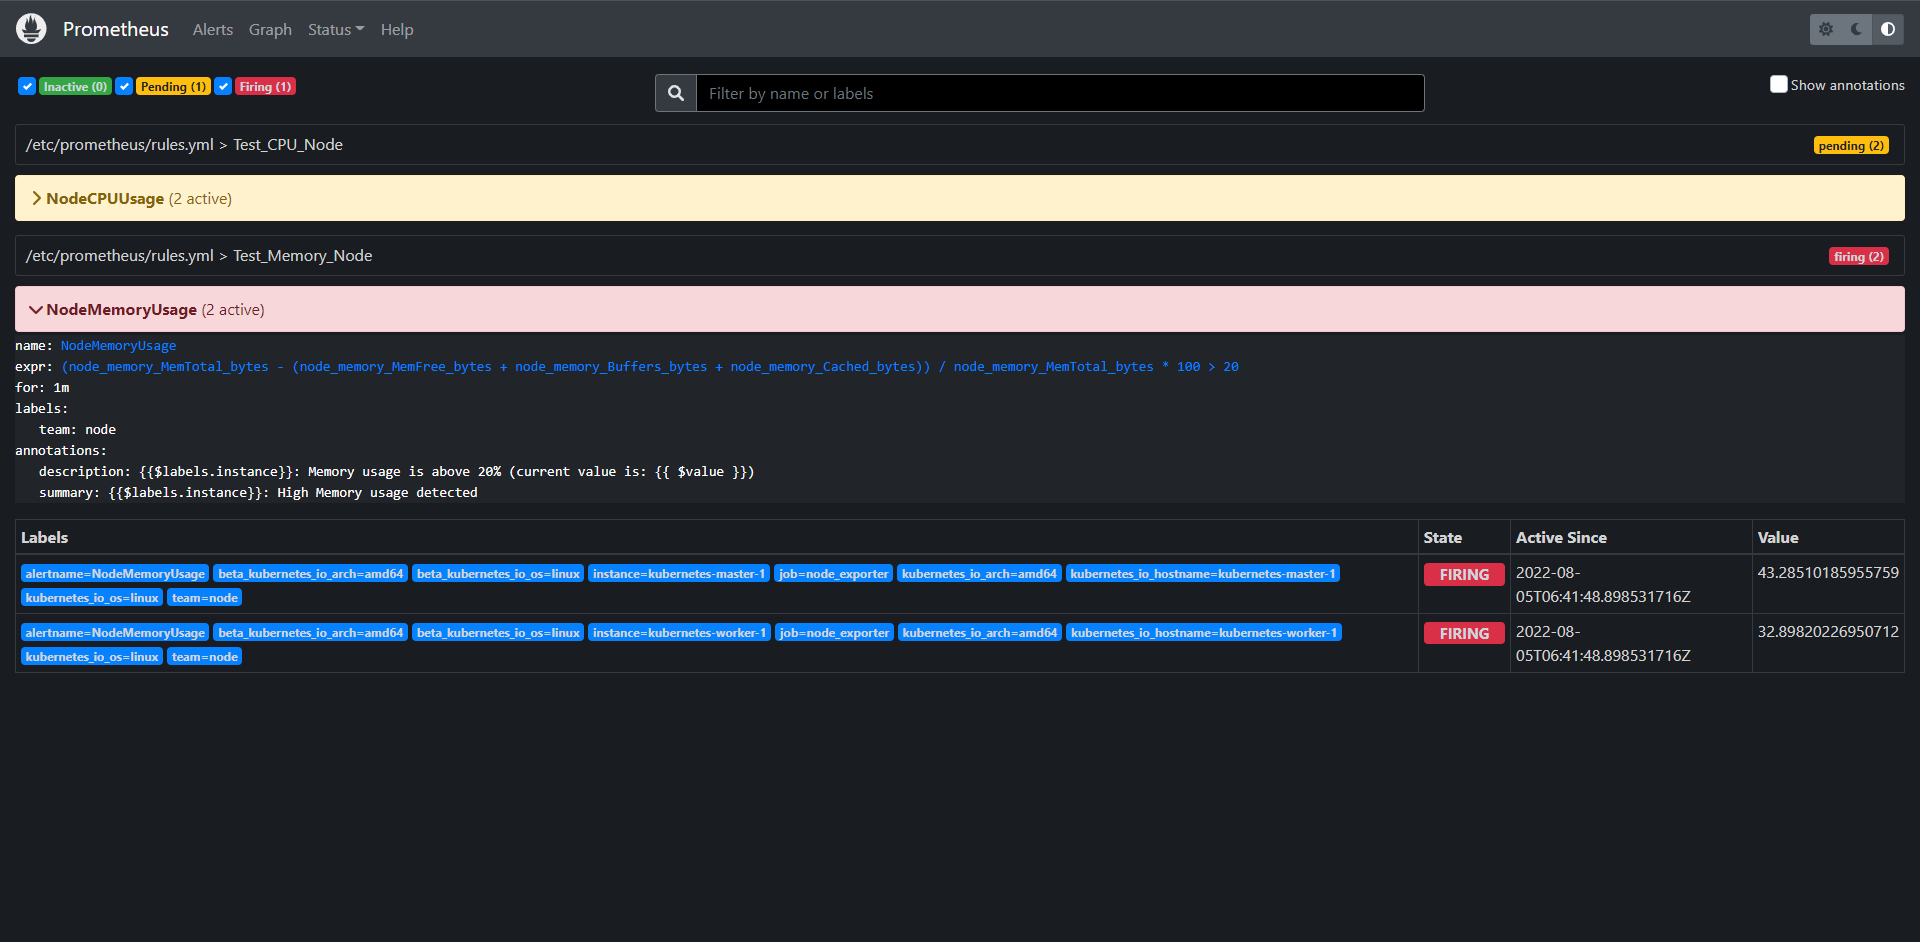

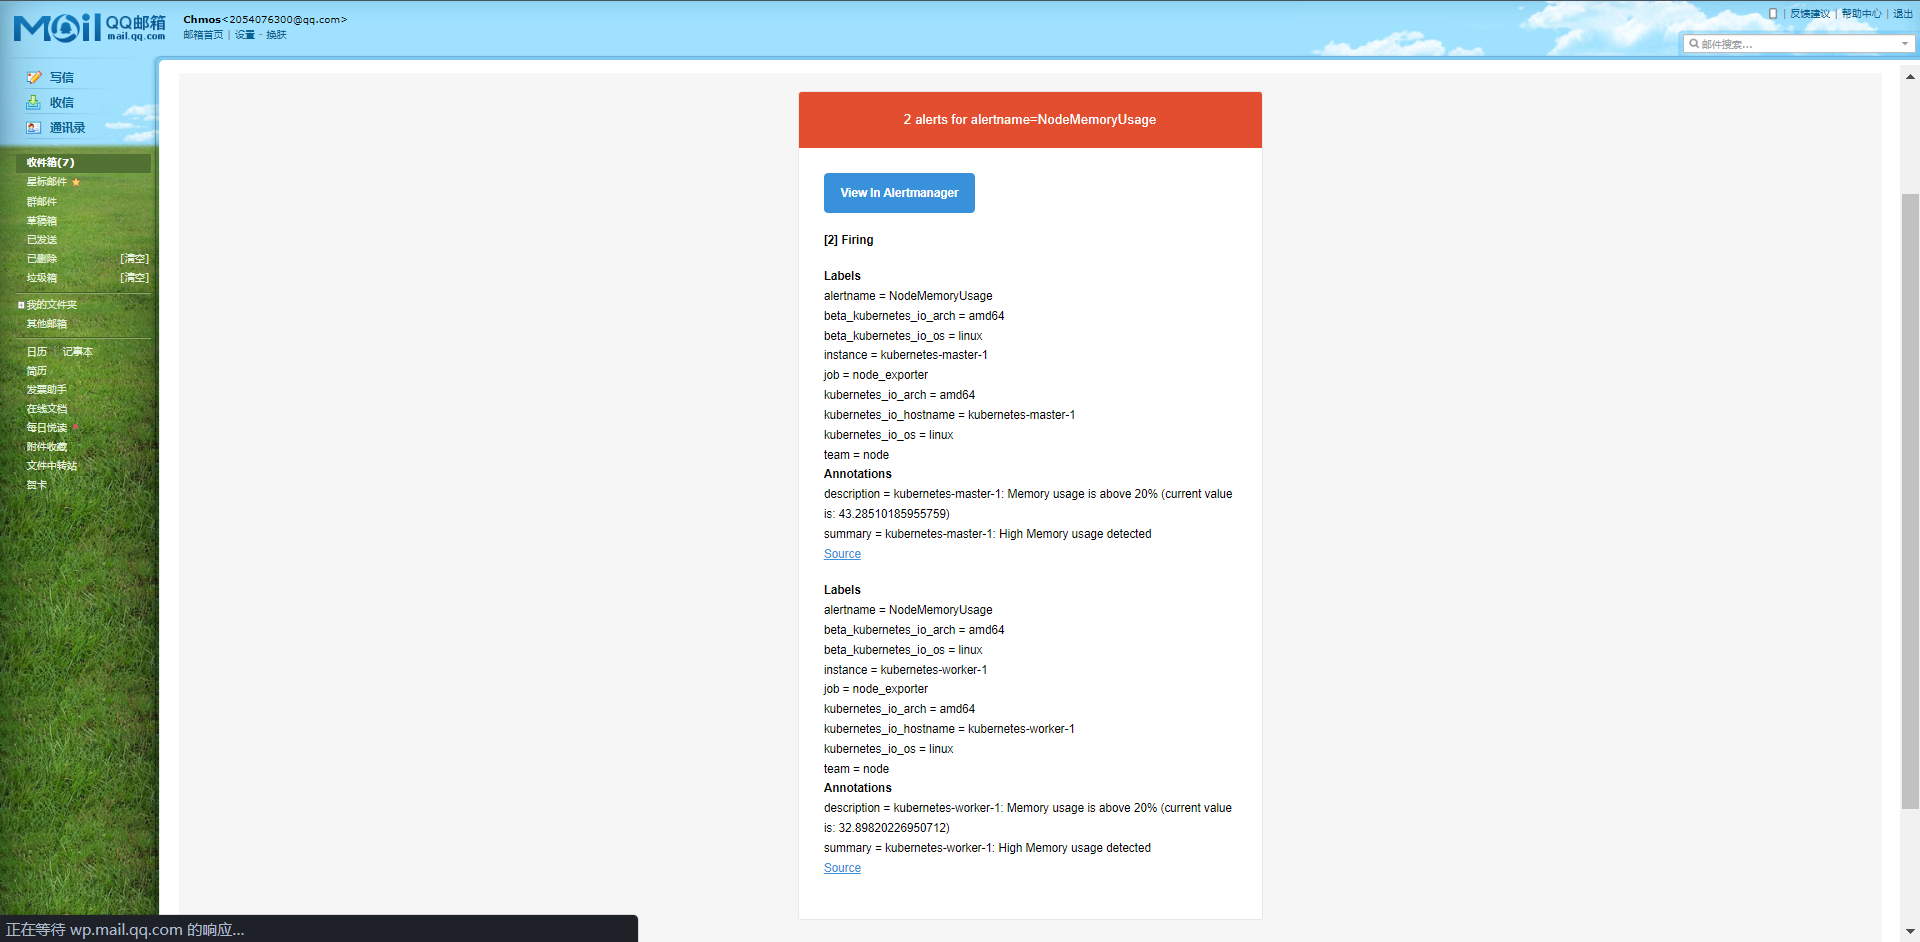
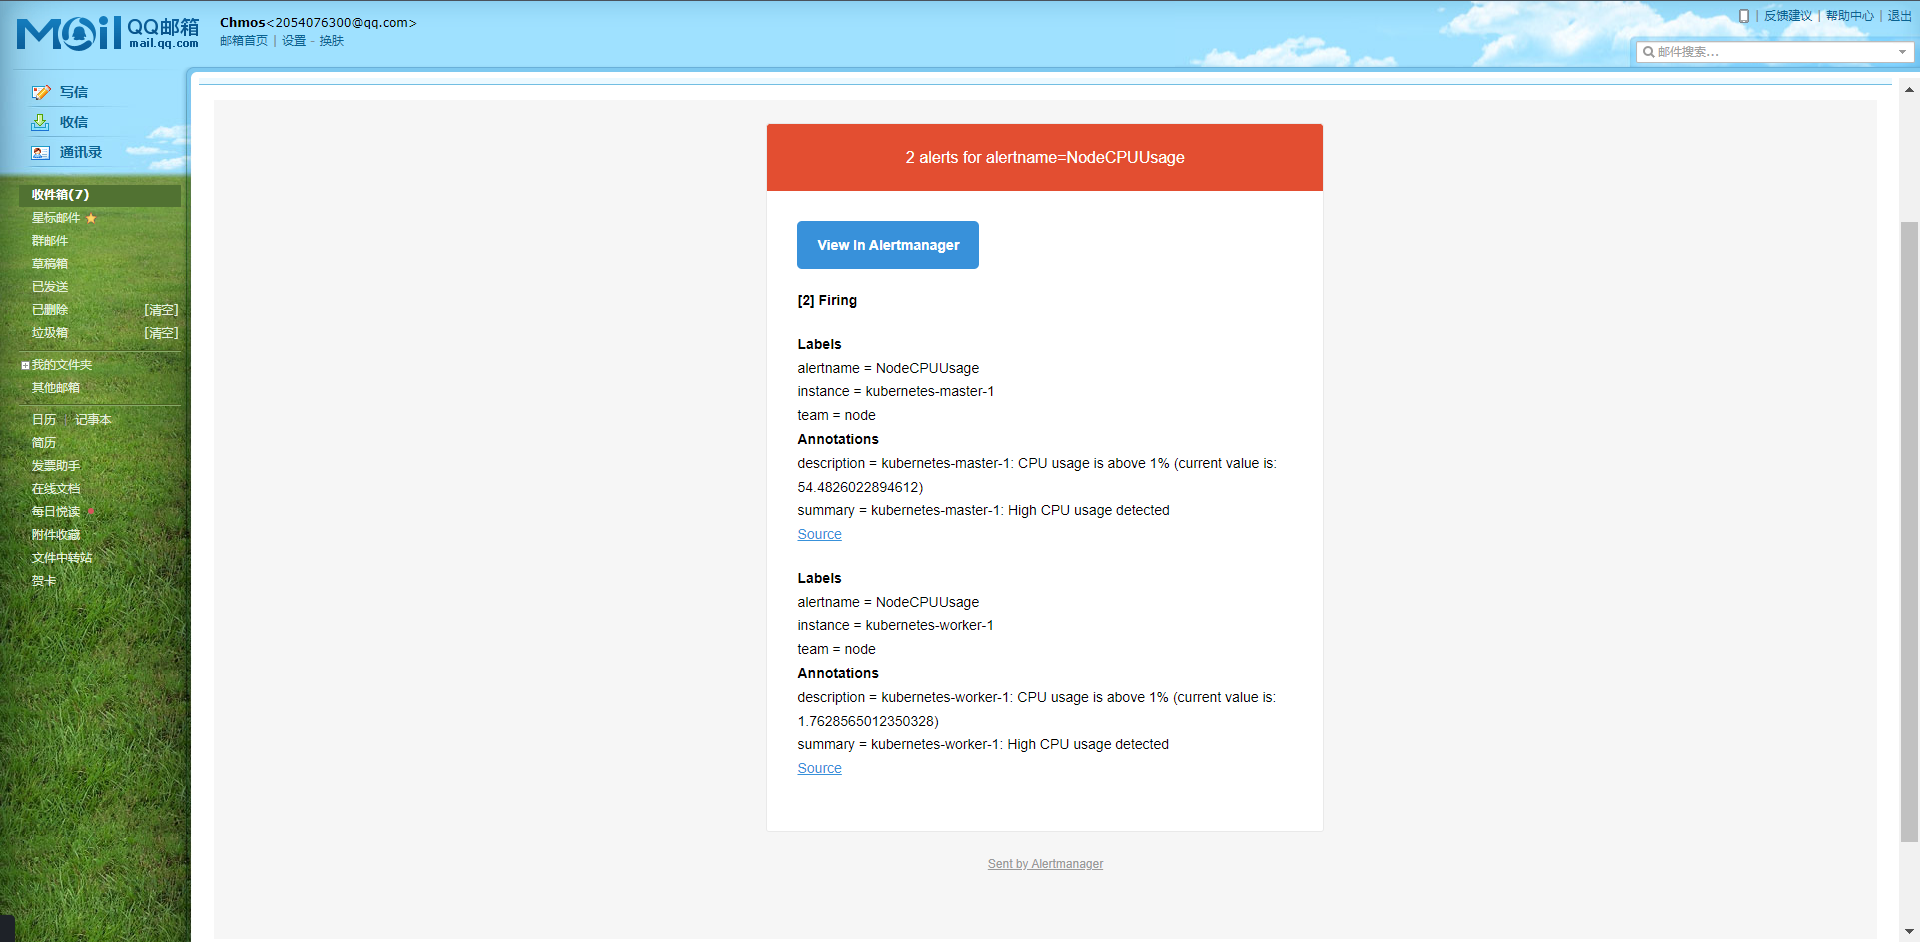
因为memory的for比CPU的for短,所以它先触发告警,后面一分钟后CPU相继触发告警,但是这里面其实有一个坑,就是我们来看一下这个PromQL执行出来的结果
PromQL:((1 - sum(increase(node_cpu_seconds_total{mode="idle"}[1m])) by (instance) / sum(increase(node_cpu_seconds_total[1m])) by (instance) ) * 100) > 1
它是以instance分组的,所以这个时候我们其实需要去alertmanager的配置内添加以下路由的,至于为什么上面的没有匹配也收到邮件是因为我们配置有默认的接收方式也是这个邮箱。
routes:
- receiver: email
group_by: ['instance']
group_wait: 10s
match:
team: node
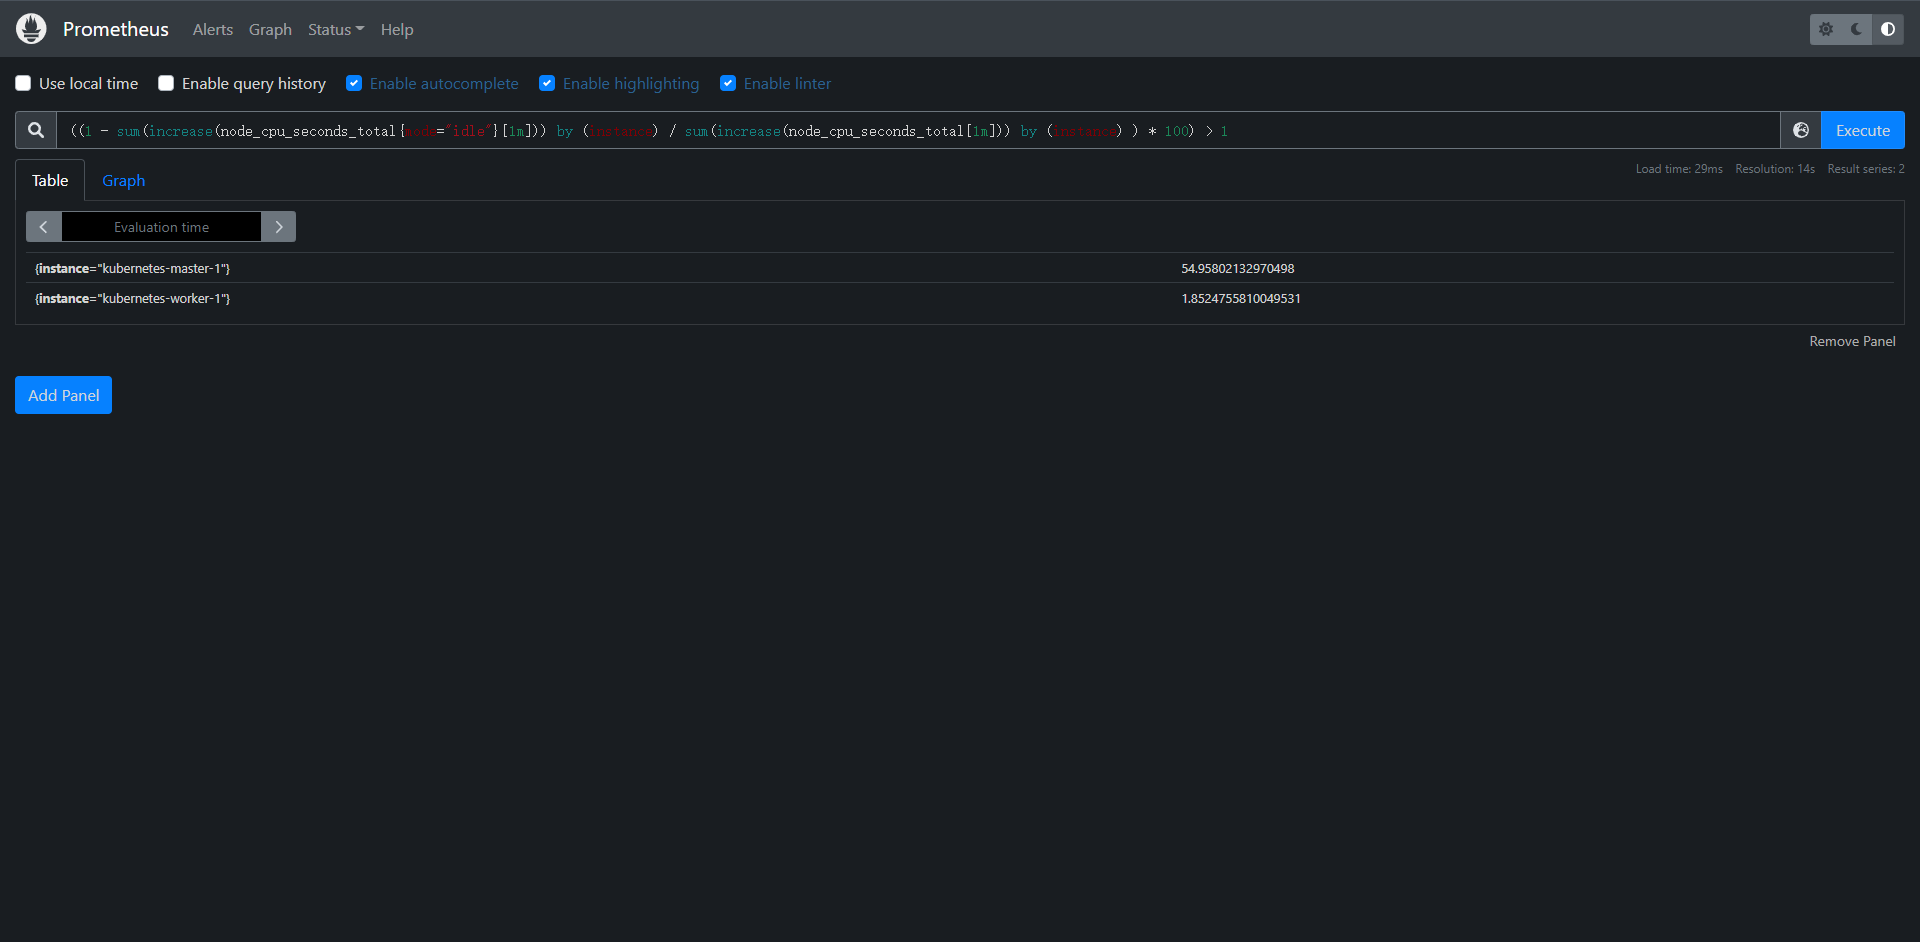
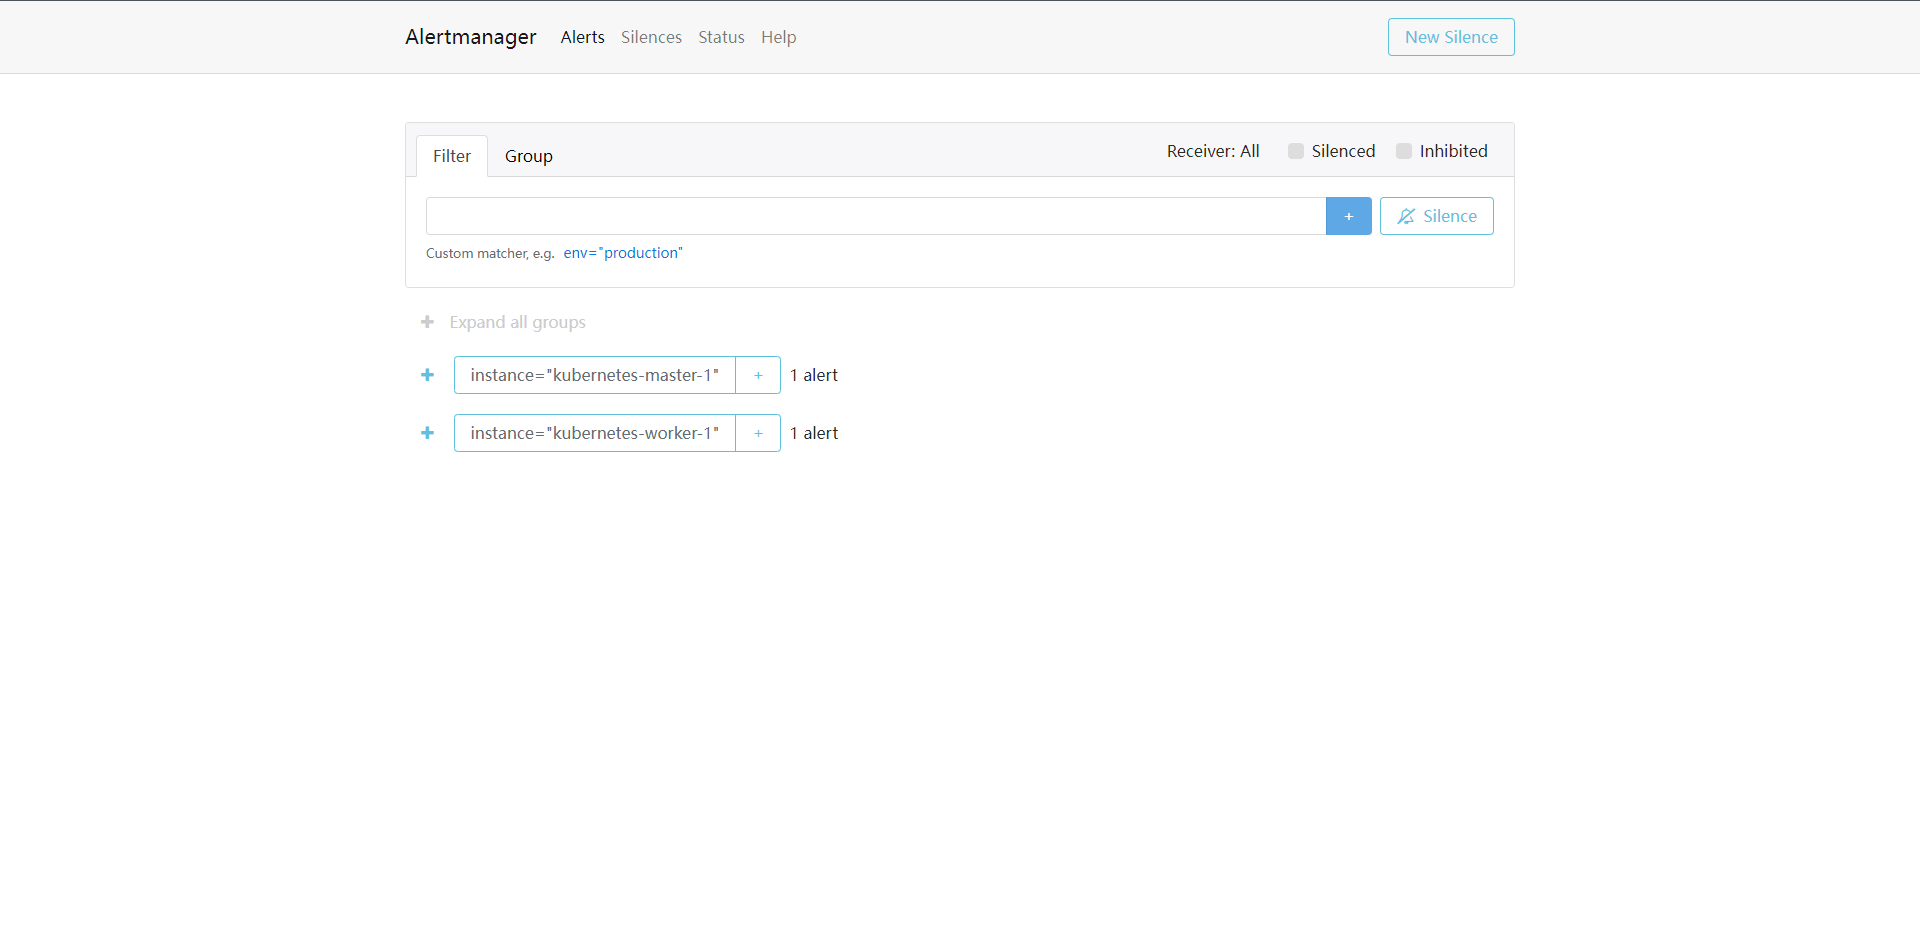
18.4:告警模板
我们接收到的告警其实都是默认的,因为它已经编译到二进制包内了,所以我们不需要额外配置,如果我们想自定义模板,这又如何配置呢?
Alertmanager默认使用的通知模板可以从:https://github.com/prometheus/alertmanager/blob/master/template/default.tmpl获取。
Alertmanager的通知模板是基于Golang的模板系统。当然也支持用户自定义和使用自己的模板。
第一种方式是基于模板字符串,直接在Alertmanager的配置文件中使用模板字符串:
receivers:
- name: "slack-notifucations"
slack_configs:
- channel: "#alerts"
text: "https://intarnal.myorg.net/wiki/alerts/{{ .GroupLabels.app }}/{{ .GroupLabels.alertname }}"
直接在配置文件中使用一些模板字符串,比如 `{{ .GroupLabels.app }}` 下面的一些属性。
另外一种就是直接修改官方的模板,此外也可以自定义可复用的模板文件,比如针对email的模板,我们可以创建一个名为template_email.tmpl自定义模板文件:
# 指定template文件位置
templates:
- '/etc/alertmanager/template_email.tmpl'
receivers:
- name: 'default'
email_configs:
- to: '2054076300@qq.com'
send_resolved: true
- name: 'email'
email_configs:
- to: '2054076300@qq.com'
send_resolved: true
html: '{{ template "email.html" . }}'
template_email.tmpl: |-
{{ define "email.html" }}
{{- if gt (len .Alerts.Firing) 0 -}}{{ range .Alerts }}
@报警<br>
<strong>实例:</strong> {{ .Labels.instance }}<br>
<strong>概述:</strong> {{ .Annotations.summary }}<br>
<strong>详情:</strong> {{ .Annotations.description }}<br>
<strong>时间:</strong> {{ (.StartsAt.Add 28800e9).Format "2006-01-02 15:04:05" }}<br>
{{ end }}{{ end -}}<br>
{{- if gt (len .Alerts.Resolved) 0 -}}{{ range .Alerts }}<br>
@恢复<br>
<strong>实例:</strong> {{ .Labels.instance }}<br>
<strong>信息:</strong> {{ .Annotations.summary }}<br>
<strong>恢复:</strong> {{ (.StartsAt.Add 28800e9).Format "2006-01-02 15:04:05" }}<br>
{{ end }}{{ end -}}
{{- end }}
触发一下告警试一下
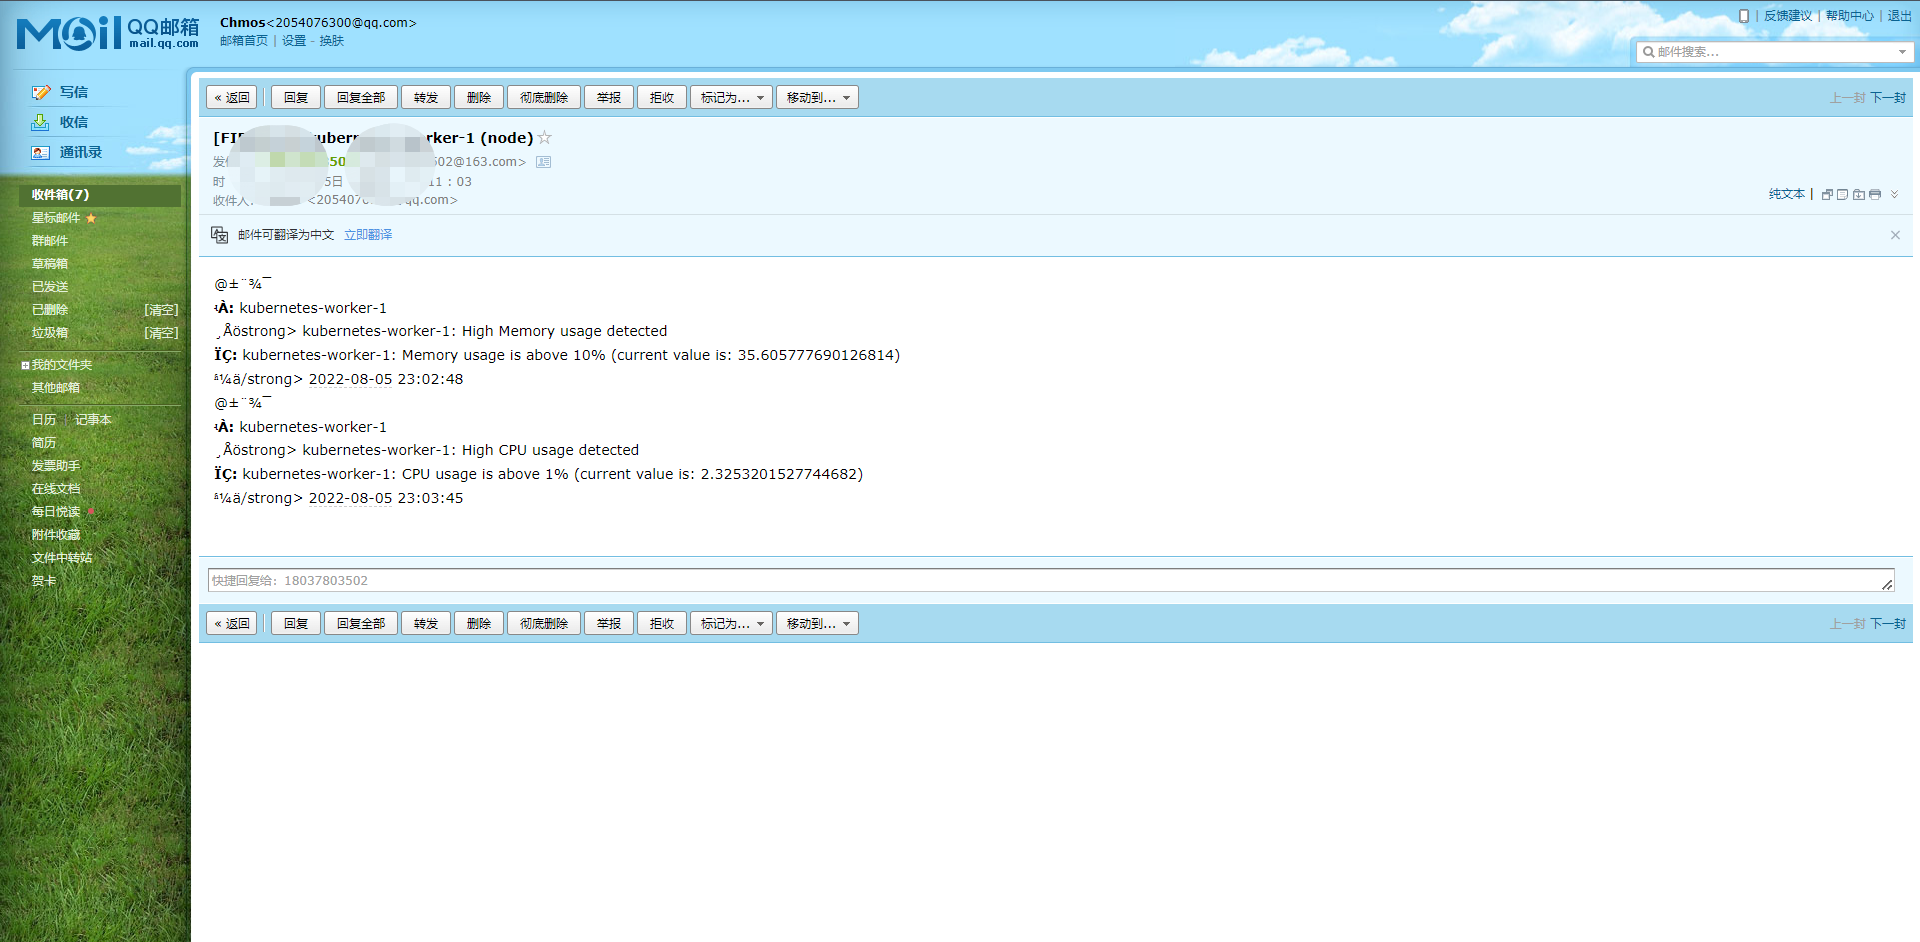
最后是这样的,不要问我为什么我的有乱码,因为我的在创建configmap的时候我的主机是英文,无法识别中文,所以,问题不大,我修复一下。

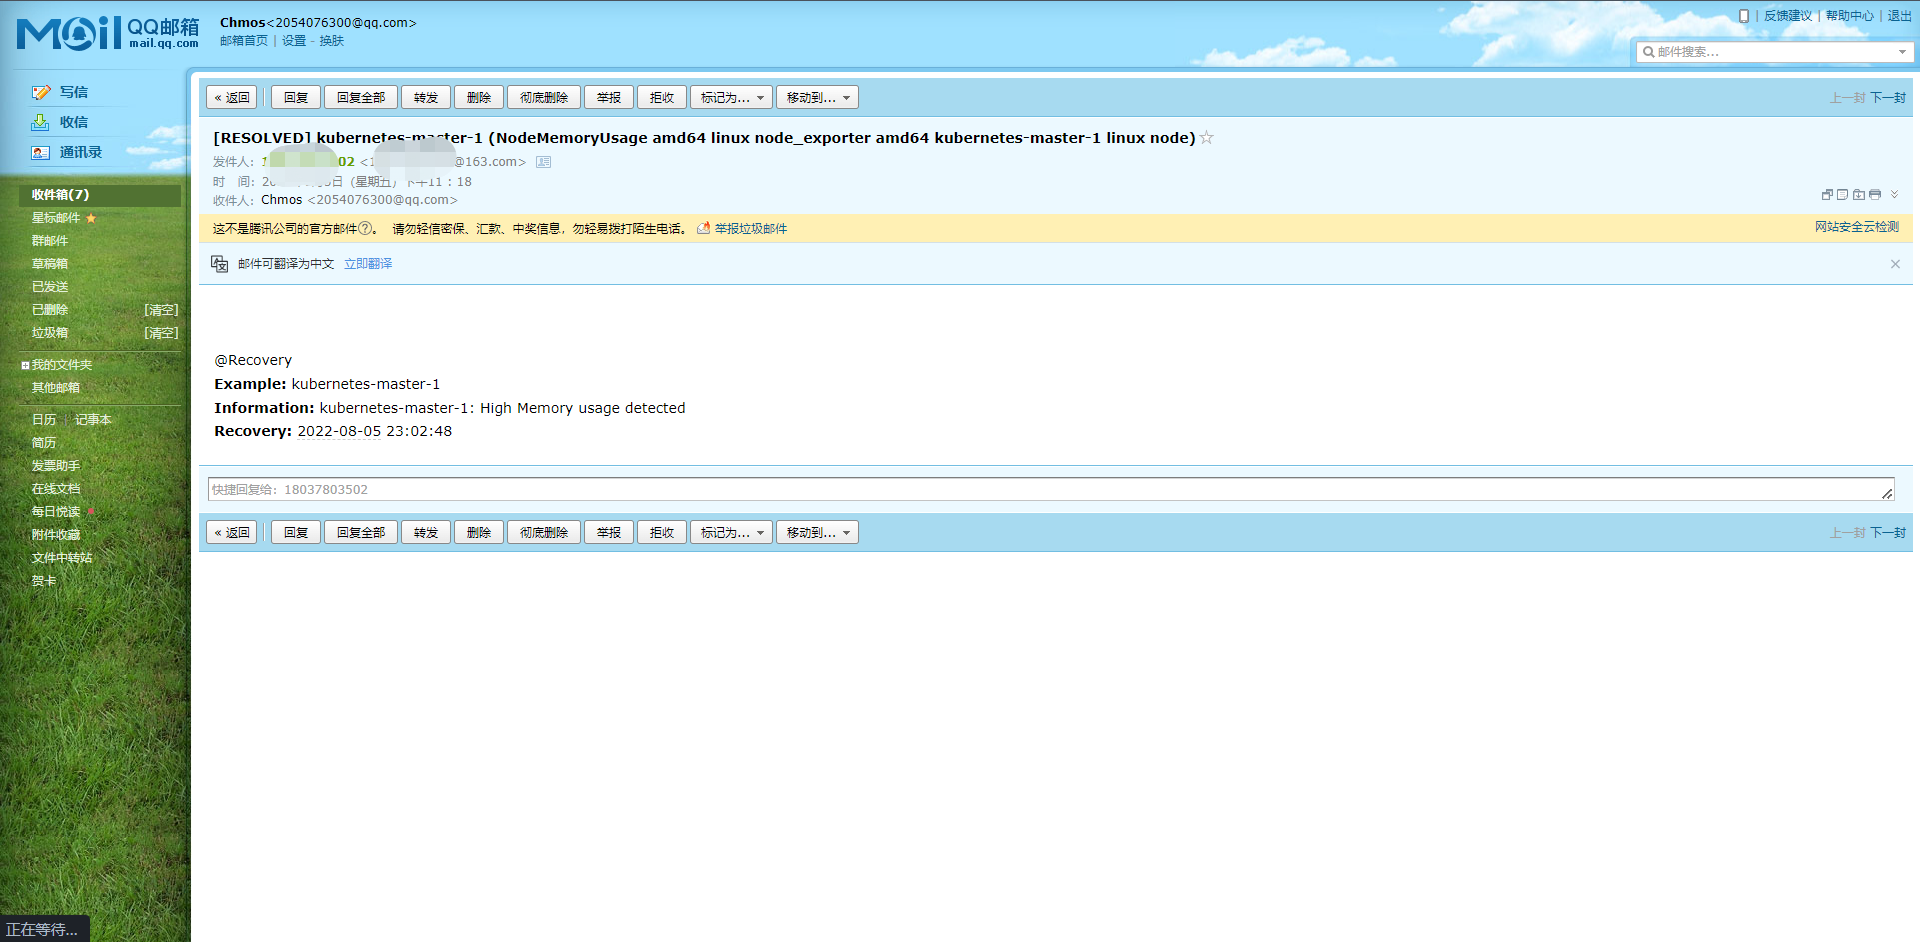
完成之后是这样的。
18.5:WebHook接收器
上面我们看到的是Alertmanager自带的邮件报警模板和自定义的报警模板。我们也说Alertmanager支持很多种报警接收器,比如slack,微信之类的,其中最为灵活的当然也就是WebHook了,我们可以自定义一个webhook来接收报警信息,然后在webhook里面去处理,需要发送怎样的报警信息我们自定义就可以,
这里的webhook程序引用的是阳明大佬的,有兴趣可以关注一下阳明大佬的Github:https://github.com/cnych
接下来我们去创建一个webhook程序
---
apiVersion: v1
kind: ConfigMap
metadata:
name: promoter-conf
namespace: kube-monitor
data:
config.yaml: |
global:
prometheus_url: http://prometheus:9090
dingtalk_api_token: xxxxxxxxxxxxxxxxxxxxxxxxxxxxxxxxxxxxxxxx
dingtalk_api_secret: xxxxxxxxxxxxxxxxxxxxxxxxxxxxxxxxxxxxxxxxxxx
s3:
access_key: xxxxxxxxxxxxxxxxxxxxxxxxxxxx
secret_key: xxxxxxxxxxxxxxxxxxxxxxxxx
endpoint: xxxxxxxxxxxxxxxxxxxxxxxxxx
region: xxxxxxxxxxxxxxx
bucket: xxxxxxxxxxxxxxxxx
receivers:
- name: dingtalk
dingtalk_configs:
- message_type: markdown
at:
atMobiles: [ "123456" ]
isAtAll: false
markdown:
title: '{{ template "dingtalk.default.title" . }}'
text: '{{ template "dingtalk.default.content" . }}'
---
apiVersion: apps/v1
kind: Deployment
metadata:
name: promoter
namespace: kube-monitor
labels:
app: promoter
spec:
selector:
matchLabels:
app: promoter
template:
metadata:
labels:
app: promoter
spec:
volumes:
- name: config
configMap:
name: promoter-conf
- name: timezone
hostPath:
path: /etc/localtime
containers:
- name: promoter
image: cnych/promoter:main
args:
- "--config.file=/etc/promoter/config.yaml"
ports:
- containerPort: 8080
volumeMounts:
- mountPath: "/etc/promoter"
name: config
- mountPath: /etc/localtime
name: timezone
readOnly: true
---
apiVersion: v1
kind: Service
metadata:
name: promoter
namespace: kube-monitor
labels:
app: promoter
spec:
selector:
app: promoter
ports:
- port: 8080
[root@kubernetes-master-1 promoter]# kubectl apply -f promoter.yaml
configmap/promoter-conf created
deployment.apps/promoter created
service/promoter created
# 部署完成之后呢,我们需要去Alertmanager也改一下
[root@kubernetes-master-1 alertmanager]# cat config.yaml
kind: ConfigMap
apiVersion: v1
metadata:
name: alert-config
namespace: kube-monitor
data:
config.yml: |-
global:
resolve_timeout: 5m
smtp_smarthost: 'smtp.163.com:465'
smtp_from: 'xxxxxxxxxxxxx@163.com'
smtp_auth_username: 'xxxxxxxxxx@163.com'
smtp_auth_password: 'xxxxxxxxxxxx'
smtp_hello: '163.com'
smtp_require_tls: false
route:
group_by: ['alertname', 'cluster']
group_wait: 30s
group_interval: 30s
repeat_interval: 1h
receiver: default
routes:
- receiver: webhook
group_by: ['instance']
group_wait: 10s
match:
team: node
templates:
- '/etc/alertmanager/template_email.tmpl'
receivers:
- name: 'default'
email_configs:
- to: '2054076300@qq.com'
send_resolved: true
- name: 'email'
email_configs:
- to: '2054076300@qq.com'
send_resolved: true
html: '{{ template "email.html" . }}'
- name: "webhook"
webhook_configs:
- url: 'http://promoter:8080/dingtalk/send' # 这里的dingtalk和promoter下receivers的name一致
send_resolved: true
template_email.tmpl: |-
{{ define "email.html" }}
{{- if gt (len .Alerts.Firing) 0 -}}{{ range .Alerts }}
@Alert<br>
<strong>Example:</strong> {{ .Labels.instance }}<br>
<strong>Information:</strong> {{ .Annotations.summary }}<br>
<strong>Details:</strong> {{ .Annotations.description }}<br>
<strong>Time:</strong> {{ (.StartsAt.Add 28800e9).Format "2006-01-02 15:04:05" }}<br>
{{ end }}{{ end -}}<br>
{{- if gt (len .Alerts.Resolved) 0 -}}{{ range .Alerts }}<br>
@Recovery<br>
<strong>Example:</strong> {{ .Labels.instance }}<br>
<strong>Information:</strong> {{ .Annotations.summary }}<br>
<strong>Recovery:</strong> {{ (.StartsAt.Add 28800e9).Format "2006-01-02 15:04:05" }}<br>
{{ end }}{{ end -}}
{{- end }}
# 重建ConfigMap和alertmanager的Pod,然后触发一下告警
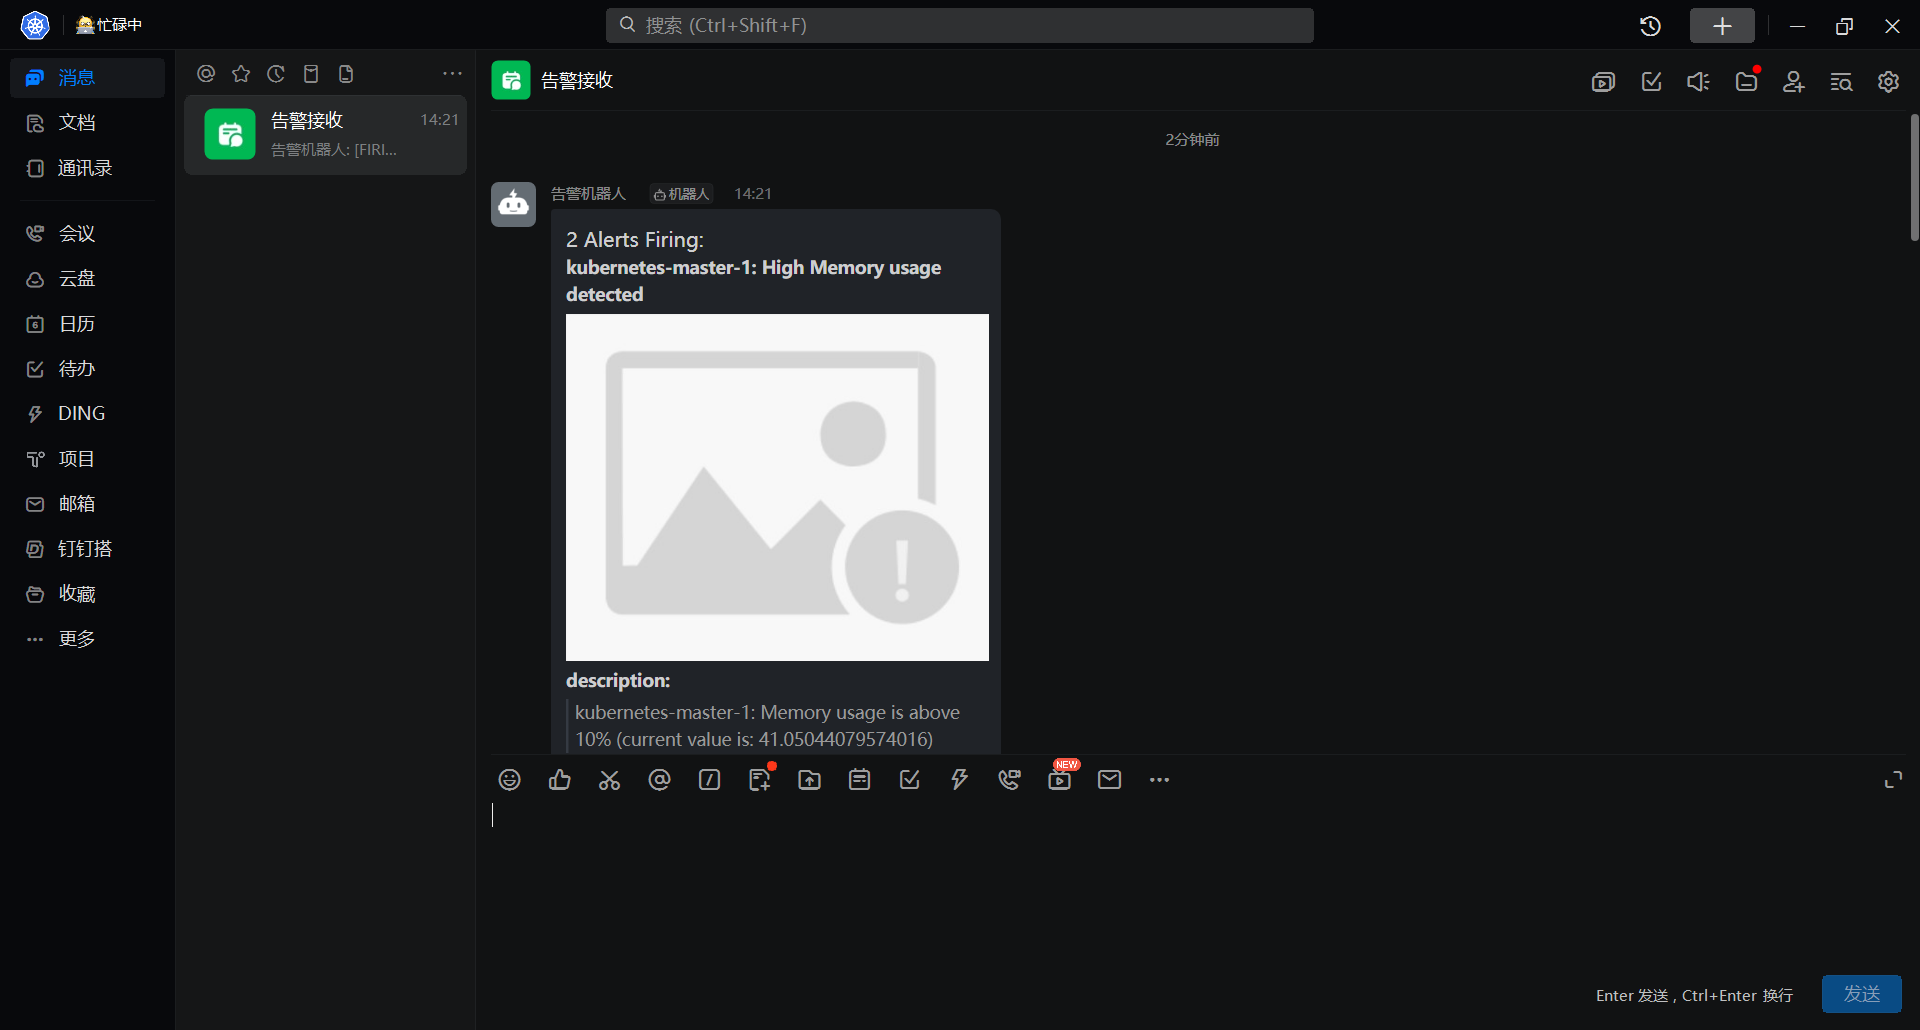
图片的问题可能是因为兼容不是特别好导致的,我这里用的是腾讯云的COS而不是阿里云的OSS,告警模板各位可以去Github上找找配置内有一个template内大家自己改自己打包镜像。
18.6:企业微信接收器
接上次我们使用了钉钉的WebHook接入的告警,这次我们接入的是企业微信的告警。其实原理是一样的,我们还是借用阳明开发的WebHook程序来做:
配置方法大致和钉钉一致
---
apiVersion: v1
kind: ConfigMap
metadata:
name: promoter-conf
namespace: kube-monitor
data:
config.yaml: |
global:
prometheus_url: http://prometheus:9090 # prometheus地址
wechat_api_secret: 应用 sk
wechat_api_corp_id: 企业ID
s3:
access_key: <对象存储AK>
secret_key: <对象存储SK>
endpoint: <对象存储地址>
region: <区域>
bucket: <桶>
receivers:
- name: wechat
wechat_configs:
- agent_id: XXXXXXX <应用ID>
to_user: "@all"
message_type: markdown
message: '{{ template "wechat.default.message" . }}'
Alertmanager只需要改一下发送的name为wechat就行了,然后我们触发一下,程序对接企业微信可能有点问题,但是其实在对象存储内已经有了图片,证明webhook程序是正常运行的。
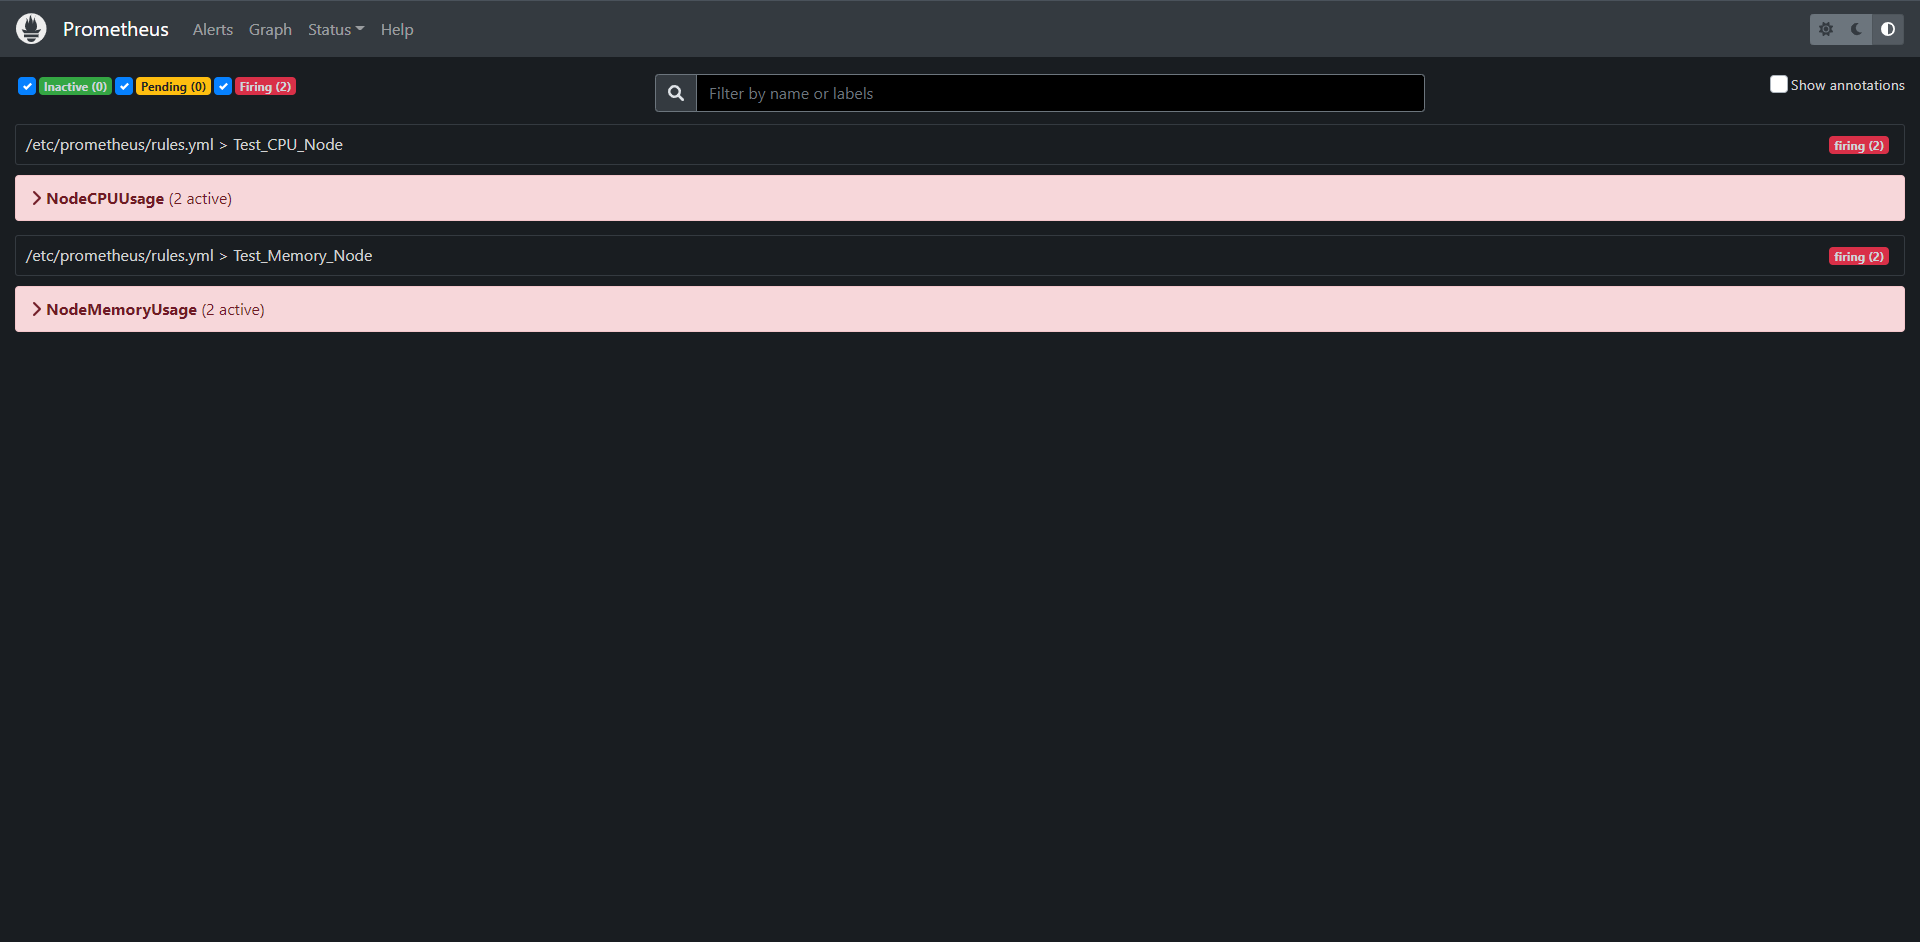
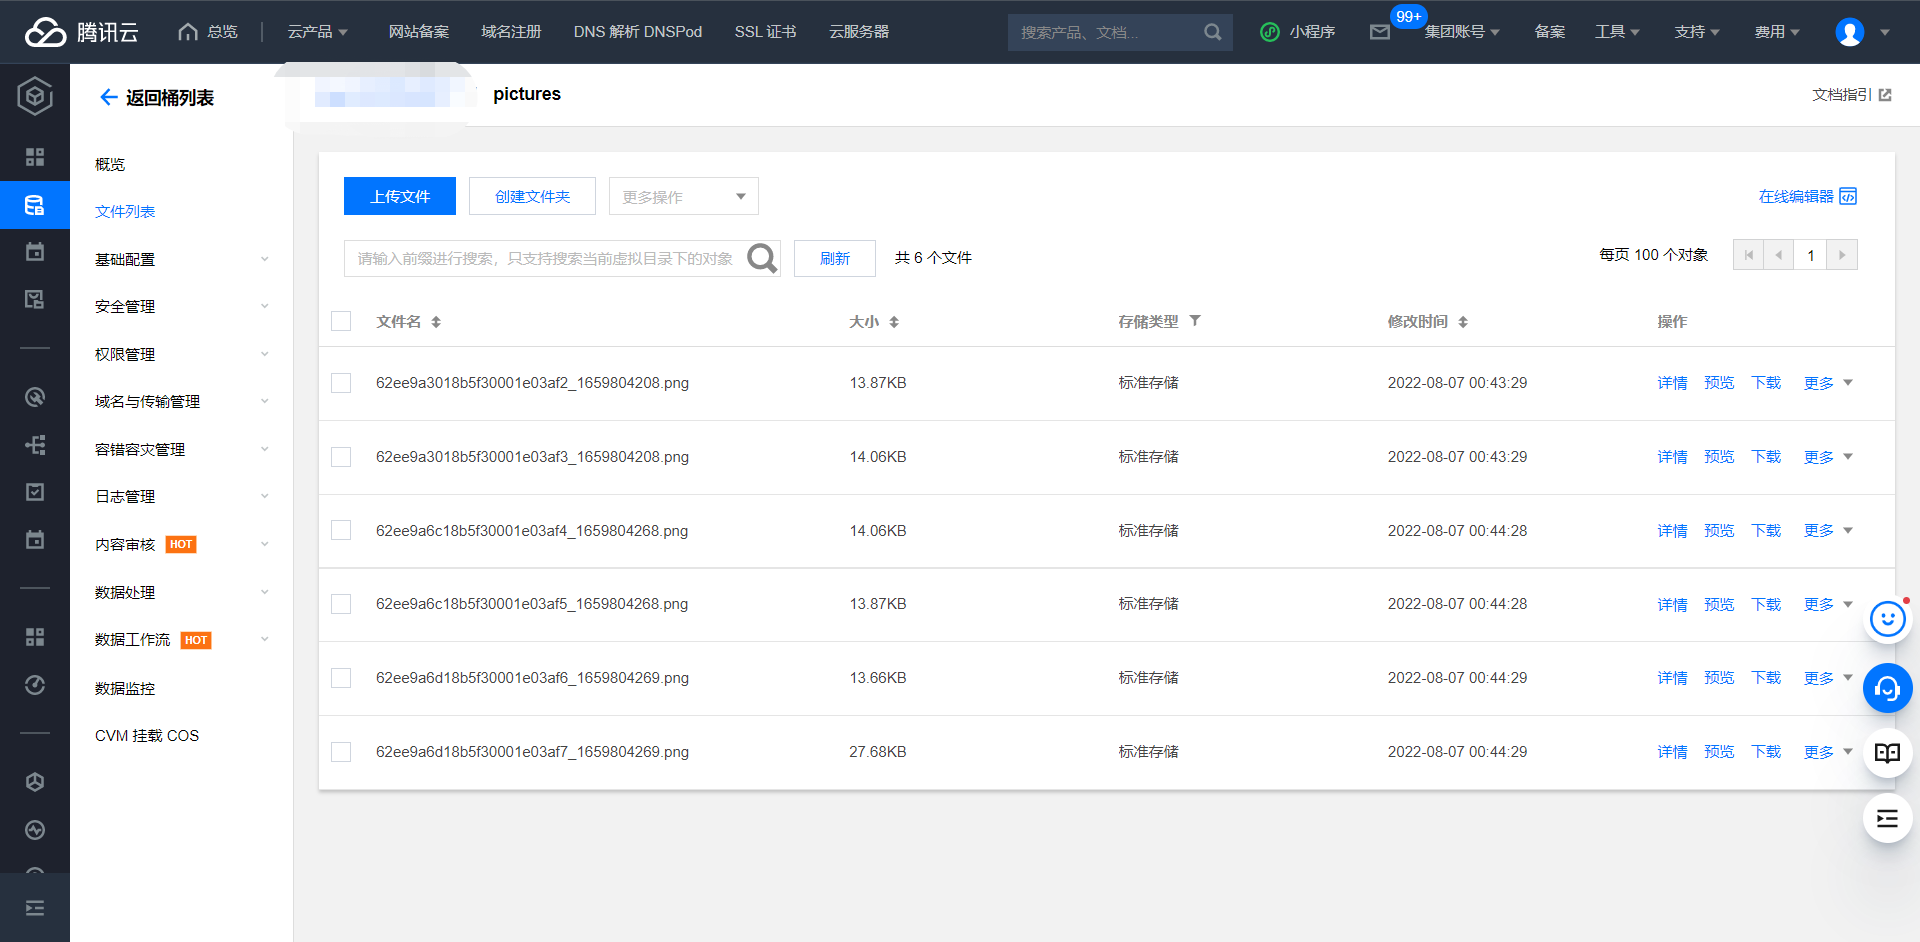
18.7:静默通知
有时候可能报警太过于频繁,或者在收到告警后就去处理问题了,这个期间可能报警还在频繁的发送,这个时候我们可以对报警进行静默设置,在Alertmanager后台页面中提供了静默操作的接口。
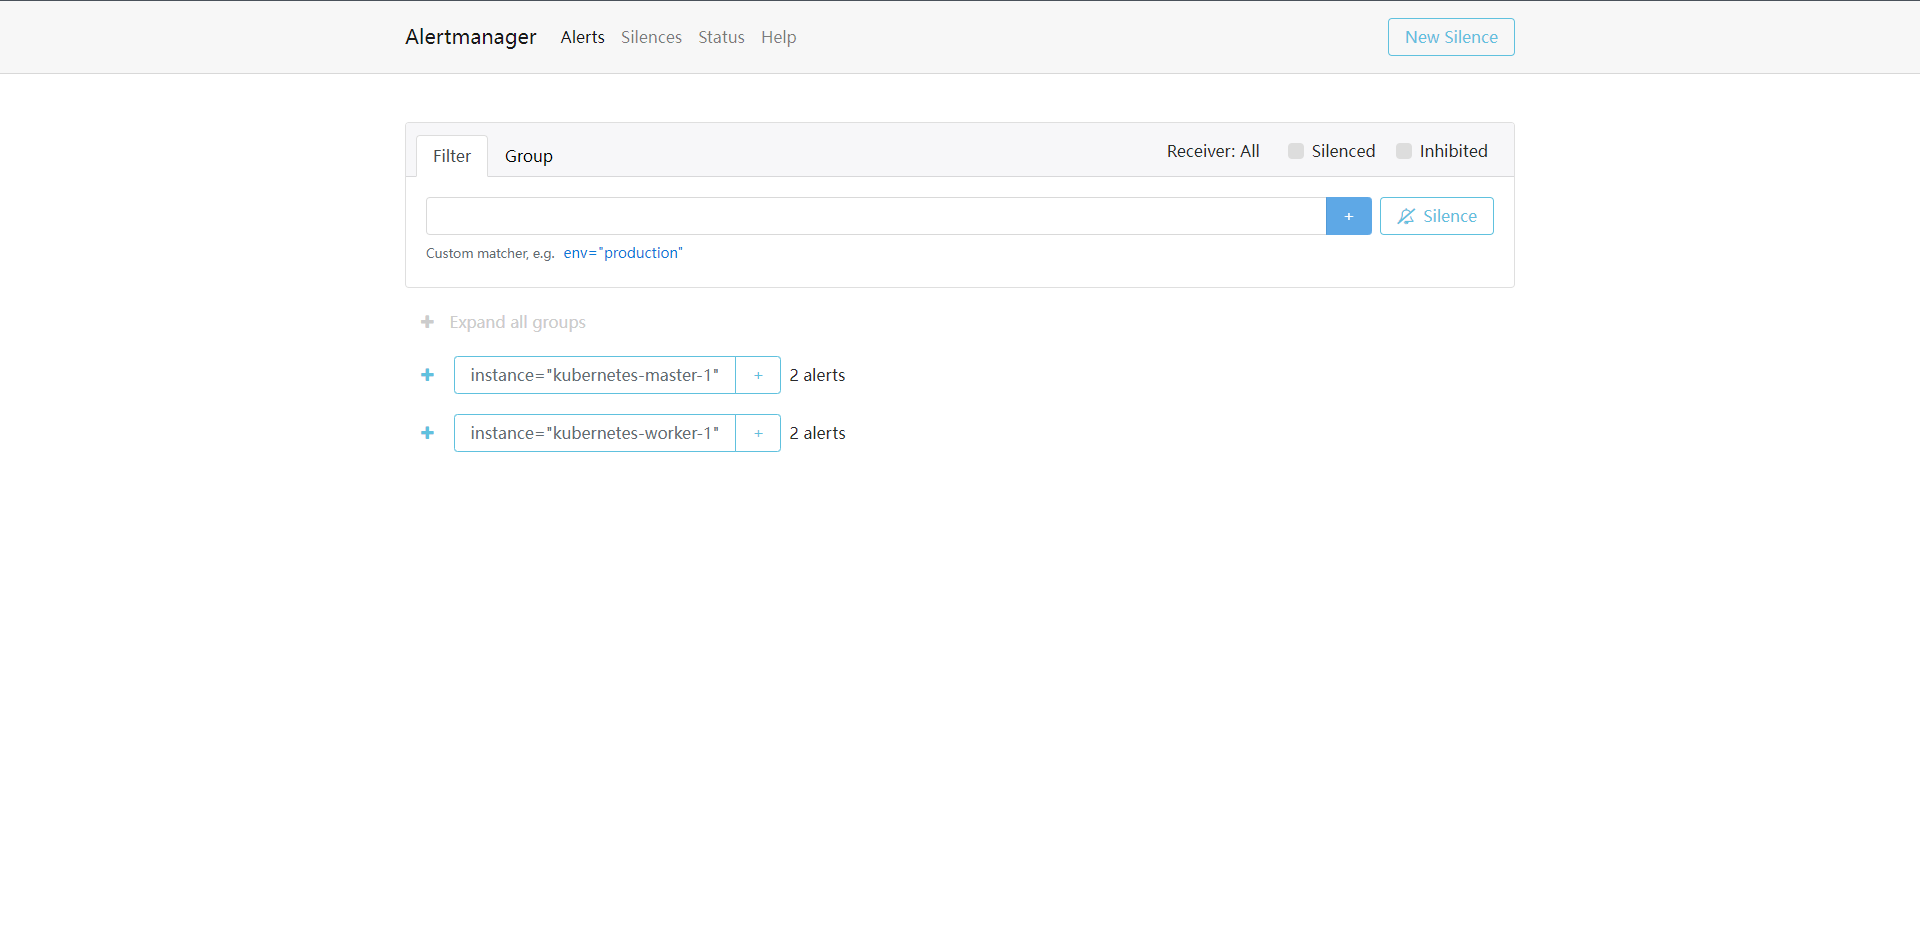
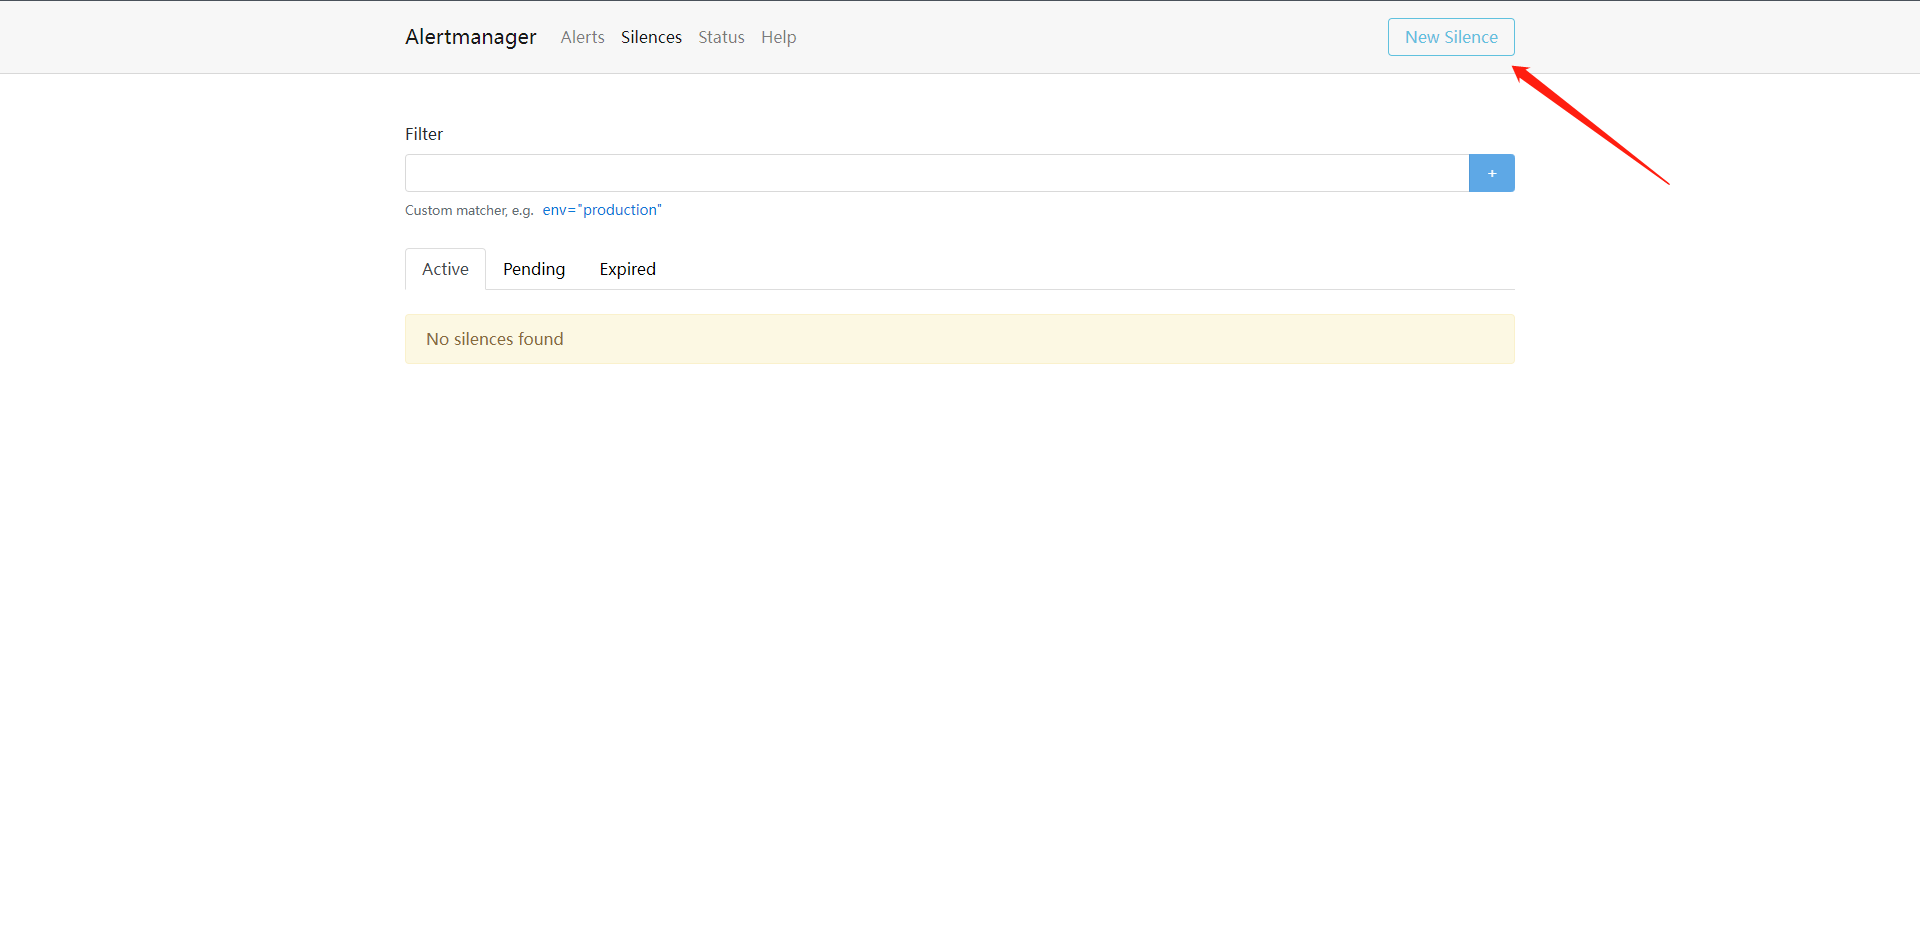
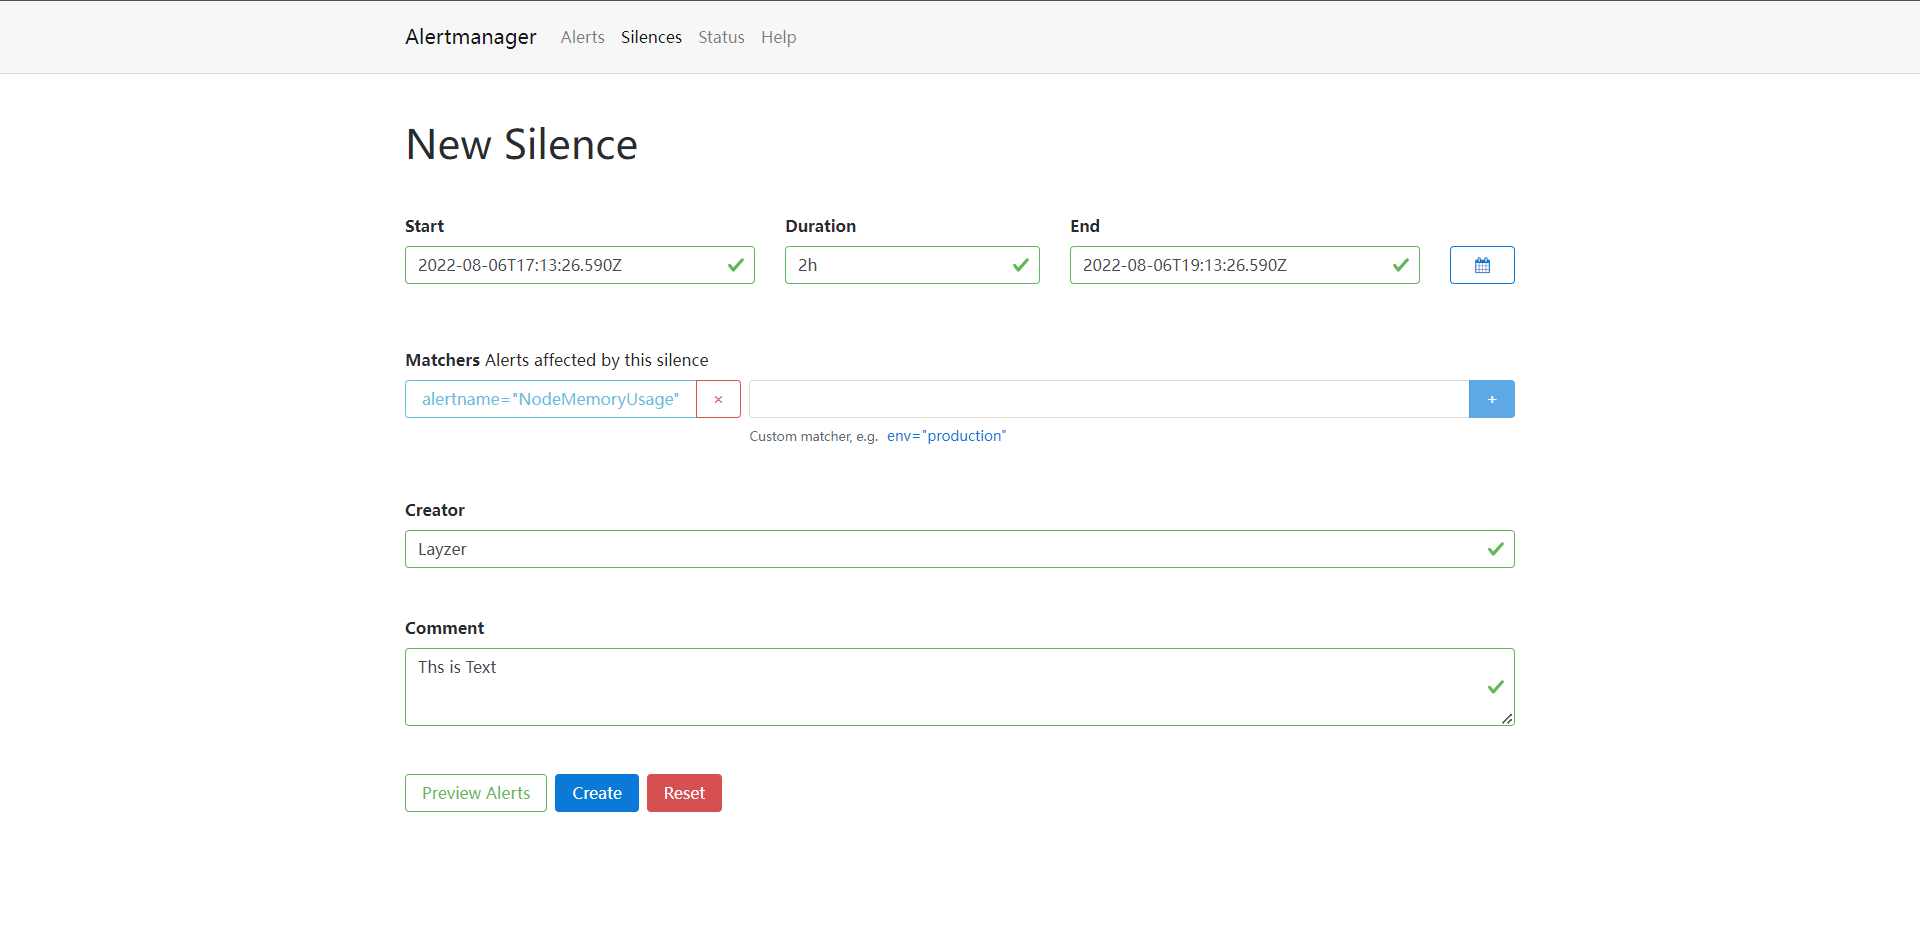
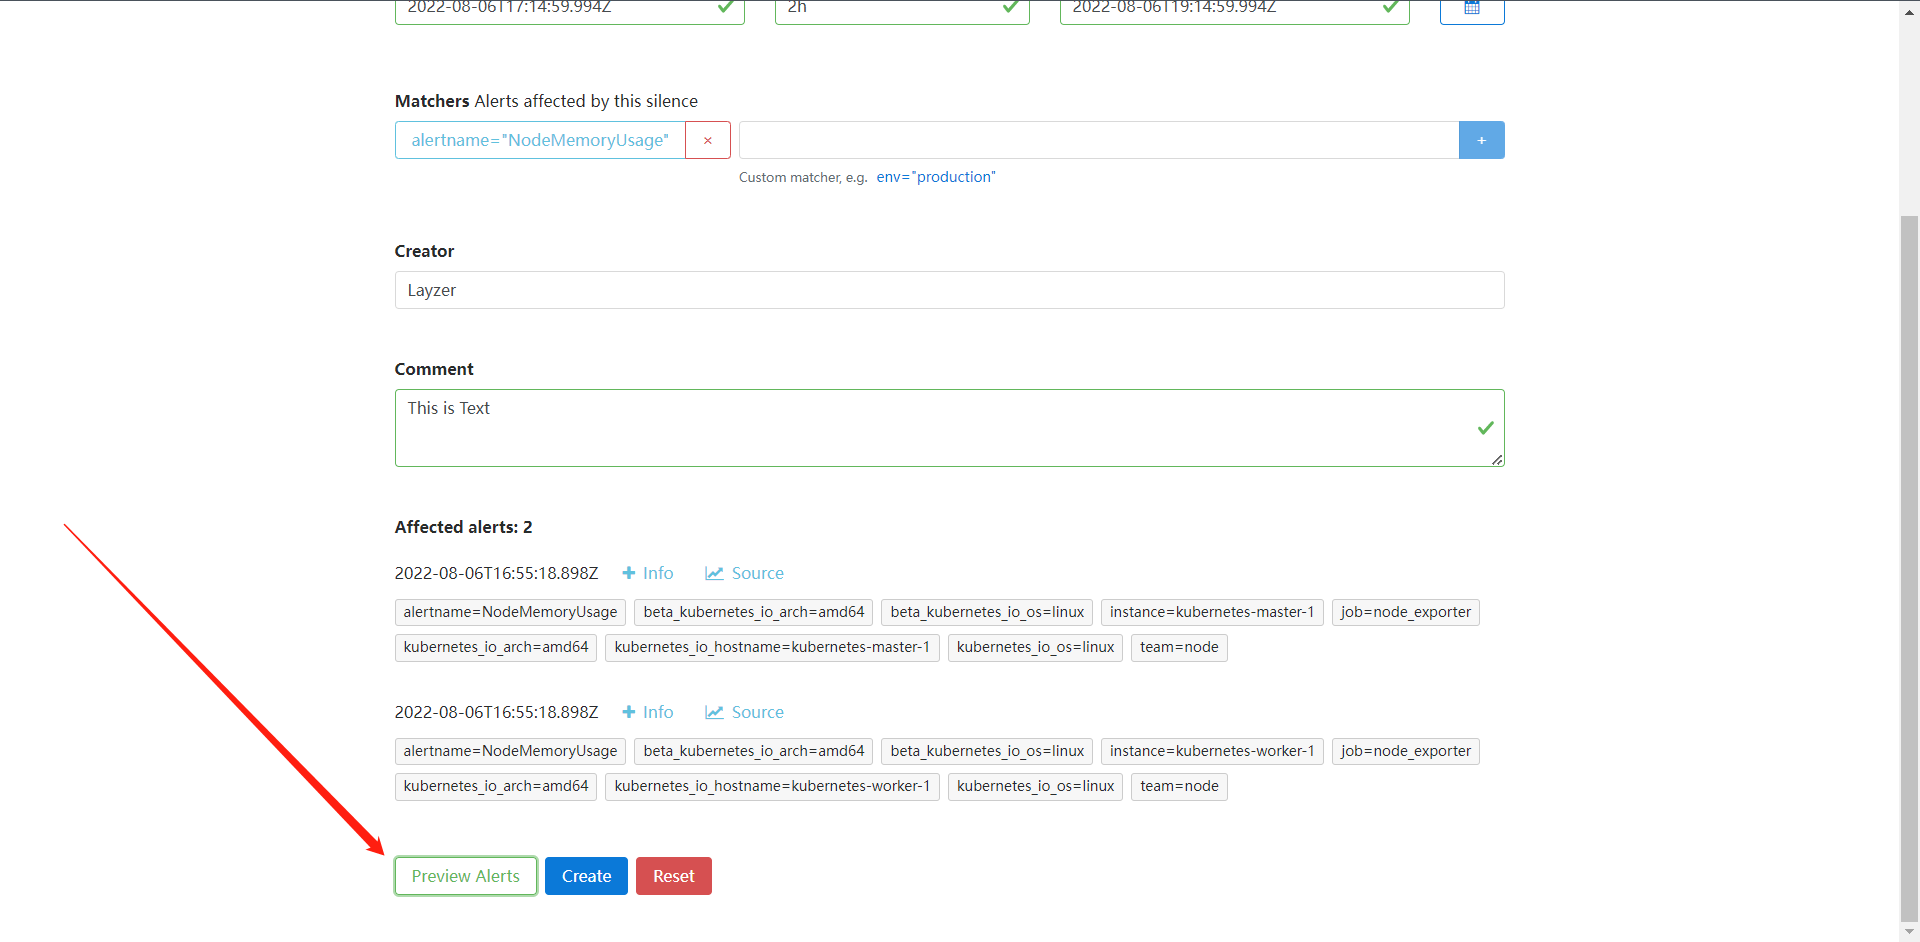
这个意思就是两小时内匹配到标签为`alertname=NodeMemoryUsage`的告警的话,就静默告警,当我们的问题处理完成之后我们按照下图操作,意思就是结束这次沉默告警。
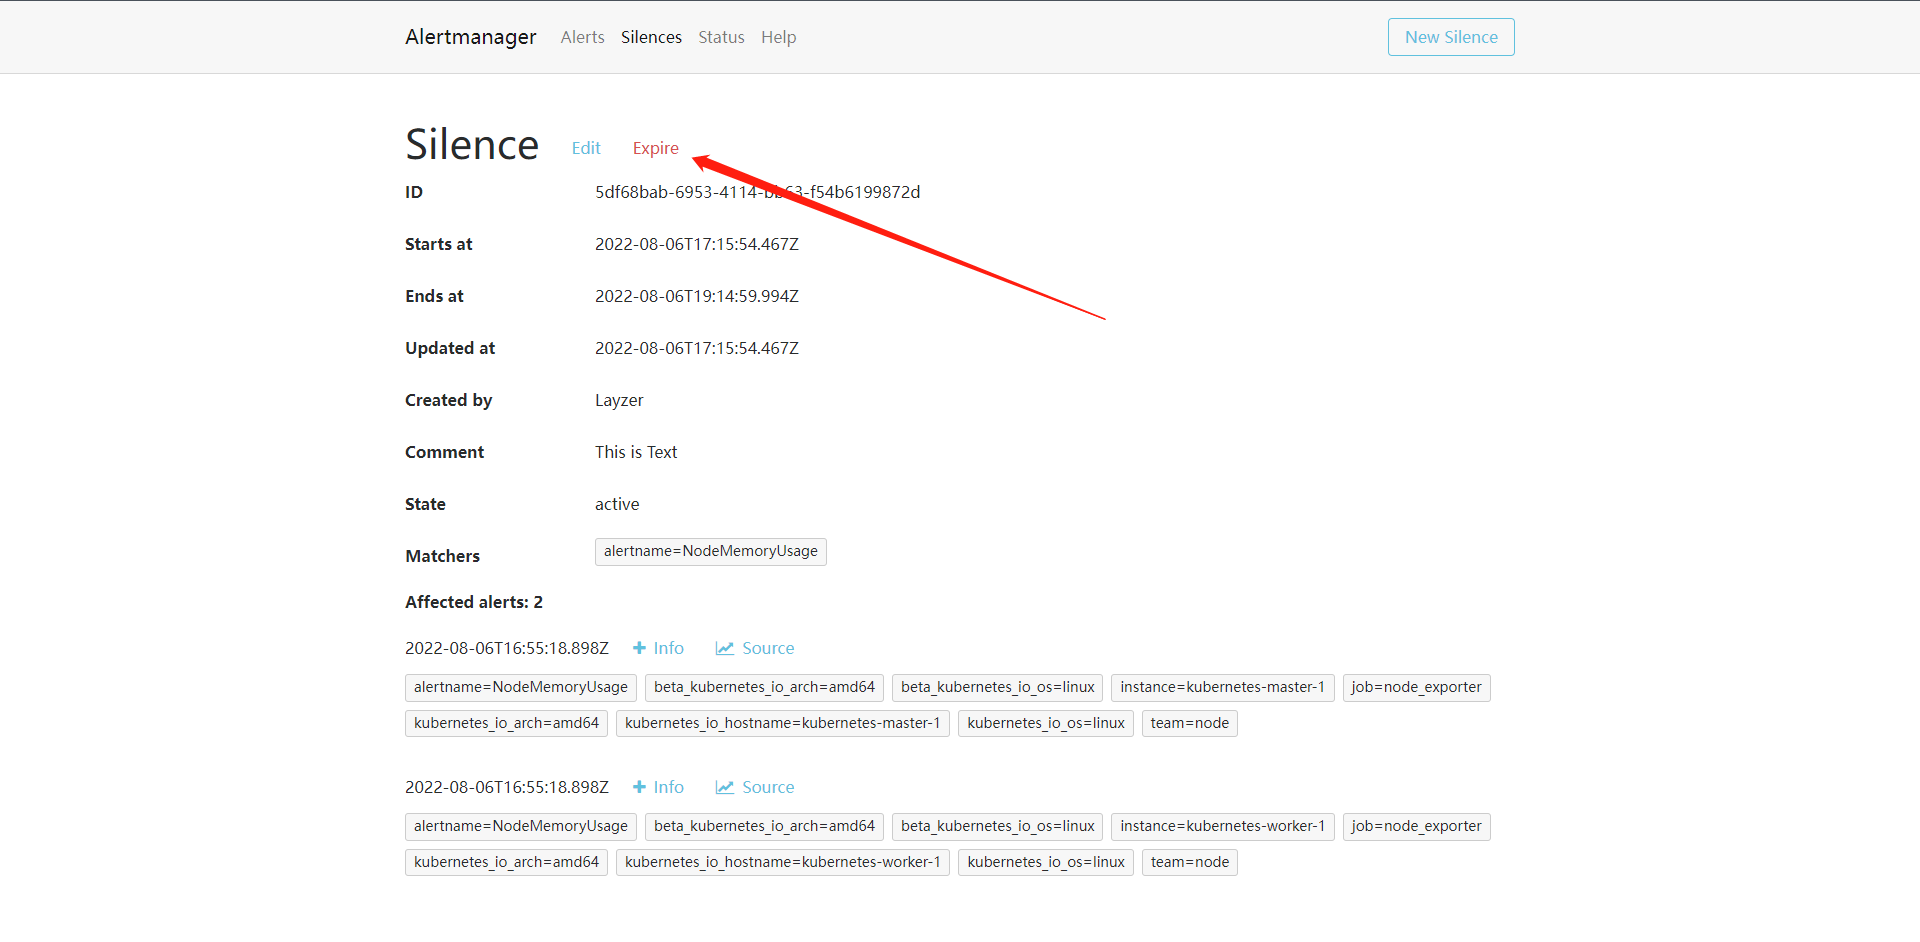
18.8:抑制机制
除了静默之外,Alertmanager还提供了抑制机制来控制告警的行为,抑制就是指某次告警发出后,可以停止重复发送此由此告警引发的其他告警机制,比如我现在有一台服务器宕机了,上面跑了很多的服务,都设置了告警,那么这个时候我会收到大量的告警,这个时候抑制就非常的有用了,可以有效地防止告警风暴。
要使用抑制机制,要在Alertmanager配置文件中的inhibit_rules属性下面进行自定义,每一条抑制规则的具体配置如下:
# 目标匹配
target_match:
[ <labelname>: <labelvalue>, ... ]
# 正则表达式目标匹配
target_match_re:
[ <labelname>: <regex>, ... ]
source_match:
[ <labelname>: <labelvalue>, ... ]
source_match_re:
[ <labelname>: <regex>, ... ]
# 已发送标签和新产生标签完全相同的时候就会触发抑制机制。
equal: '[' <labelname>, ... ']'
inhibit_rules:
- source_match:
alertname: NodeMemoryUsage
serverity: critical
target_match:
serverity: normal
equal:
- instance
还要在告警规则内添加标签serverity: critical
然后重新重载Prometheus和Alertmanager就可以了,当我们的触发的告警包括serverity: critical的标签时,我们下面一系列的告警都会被抑制。因为都包含instance标签。
18.9:记录规则
通过PromQL可以实时对Prometheus中采集的样本数据进行查询,聚合以及其他各种运算操作,而在某些PromQL较为复杂且计算较大时,直接使用PromQL可能导致Prometheus响应超时的情况,这时需要一种能够类似于后台批处理的机制在后台完成这些复杂的计算,可以实现对复杂查询的性能优化,提高查询效率,这对于Grafana Dashboard特别有用,仪表板每次刷新都需要重复查询相同数据表达式。
在Prometheus配置文件中,我们可以通过rule_files定义recoding_rule规则文件的访问路径。
rule_files: [- <filepath_glob> ... ]
每一个规则文件都通过以下格式进行定义:
groups: [- <rule_gourp>]
一个简单的规则文件可能时这样的:
groups:
- name: example
rules:
- record: job:http_improgress_requests:sum
expr: sum(http_improgress_requests) by (job)
rule_group的具体配置项如下:
# 分组名称,在一个文件中必须时唯一的
name: <string>
# 评估组中规则的频率
[ interval: <duration> | default = global.evaluation_interval ]
rules:
[ - <rule> ... ]
与告规则一致,一个group下可以包含多条规则。
# 输出时间序列名称,必须是一个有效的metric名称
record: <string>
# 要计算的`PromQL`表达式,每个评估周期都是在当前时间进行评估,结果记录为一组信的时间序列,metrics名称由record设置
labels: [<labelname>: <labelvalue>]
根据规则中的定义,Prometheus会在后台完成expr中定义的PromQL表达式计算,并且将计算结果保存在新的时间序列`record`中,同时可以通过labels标签为这些样本添加额外的标签。
这些规则文件的计算频率与告警规则计算频率一致,都通过global.evaluation_interval进行定义:
global: [evaluation_interval: <duration>| default = 1m]
比如现在我们想要获取空闲节点内存的百分比,可以使用下面的PromQL查询:
100 - (100 * node_memory_MemFree_bytes / node_memory_MemTotal_bytes)
然后我们就可以使用记录规则将上面的表达式重新配置同样配置在报警规则的groups下面添加如下配置:
groups:
- name: Test_Memory_Node
rules:
- alert: NodeMemoryUsage
expr: (node_memory_MemTotal_bytes - (node_memory_MemFree_bytes + node_memory_Buffers_bytes + node_memory_Cached_bytes)) / node_memory_MemTotal_bytes * 100 > 80
for: 1m
labels:
team: node
serverity: critical
annotations:
summary: "{{$labels.instance}}: High Memory usage detected"
description: "{{$labels.instance}}: Memory usage is above 80% (current value is: {{ $value }})"
- name: Test_CPU_Node
rules:
- alert: NodeCPUUsage
expr: ((1 - sum(increase(node_cpu_seconds_total{mode="idle"}[1m])) by (instance) / sum(increase(node_cpu_seconds_total[1m])) by (instance) ) * 100) > 80
for: 2m
labels:
team: node
serverity: critical
annotations:
summary: "{{$labels.instance}}: High CPU usage detected"
description: "{{$labels.instance}}: CPU usage is above 80% (current value is: {{ $value }})"
- name: recording_rules
rules:
- record: job:node_memory_MemFree_bytes:percent
expr: 100 - (100 * node_memory_MemFree_bytes / node_memory_MemTotal_bytes)
完成之后重载Prometheus
curl -X POST http://10.0.0.10:31656/-/reload
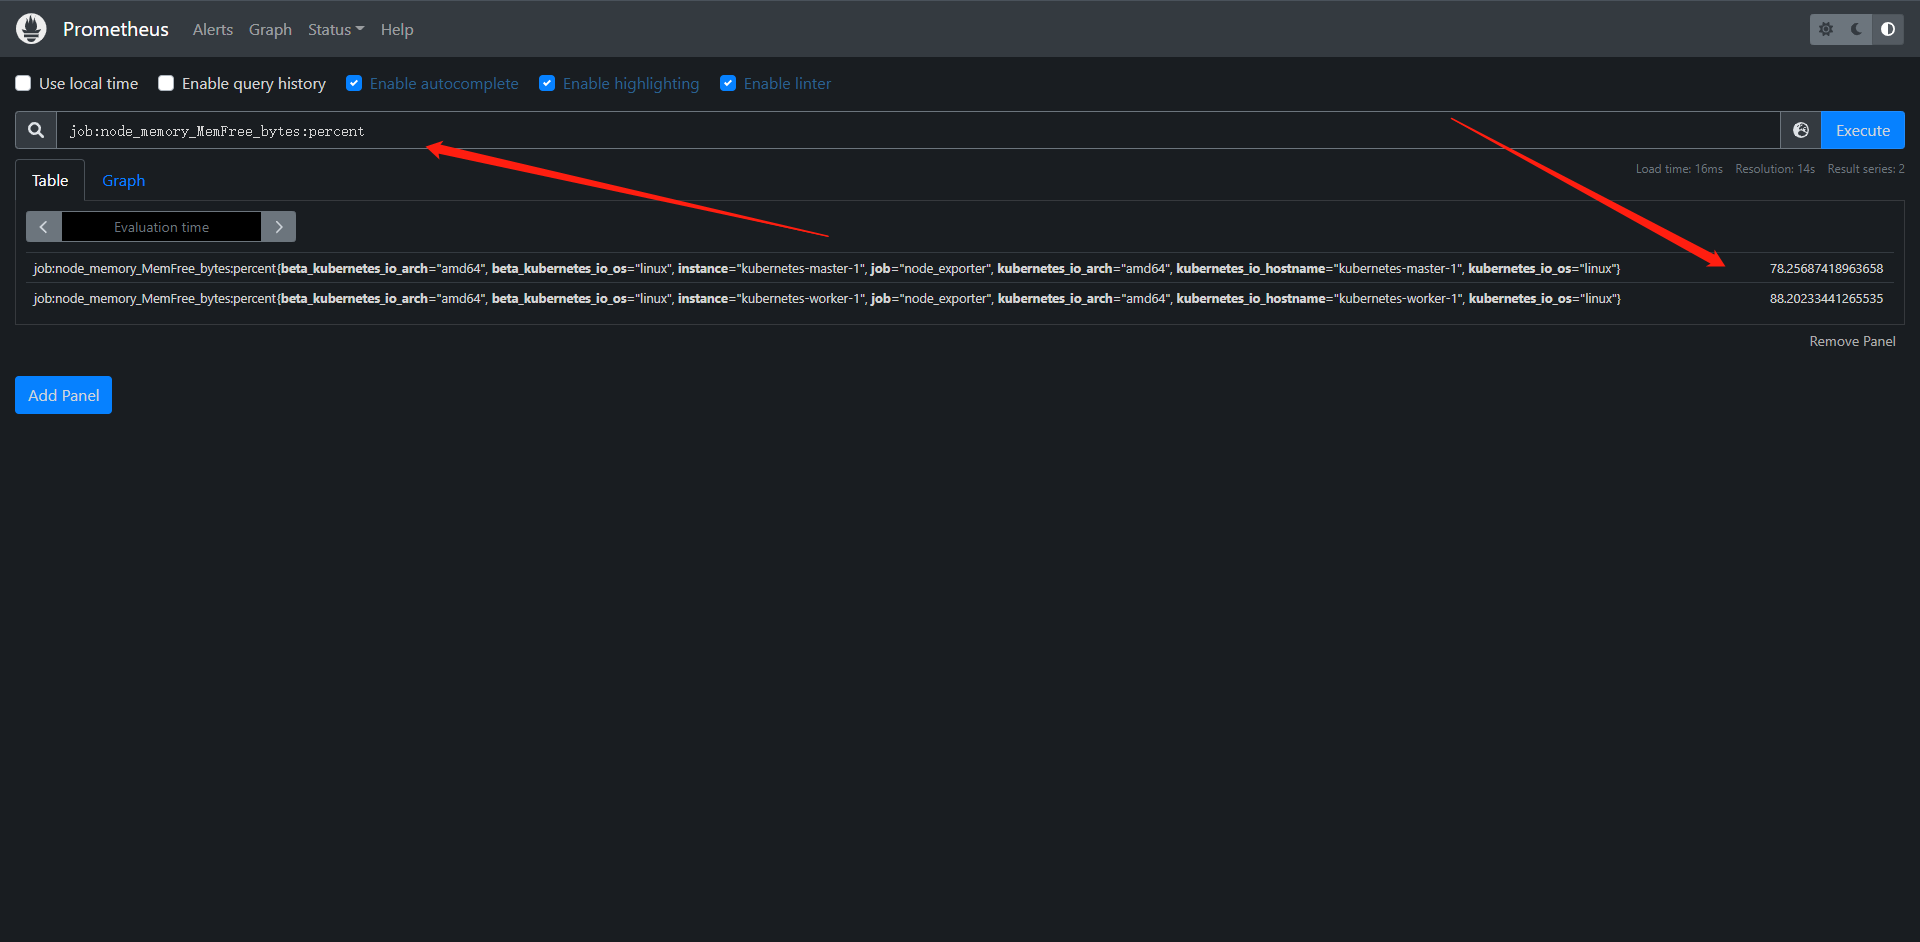
我们发现我们定义的规则查到了我们的数据,但是其实这个时候我们比较建议的是把这些个复杂的计算的record也命名为PromQL其实也是为了规范化,还有一个问题就是这里的标签其实也是完全继承下来的。

 浙公网安备 33010602011771号