如何使用Python编写一个自定义的exporter?
如何使用Python编写一个自定义的exporter?
1:什么是exporter
广义上向prometheus提供监控数据的程序都可以成为一个exporter的,一个exporter的实例称为target, exporter来源主要2个方面,一个是社区提供的,一种是用户自定义的。
2:常用exporter
官方和一些社区提供好多exproter, 我们可以直接拿过来采集我们的数据。 官方的exporter地址: https://prometheus.io/docs/instrumenting/exporters/
3:Blackbox Exporter
bloackbox exporter是prometheus社区提供的黑盒监控解决方案,运行用户通过HTTP、HTTPS、DNS、TCP以及ICMP的方式对网络进行探测。这里通过blackbox对我们的站点信息进行采集。
4:自定义编写exporter程序
可能因为一些特殊需求,我们需要编写一些自定义的exporter,这一点prometheus也给出了方法,我这边使用的是Python编写,其实真正去写的话应该是用Go去写的,因为我对Go还不是特别的熟悉,所以这边就使用了Python
5:所需环境
| CentOS 7.9 | 10.0.0.14 | Prometheus |
|---|---|---|
| Windows | 10.0.0.1 | Python3.9 |
1:配置Prometheus
[root@Prometheus ~]# cat /usr/local/prometheus/prometheus.yml
---
- job_name: "windows"
static_configs:
- targets: ["10.0.0.1:9100"]
2:编写exporter代码
# 我这里提供web服务的是Flask来编写的,大家可以根据自己的理解去使用框架
# 所需模块:prometheus_client flask psutil
# 框架如下
import prometheus_client
from prometheus_client import Gauge
from prometheus_client.core import CollectorRegistry
from flask import Response, Flask
from psutil import *
app = Flask(__name__)
REGISTRY = CollectorRegistry(auto_describe=False)
@app.route('/metrics')
def metrics():
return Response(prometheus_client.generate_latest(REGISTRY),
mimetype="text/plain")
@app.route('/')
def index():
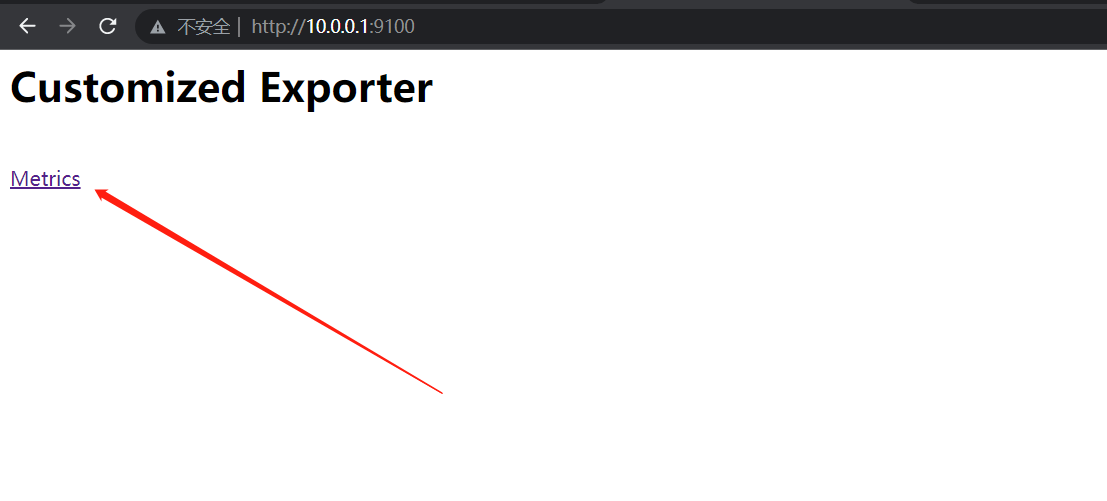
return "<h1>Customized Exporter</h1><br> <a href='metrics'>Metrics</a>"
if __name__ == "__main__":
app.run(host='0.0.0.0',port=9100,debug=True)
填写内容,首先监控一个CPU的核心数
import prometheus_client
from prometheus_client import Counter, Gauge
from prometheus_client.core import CollectorRegistry
from flask import Response, Flask
from psutil import *
app = Flask(__name__)
REGISTRY = CollectorRegistry(auto_describe=False)
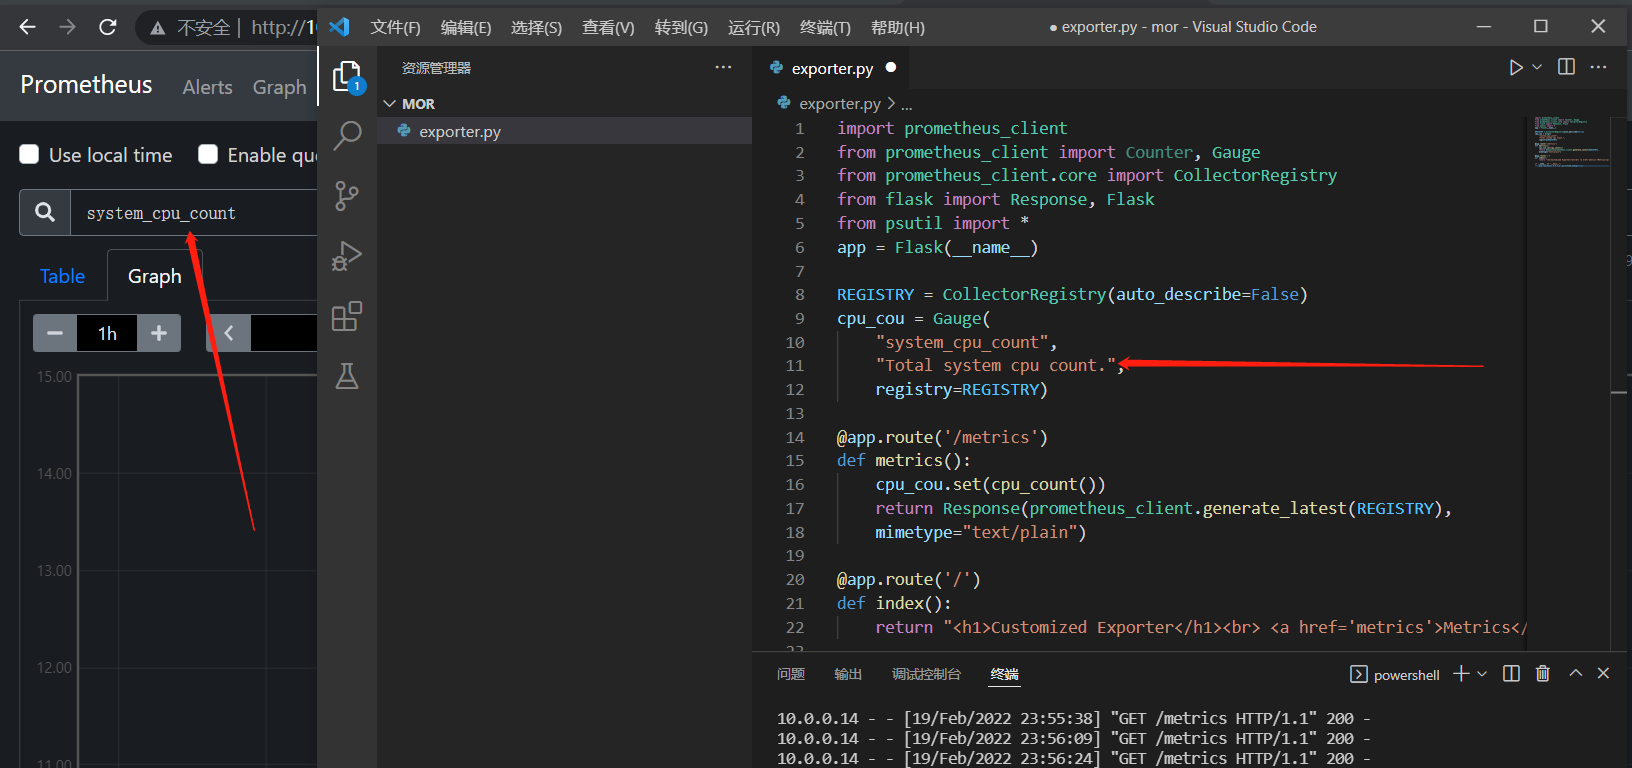
# 编写Prom语句并定义一个监控
cpu_cou = Gauge(
"system_cpu_count",
"Total system cpu count.",
registry=REGISTRY)
@app.route('/metrics')
def metrics():
# 将参数传入监控项内
cpu_cou.set(cpu_count())
return Response(prometheus_client.generate_latest(REGISTRY),
mimetype="text/plain")
@app.route('/')
def index():
return "<h1>Customized Exporter</h1><br> <a href='metrics'>Metrics</a>"
if __name__ == "__main__":
app.run(host='0.0.0.0',port=9100,debug=True)
# 完成后即可启动Flask
PS E:\vscode\mor> python .\exporter.py
* Serving Flask app 'exporter' (lazy loading)
* Environment: production
WARNING: This is a development server. Do not use it in a production deployment.
Use a production WSGI server instead.
* Debug mode: on
* Restarting with stat
* Debugger is active!
* Debugger PIN: 112-909-826
* Running on all addresses.
WARNING: This is a development server. Do not use it in a production deployment.
* Running on http://10.0.0.1:9100/ (Press CTRL+C to quit)
# 访问一下web看看
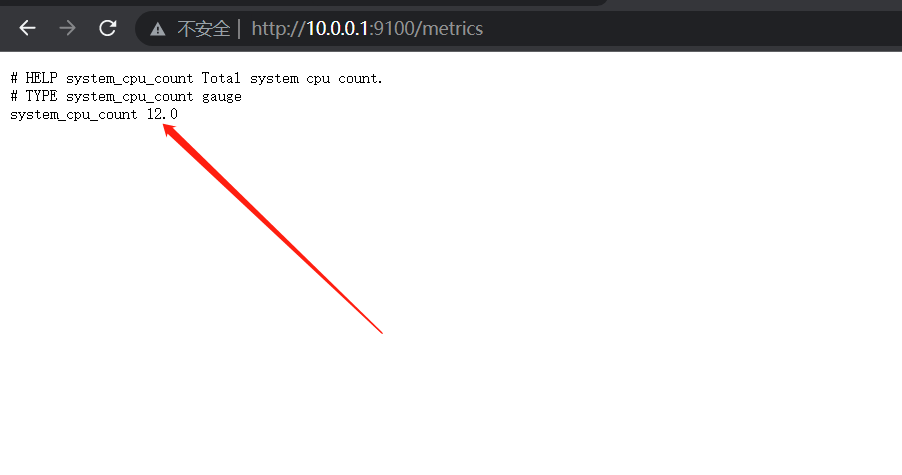
可以看到拿到值了,这边就可以启动prometheus内来看看我们的监控情况了
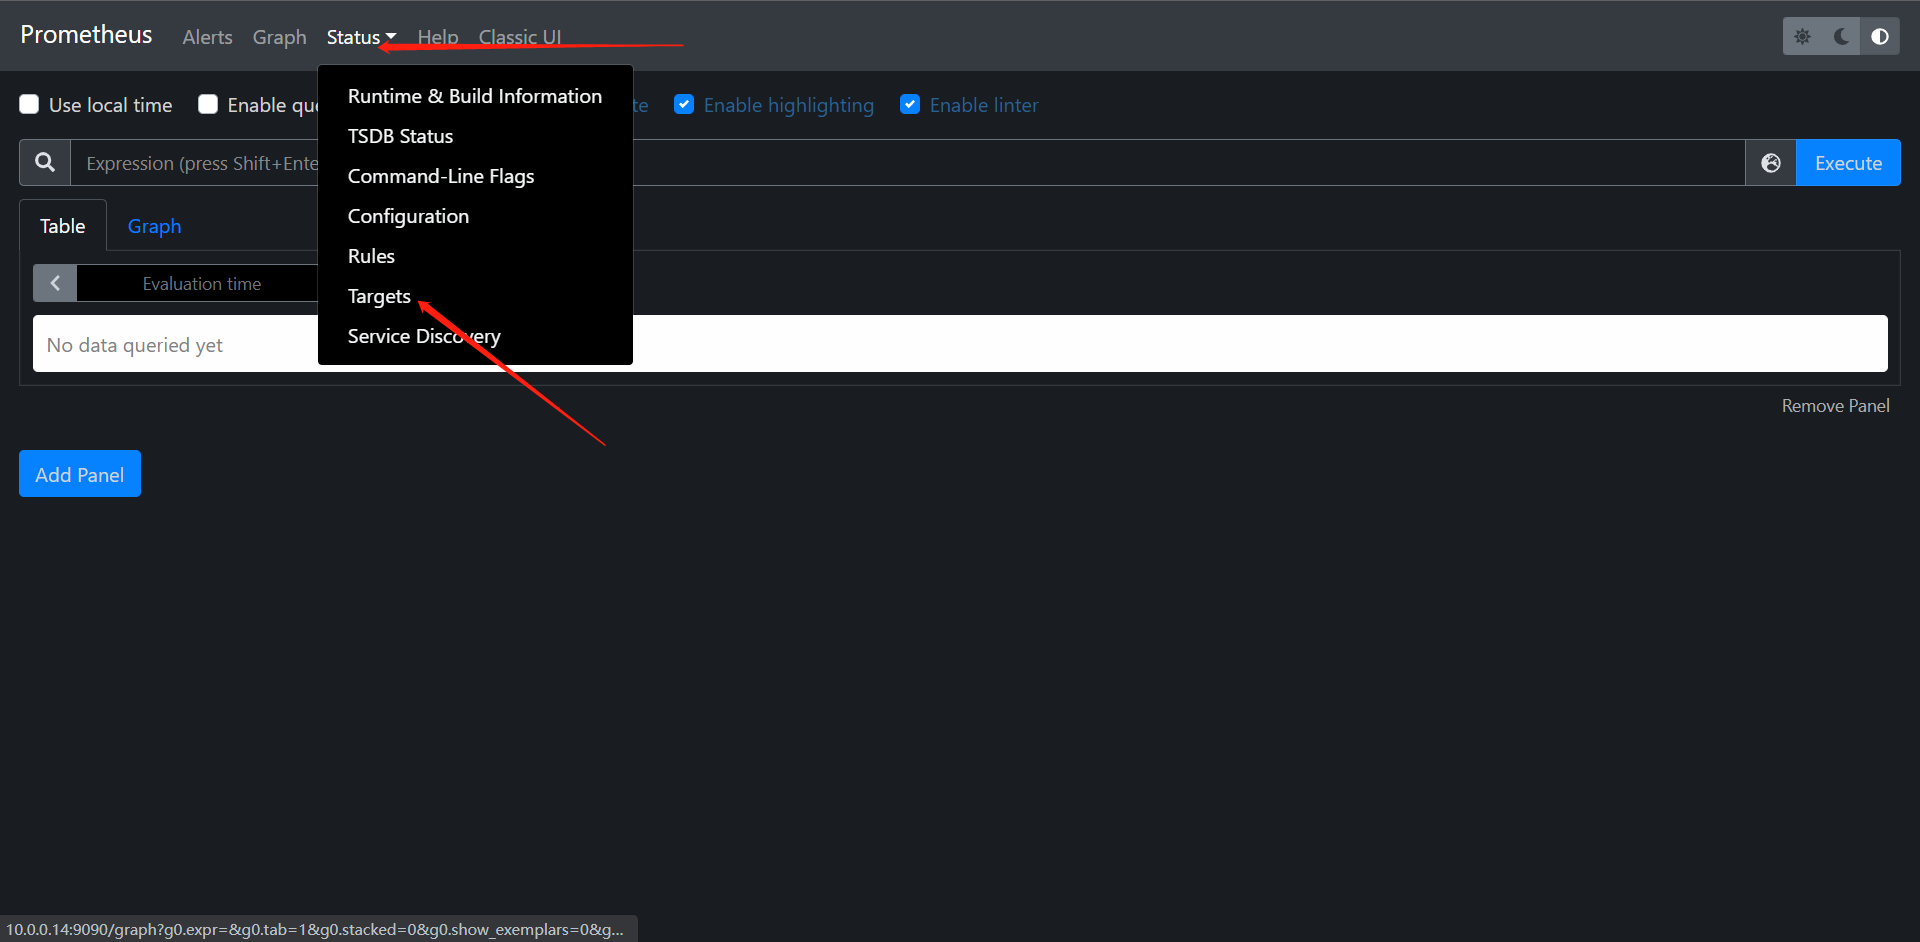
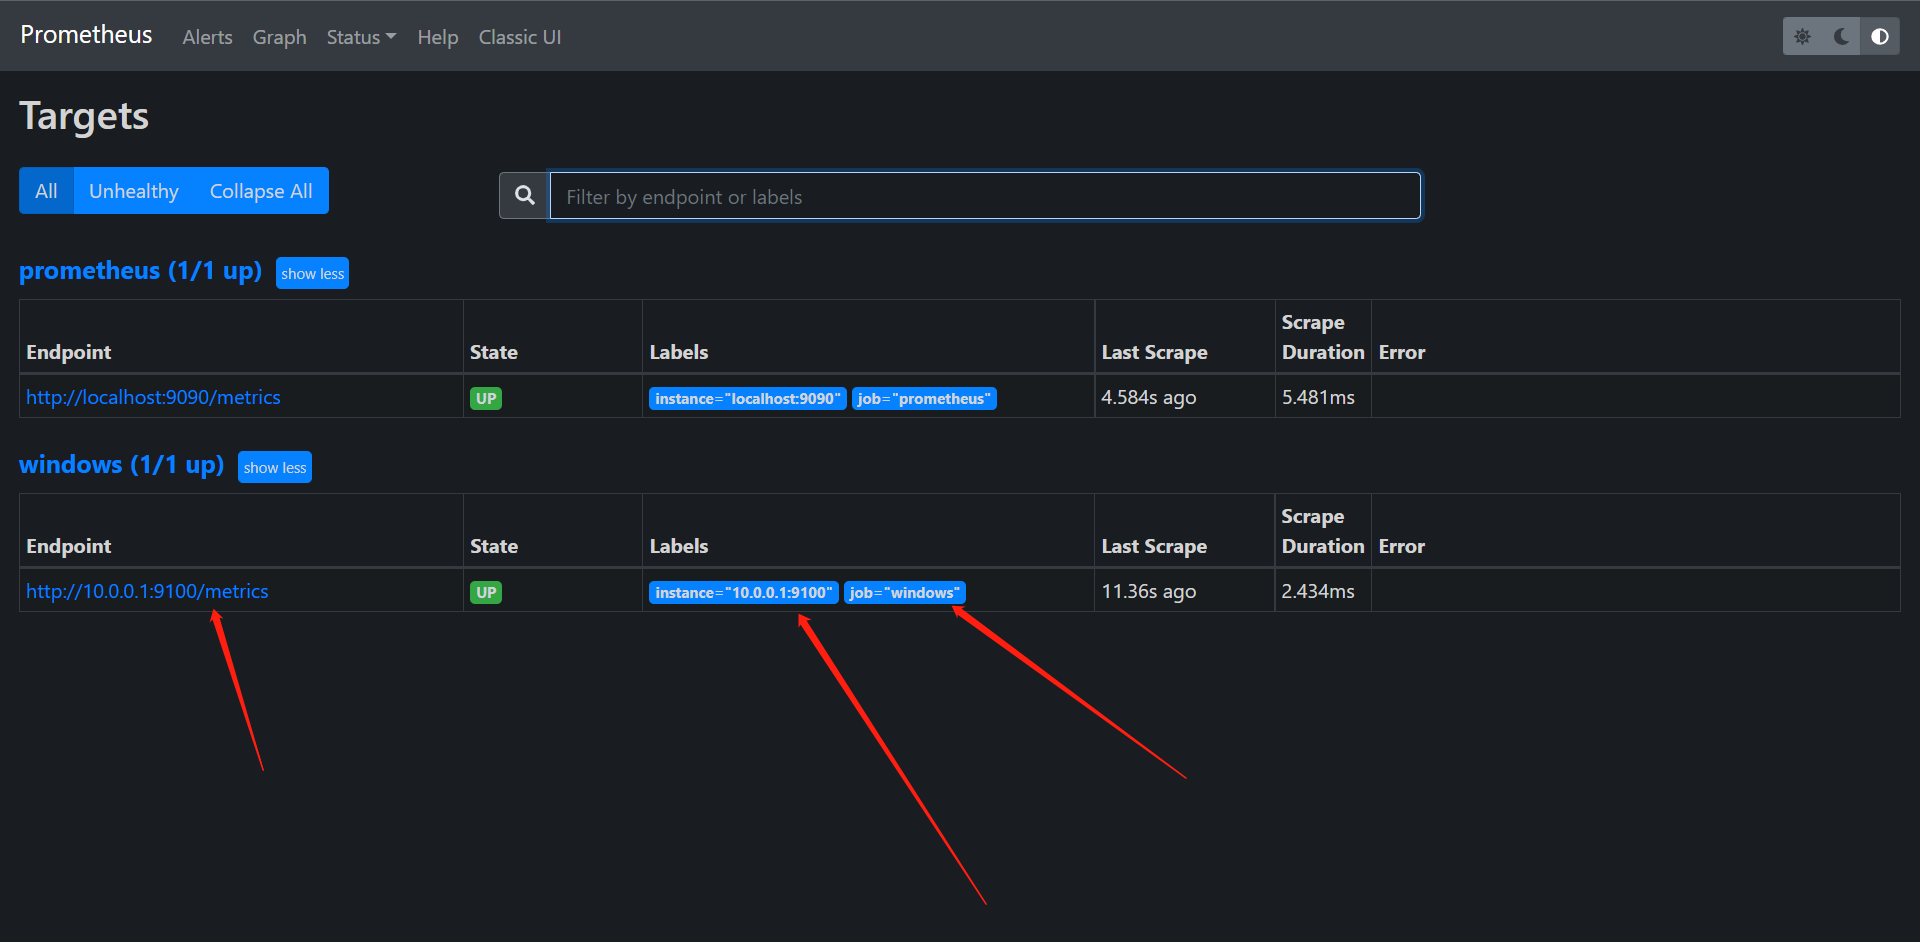
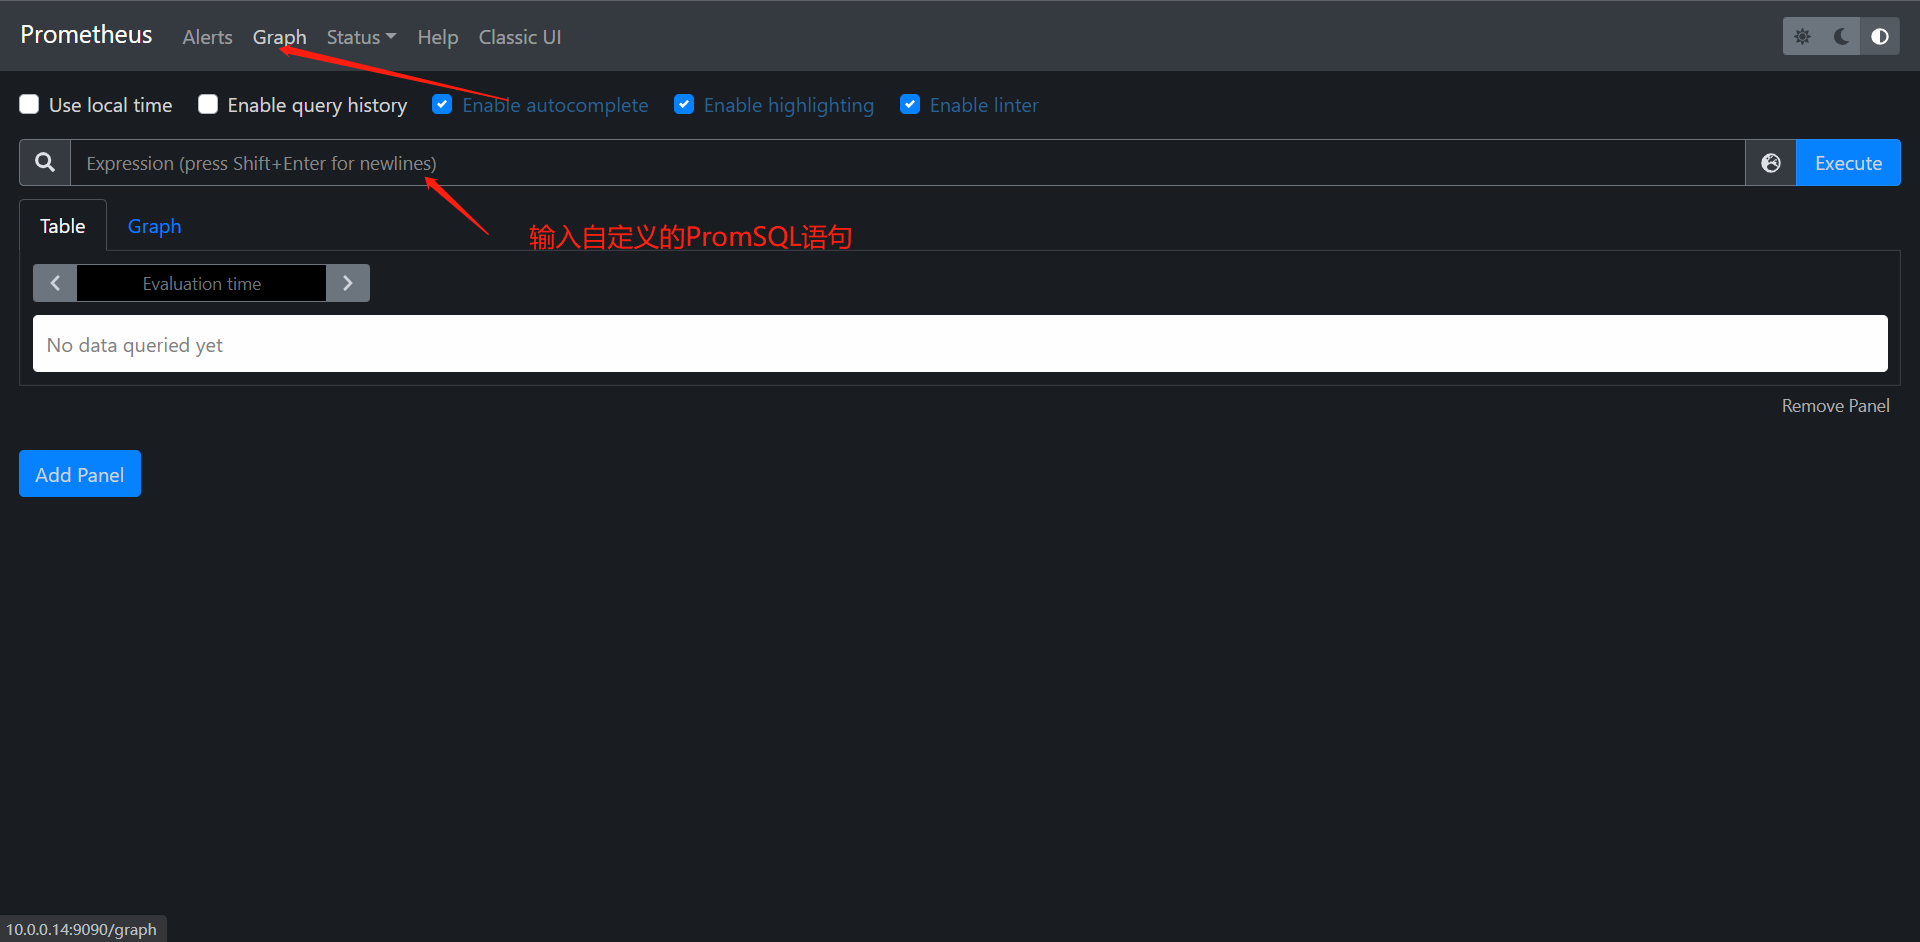
可以发现注册上来了,此时我们还需要去验证一下数据是否已经拿到了,我们去看看PromSQL语句是否可以执行
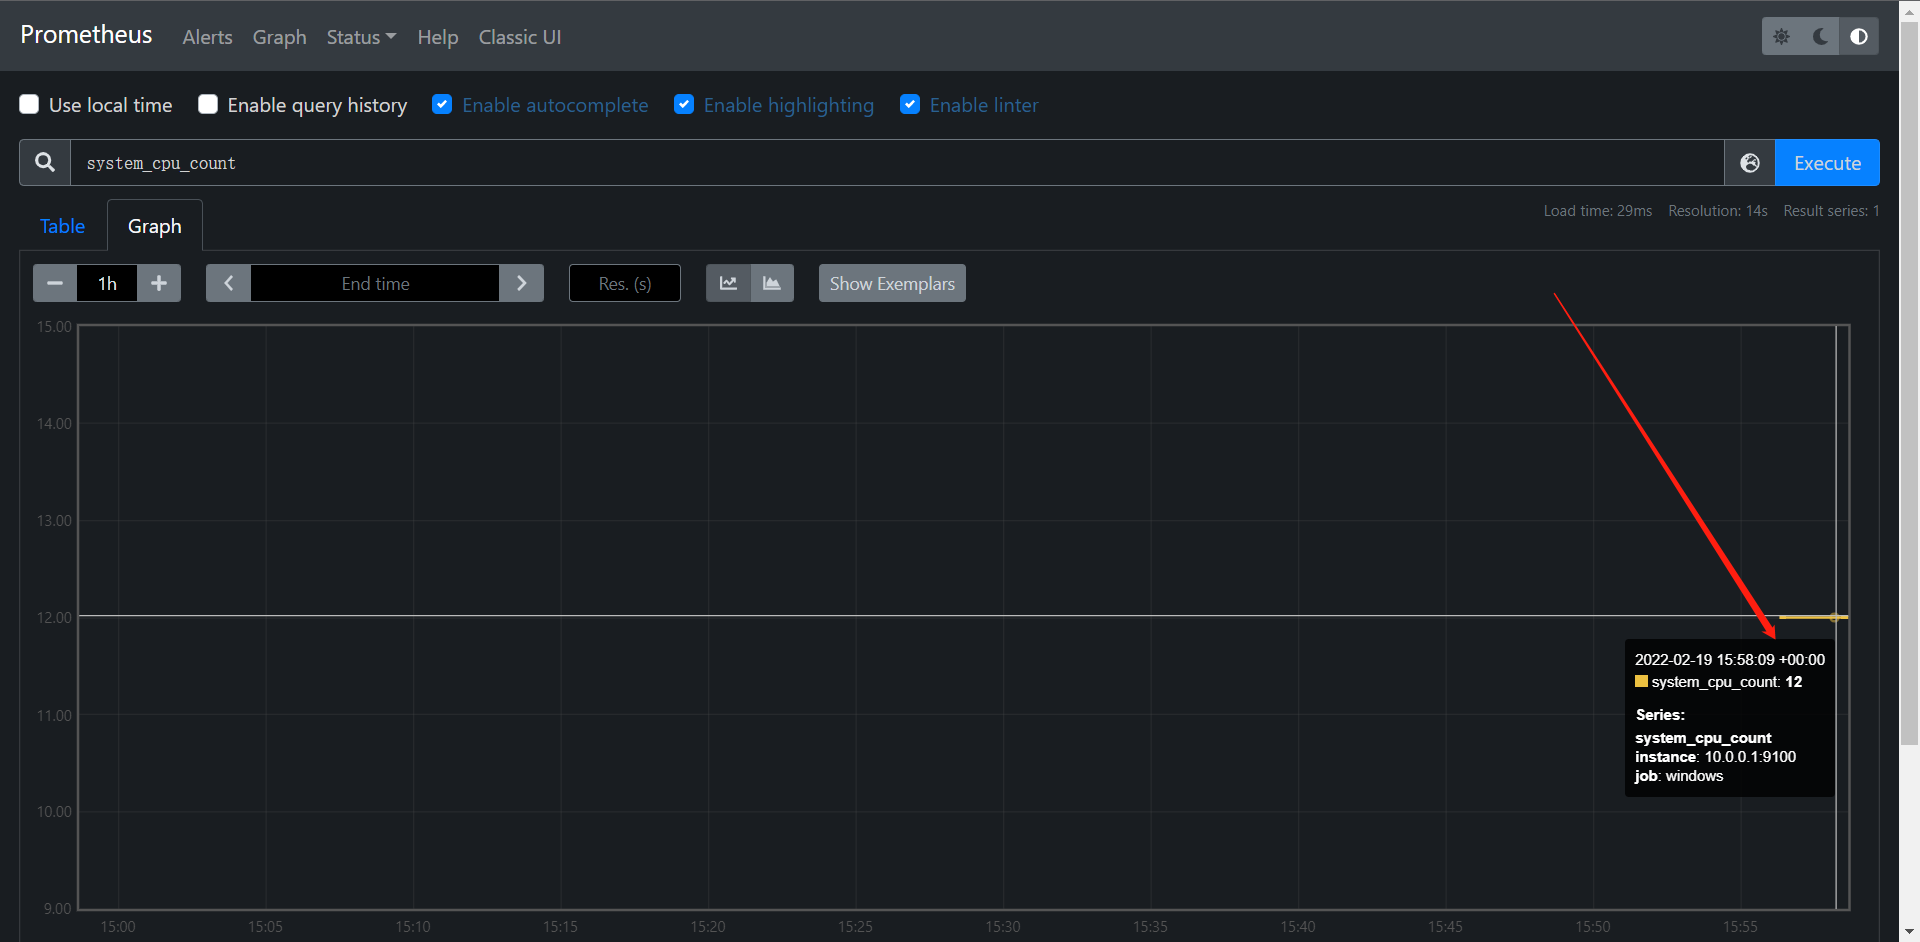
可以看到数据已经拿到了,这个时候我们的一个自定义的exporter就已经写好了,根据自己的需求提取指定的参数传到prometheus的指定模板内即可实现监控了

 浙公网安备 33010602011771号