
Problem
Today, one of our SQL Server instances was performing very slowly. When I logged in to the database server to do some initial checks I noticed it was memory pressure from the initial observation. Next we had to find what out was causing our instance to have memory pressure. When I checked the wait types for the transactions, the RESOURCE_SEMAPHORE wait was the issue for most of the transactions. In this tip I will describe this issues and how to find which query or transaction is causing the memory pressure
Solution
When I checked the wait types for all transactions, the RESOURCE_SEMAPHORE wait was the wait type for most of the transactions in addition to some page IO waits. The page IO waits were also due to memory pressure because those transactions were not able to get enough memory to perform their operation.
Resource Semaphore Wait
Before moving on, I would like to shed some light on the Resource Semaphore wait so you can better understand how memory is granted to SQL Server queries.
When SQL Server receives a user query, it first creates a complied plan, then an execution plan is created based on the complied plan. When SQL Server creates a complied plan it calculates two memory grant parameters called "required memory" and "additional memory". Required memory is the minimum memory needed to run a sort and hash join. It is known as required because a query would not start without this memory available. Additional memory is the amount of memory needed to store temporary rows in memory. This is known as additional because a query can be stored on disk if there is not enough memory available.
First, the server calculates how much memory is needed for any given query to execute. This is generally the sum of required memory and additional memory, but if your instance is using parallelism then the needed memory would be (required memory * DOP) + additional memory. The server checks if the needed memory exceeds the per query limit, then the server reduces additional memory until the total fits within the limit. This revised size is called requested memory. There is an internal facility within SQL Server known as RESOURCE SEMAPHORE which is used to grant this requested memory to a query. If query is not able to be granted this requested memory by a Resource Semaphore, then that query will be in a waiting state with a RESOURCE_SEMAPHORE wait type if you query the sysprocesses system table or sys.dm_exec_request DMV.
When a Resource Semaphore receives a new request, it first checks if any query is waiting or not. If it finds one, it puts the new query in the queue because the wait queue is designed on a first-come-first-served basis with a small weighting to favor small queries. Resource Semaphore attempts to grant memory when there is no waiting query or when a query returns reserved memory. If it finds enough memory, then the requested memory is granted and the query can start running and if it does not find enough free memory to grant the requested memory then it puts the current query into the waiting queue with a RESOURCE_SEMAPHORE wait type and your server starts facing memory pressure.
Identify RESOURCE_SEMAPHORE Waits
Step 1
First, we need to look into our instance to see why memory pressure is occurring within SQL Server. To get an initial overview of all transactions, we can query sysprocesses or we can use the sys.dm_exec_requests DMV.
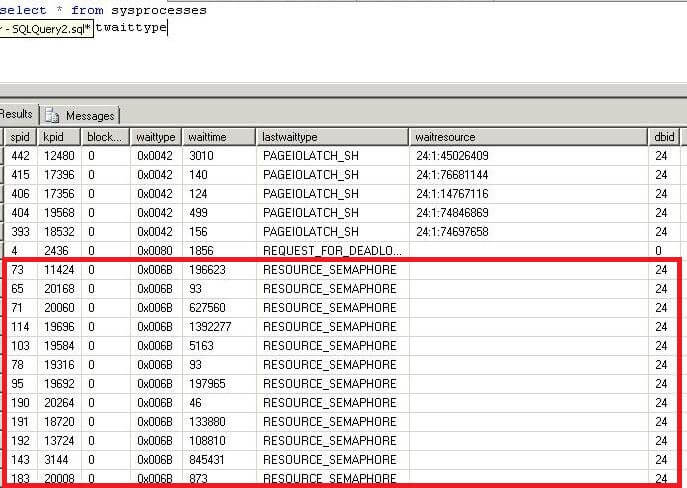
SELECT * FROM SYSPROCESSES
ORDER BY lastwaittype
Here we can see processes that have a RESOURCE_SEMAPHORE wait type.
Step 2
From the above query, we can see a large number of transactions are waiting with Resource Semaphore wait type. Now we can run the below query to see the status of total number of queries which have been granted memory and the number of queries which have not yet been granted memory.
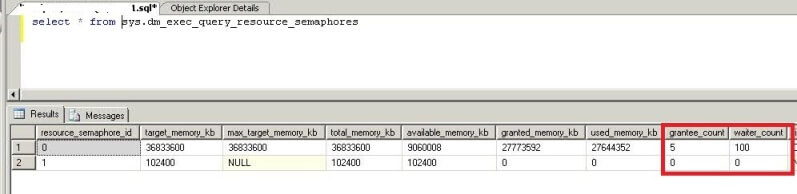
The output of this DMV returns two rows, one for large queries (resource_semaphore_id is 0) and another one for small queries (resource_semaphore_id is 1) specially less than 5 MB. Here you can get the total granted memory and total available memory for the instance. See the numbers on grantee_count and waiter_count, the grantee_count is the number of queries which have their memory and the waiter_count is the number of quires which are waiting in queue to get memory. So here we can see approximately 100 queries are waiting to get their requested memory.
SELECT * FROM sys.dm_exec_query_resource_semaphore
Step 3
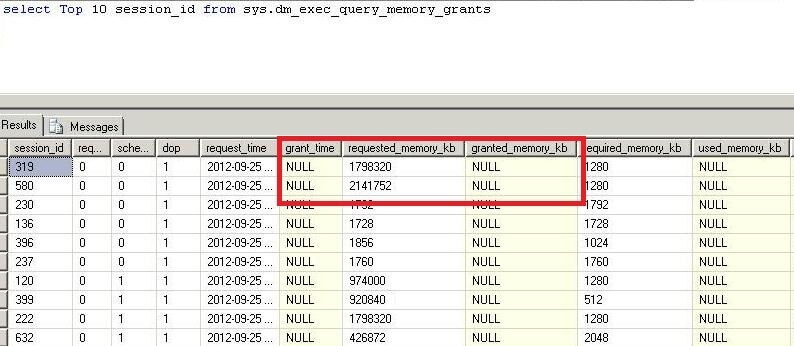
Now we will get the details of all queries which are waiting in queue to get their requested memory. We will use DMV sys.dm_exec_query_memory_grants to get the total number of queries which are waiting in queue to get their memory along with the details. The columns grant_time and granted_memory_kb will be NULL for those queries which are waiting to get their requested memory. You can see in the below screenshot the requested memory amount and their waiting state because their grant_time and granted_memory_kb value is NULL. We can also get the plan_handle and sql_handle of all queries with this DMV. We will use these values later to get the exact queries.
Note: there are too many columns to show, so this is just a partial listing of all columns.
SELECT * FROM sys.dm_exec_query_memory_grants
Step 4
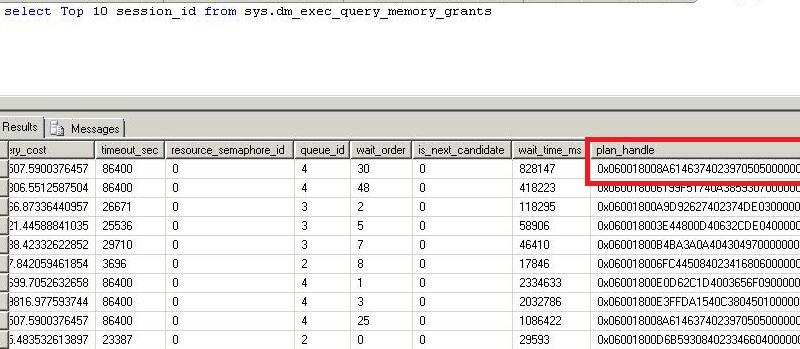
Now we will find the memory intensive queries. We can see the requested memory for all waiting queries. Here we can see the requested memory is too large for most of the transactions. We will get the plan_handle of all these queries to get the exact SQL text to look into the query plan.
Step 5
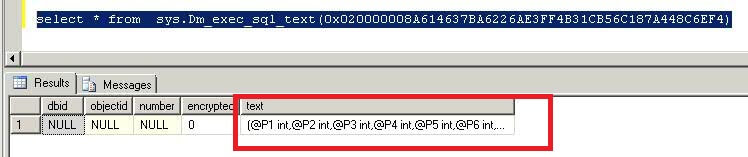
Now we will use the above plan_handle and sql handle to get the SQL code.
Run the below statement to get the SQL code using the sql_handle from the above query.
SELECT * FROM sys.dm_exec_sql_text(sql_handle)
We can also get the SQL plan using the plan_handle from the query in Step 4.
Conclusion
Now that we have found the memory intensive queries and their execution plans, our next step is to look into these queries and figure out how to tune them. We should look into bad or missing indexes used in the query and implement proper indexing. In our case, it was bad indexes which were causing the memory pressure. After implementing proper indexing the same query was running with much less requested memory.
Next Steps
- Use this tip to identify the queries which are consuming more memory and putting remaining transactions into wait state due to lack of memory.
- Also look at the other columns of the above DMVs and correlate them to each other for better analysis and understanding of performance issues.
- These DMVs should provide an ample amount of information so you can identify the issue.
- Read more tips on Performance Tuning to improve your system performance.

 浙公网安备 33010602011771号