

使用grafana+Prometheus监控时PromQL内置函数详解
1、Prometheus简介 -> 关注清哥聊技术公众号,了解更多技术文章
Prometheus(中文名:普罗米修斯)是由SoundCloud开发的开源监控报警系统和时序列数据库(TSDB). Prometheus使用Go语言开发, 是Google BorgMon监控系统的开源版本。
Prometheus的基本原理是通过HTTP协议周期性抓取被监控组件的状态, 任意组件只要提供对应的HTTP接口就可以接入监控. 不需要任何SDK或者其他的集成过程。输出被监控组件信息的HTTP接口被叫做exporter,目前开发常用的组件大部分都有exporter可以直接使用, 比如Nginx、MySQL、Linux系统信息、Mongo、ES等
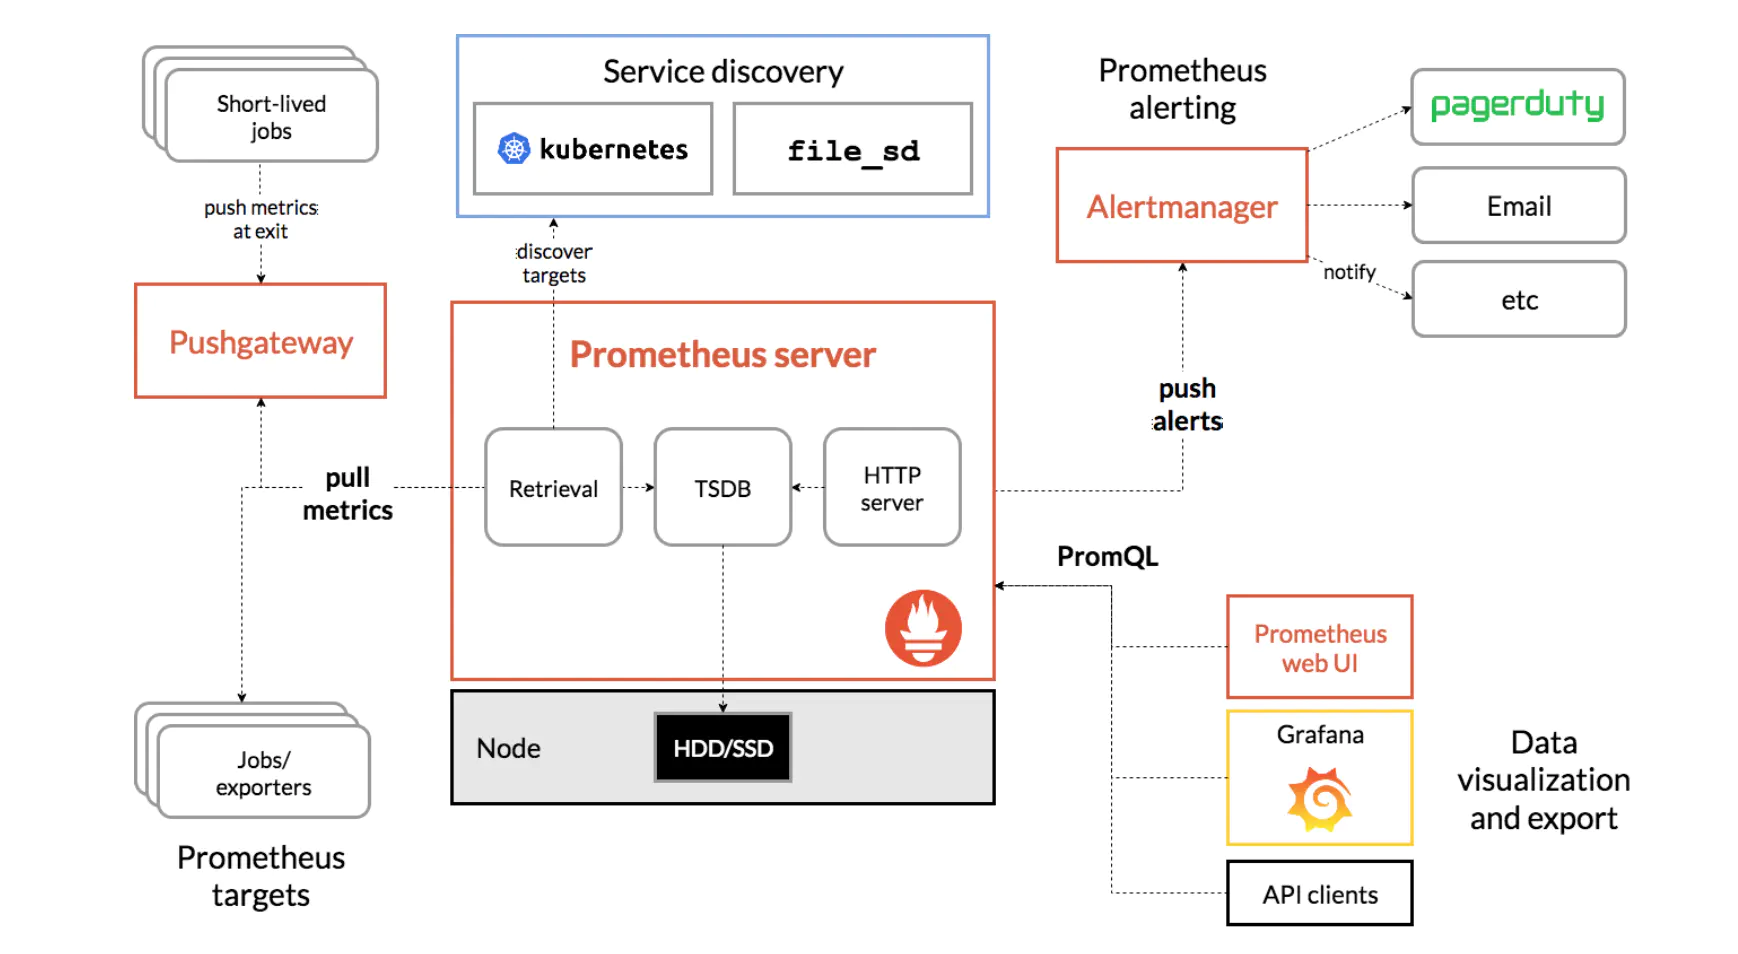
企业架构图: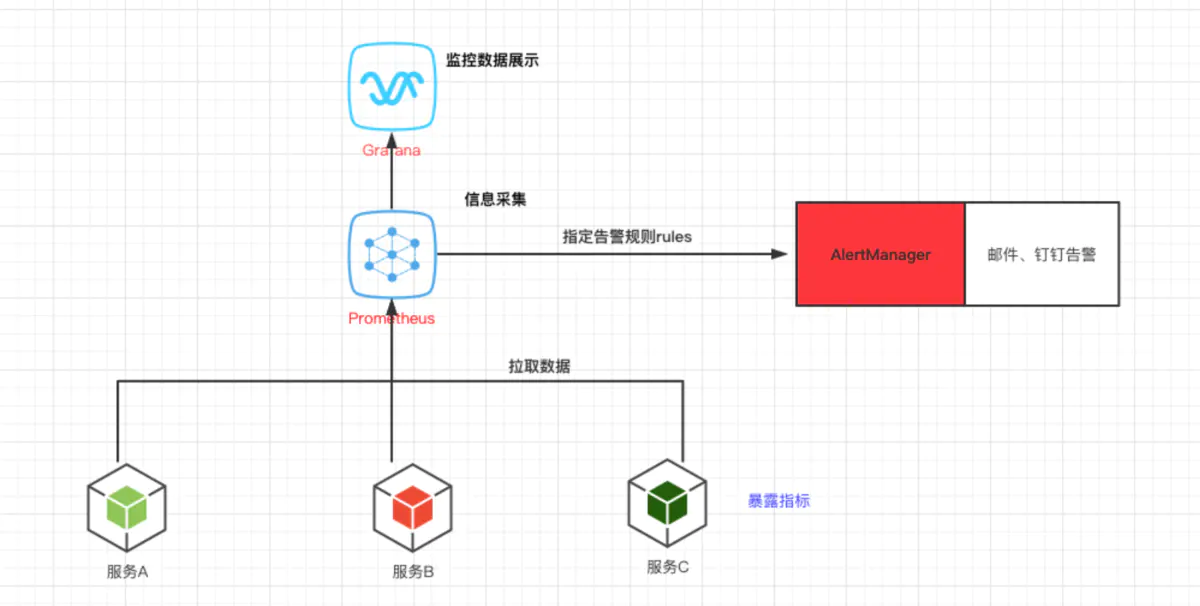
2、PromQL内置函数
A、聚合函数1)、sum (求和)对样本值求和;
比如:需要计算整个应用的HTTP请求总量,可以直接使用表达式:
sum(prometheus_http_requests_total)
2)、min (最小值)求取样本值中的最小者;
3)、max (最大值)求取样本值中的最大者;
4)、avg (平均值)对样本值求平均值,这是进行指标数据分析的标准方法;
5)、stddev (标准差)对样本值求标准差,以帮助用户了解数据的波动大小(或称之为波动程度);
6)、stdvar (标准差异)对样本值求方差,它是求取标准差过程中的中间状态;
7)、count (样本数量计数)对分组内的时间序列进行数量统计;
8)、count_values (对 value 进行计数)对分组内的时间序列的样本值进行数量统计;
count_values用于时间序列中每一个样本值出现的次数。count_values会为每一个唯一的样本值输出一个时间序列,并且每一个时间序列包含一个额外的标签。
例如:
count_values("count", prometheus_http_requests_total)
9)、bottomk (样本值最小的 k 个元素)顺序返回分组内的样本值最小的前k个时间序列及其值;
10)、topk (样本值最大的k个元素)逆序返回分组内的样本值最大的前k个时间序列及其值;
例如:获取HTTP请求数前5位的时序样本数据,可以使用表达式:
topk(5, prometheus_http_requests_total)
11)、quantile (分布统计)分位数用于评估数据的分布状态,该函数会返回分组内指定的分位数的值,即数值落在小于等于指定的分位区间的比例;
quantile用于计算当前样本数据值的分布情况quantile(φ, express)其中0 ≤ φ ≤ 1。
例如,当φ为0.5时,即表示找到当前样本数据中的中位数:
quantile(0.5, prometheus_http_requests_total)
B、其他函数
1)、abs(instant-vector) 求瞬时向量绝对值
2)、absent(v instant-vector) 传入一个瞬时非空向量则返回空向量,否则返回不带名称值为1的指标,用来监控空数据的情况
3)、ceil(v instant-vector) 四舍五入取整
ceil(v instant-vector) 将 v 中所有元素的样本值向上四舍五入到最接近的整数。例如:
node_load5{instance="192.168.1.15:8090"} # 结果为 2.79
ceil(node_load5{instance="192.168.1.15:8090"}) # 结果为 3
4)、floor(v instant-vector) 函数与 ceil() 函数相反,舍弃小数部分取整
5)、changes(v range-vector) 计算区间向量中每个样本值变化次数,返回的是瞬时向量
changes(v range-vector) 输入一个区间向量, 返回这个区间向量内每个样本数据值变化的次数(瞬时向量)。例如:
# 如果样本数据值没有发生变化,则返回结果为 1
changes(node_load5{instance="192.168.1.15:8090"}[1m]) # 结果为 1
6)、clamp_max(v instant-vector, max scalar) 瞬时向量值如果大于max 则值修改为max,否则值不变(用于将向量规范到一个不大于max的区间内)
clamp_max(v instant-vector, max scalar) 函数,输入一个瞬时向量和最大值,样本数据值若大于 max,则改为 max,否则不变。例如:
node_load5{instance="192.168.1.15:8090"} # 结果为 2.79
clamp_max(node_load5{instance="192.168.1.15:8090"}, 2) # 结果为 2
7)、clamp_min(v instant-vector, min scalar) 同理,将向量规范到一个不小于min值的范围内
clamp_min(v instant-vector, min scalar) 函数,输入一个瞬时向量和最小值,样本数据值若小于 min,则改为 min,否则不变。例如:
8)、day_of_month(v=vector(time()) instant-vector) 返回 1~31 向量所在UTC时间中的所在月份的第几天
9)、day_of_week(v=vector(time()) instant-vector) 函数,返回被给定 UTC 时间所在周的第几天。返回值范围:0~6,0 表示星期天。
10)、days_in_month(v=vector(time()) instant-vector) 函数,返回当月一共有多少天。返回值范围:28~31。
11)、delta(v range-vector) 的参数是一个区间向量,返回一个瞬时向量。它计算一个区间向量 v 的第一个元素和最后一个元素之间的差值
delta(v range-vector) 的参数是一个区间向量,返回一个瞬时向量。它计算一个区间向量 v 的第一个元素和最后一个元素之间的差值。
由于这个值被外推到指定的整个时间范围,所以即使样本值都是整数,你仍然可能会得到一个非整数值。
例如,下面的例子返回过去两小时的 CPU 温度差:
delta(cpu_temp_celsius{host="zeus"}[2h])
该函数一般只用在 Gauge 类型的时间序列上。
12)、idelta(v range-vector) 的参数是一个区间向量, 返回一个瞬时向量。它计算最新的 2 个样本值之间的差值。(当区间内仅有一个向量时无返回值)
13)、deriv(v range-vector) 的参数是一个区间向量,返回一个瞬时向量。它使用简单的线性回归计算区间向量 v 中各个时间序列的导数。
14)、exp(v instant-vector) 函数,输入一个瞬时向量,返回各个样本值的 e 的指数值,即 e 的 N 次方。当得到一个无穷大的值,显示 +Inf, 反之显示0, e的负数次方无限趋进0。e的空向量指数依然为空向量。
15)、year(v=vector(time()) instant-vector) 函数返回被给定 UTC 时间的当前年份。
16、hour(v=vector(time()) instant-vector) 函数返回被给定 UTC 时间的当前第几个小时,时间范围:0~23。
17)、minute(v=vector(time()) instant-vector) 函数返回给定 UTC 时间当前小时的第多少分钟。结果范围:0~59。
18)、month(v=vector(time()) instant-vector) 函数返回给定 UTC 时间当前属于第几个月,结果范围:0~12。
19)、increase(v range-vector) 函数获取区间向量中的第一个和最后一个样本并返回其增长量, 它会在单调性发生变化时(如由于采样目标重启引起的计数器复位)自动中断。
increase(v range-vector) 函数获取区间向量中的第一个和最后一个样本并返回其增长量,它会在单调性发生变化时(如由于采样目标重启引起的计数器复位)自动中断。
由于这个值被外推到指定的整个时间范围,所以即使样本值都是整数,你仍然可能会得到一个非整数值,如果除以一定时间就可以获取该时间内的平均增长率。
例如,以下表达式返回区间向量中每个时间序列过去 5 分钟内 HTTP 请求数的增长数:
increase(http_requests_total{job="apiserver"}[5m])
该函数配合counter数据类型使用,它的返回值类型只能是计数器类型。
20)、rate(v range-vector) 函数用于计算区间向量平均增长率,采用区间向量第一个值和最后值进行计算
rate(v range-vector) 函数可以直接计算区间向量 v 在时间窗口内平均每秒增长速率,它会在单调性发生变化时(如由于采样目标重启引起的计数器复位)自动中断。
该函数配合counter数据类型使用,它的返回值类型只能用计数器,在长期趋势分析或者告警中推荐使用这个函数。该函数的返回结果不带有度量指标,只有标签列表。
例如,以下表达式返回区间向量中每个时间序列过去 5 分钟内 HTTP 请求数的每秒增长率:
rate(http_requests_total[5m])
结果:
{code="200",handler="label_values",instance="120.77.65.193:9090",job="prometheus",method="get"} 0
{code="200",handler="query_range",instance="120.77.65.193:9090",job="prometheus",method="get"} 0
{code="200",handler="prometheus",instance="120.77.65.193:9090",job="prometheus",method="get"} 0.2
...
[info] 注意
当将 rate() 函数与聚合运算符(例如 sum())或随时间聚合的函数(任何以 _over_time 结尾的函数)一起使用时,必须先执行 rate 函数,然后再进行聚合操作,
否则当采样目标重新启动时 rate() 无法检测到计数器是否被重置。
# 统计平均时间
rate(http_server_requests_seconds_sum{uri="/recommend"}[1m])/rate(http_server_requests_seconds_count{uri="/recommend"}[1m])
21)、irate(v range-vector) 函数用于计算区间向量的增长率,但是其反应出的是瞬时增长率。irate 函数是通过区间向量中最后两个两本数据来计算区间向量的增长速率,它会在单调性发生变化时(如由于采样目标重启引起的计数器复位)自动中断。这种方式可以避免在时间窗口范围内的“长尾问题”,并且体现出更好的灵敏度,通过irate函数绘制的图标能够更好的反应样本数据的瞬时变化状态。
irate(v range-vector) 函数用于计算区间向量的增长率,但是其反应出的是瞬时增长率。
irate 函数是通过区间向量中最后两个两本数据来计算区间向量的增长速率,它会在单调性发生变化时(如由于采样目标重启引起的计数器复位)自动中断。
这种方式可以避免在时间窗口范围内的“长尾问题”,并且体现出更好的灵敏度,通过irate函数绘制的图标能够更好的反应样本数据的瞬时变化状态。
例如,以下表达式返回区间向量中每个时间序列过去 5 分钟内最后两个样本数据的 HTTP 请求数的增长率:
irate(http_requests_total{job="api-server"}[5m])
irate 只能用于绘制快速变化的计数器,在长期趋势分析或者告警中更推荐使用 rate 函数。因为使用 irate 函数时,速率的简短变化会重置 FOR 语句,形成的图形有很多波峰,难以阅读。
[info] 注意
当将 irate() 函数与聚合运算符(例如 sum())或随时间聚合的函数(任何以 _over_time 结尾的函数)一起使用时,必须先执行 irate 函数,然后再进行聚合操作,
否则当采样目标重新启动时 irate() 无法检测到计数器是否被重置。
# 统计访问 /recommend 的 qps
irate(http_server_requests_seconds_count{uri='/recommend'}[1m])
22)、label_join(v instant-vector, dst_label string, separator string, src_label_1 string, src_label_2 string, ...) 函数可以将时间序列 v 中多个标签 src_label 的值,通过 separator 作为连接符写入到一个新的标签 dst_label 中。可以有多个 src_label 标签。
存在 up{name="a", job="b"} 1, up{name="a", job="b"} 0 两个向量进行 label_join(up{name="a", job="b"}, "full_name", "-", "name", "job") 将会得到一个带有新label的向量
up{name="a", job="b", full_name="a-b"} 1
23)、label_replace(v instant-vector, dst_label string, replacement string, src_label string, regex string) 在原标签中匹配字符,放到目标标签中
24)、ln(v instant-vector) 计算瞬时向量 v 中所有样本数据的自然对数。
ln(0) = -lnf 负无穷
ln(lnf) = lnf
ln(负数) = Nan
转载请注明:张永清,来源于博客园: https://www.cnblogs.com/laoqing/p/16740541.html
ln(Nan) = Nan
25)、log2(v instant-vector) 函数计算瞬时向量 v 中所有样本数据的二进制对数。特殊情况同ln。
26)、log10(v instant-vector) 计算瞬时向量 v 中所有样本数据的十进制对数。特殊情况同ln。
27)、predict_linear(v range-vector, t scalar) 函数可以预测时间序列 v 在 t 秒后的值。它基于简单线性回归的方式,对时间窗口内的样本数据进行统计,从而可以对时间序列的变化趋势做出预测。
28)、resets(v range-vector) 的参数是一个区间向量。对于每个时间序列,它都返回一个计数器重置的次数。两个连续样本之间单调性发生变化被认为是一次计数器重置。
29)、round(v instant-vector, to_nearest=1 scalar) 函数与 ceil 和 floor 函数类似,返回向量中所有样本值的最接近to_nearest值整数倍的值,当to_nearest=1时等价于ceil。
30)、scalar(v instant-vector) 函数返回一个单元素瞬时向量的样本值,当多元素或者没有元素返回Nan。
31)、vector(s scalar) 函数将标量 s 作为没有标签的向量返回(和scalar作用刚好相反)。
32)、sort(v instant-vector) 函数对向量按元素的值进行升序排序。
33)、sort_desc(v instant-vector) 函数对向量按元素的值进行降序排序。
34)、sqrt(v instant-vector) 函数计算向量 v 中所有元素的平方根。
转载请注明:张永清,来源于博客园: https://www.cnblogs.com/laoqing/p/16740541.html
35)、timestamp(v instant-vector) 函数返回向量 v 中的每个样本的时间戳(从 1970-01-01 到现在的秒数)。
36)、avg_over_time(range-vector) : 区间向量内每个度量指标的平均值。
37)、min_over_time(range-vector) : 区间向量内每个度量指标的最小值。
38)、max_over_time(range-vector) : 区间向量内每个度量指标的最大值。
39)、sum_over_time(range-vector) : 区间向量内每个度量指标的求和。
40)、count_over_time(range-vector) : 区间向量内每个度量指标的样本数据个数。
3、指标类型
Prometheus定义了4中不同的指标类型(metric type):Counter(计数器)、Gauge(仪表盘)、Histogram(直方图)、Summary(摘要)。
比如在NodeExporter返回的样本数据中,其注释中也包含了该样本的类型。例如:
# HELP node_cpu_seconds_total Seconds the cpus spent in each mode.
# TYPE node_cpu_seconds_total counter
node_cpu_seconds_total{cpu="0",mode="idle"} 927490.95
node_cpu_seconds_total{cpu="0",mode="iowait"} 27.74...
1)、Counter
统计的数据是递增的,不能使用计数器来统计可能减小的指标,计数器统计的指标是累计增加的,如http请求的总数,出现的错误总数,总的处理时间,api请求数等
第一次抓取 http_response_total{method="GET",endpoint="/api/tracks"} 100
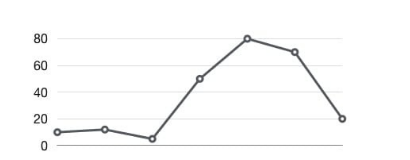
第二次抓取 http_response_total{method="GET",endpoint="/api/tracks"} 150由于Counter类型的监控指标其特点是只增不减,在没有发生重置(如服务器重启,应用重启)的情况下其样本值应该是不断增大的。为了能够更直观的表示样本数据的变化剧烈情况,需要计算样本的增长速率。
载如下图所示,样本增长率反映出了样本变化的剧烈程度:
可以通过以下表达式计算Counter类型指标的增长率:
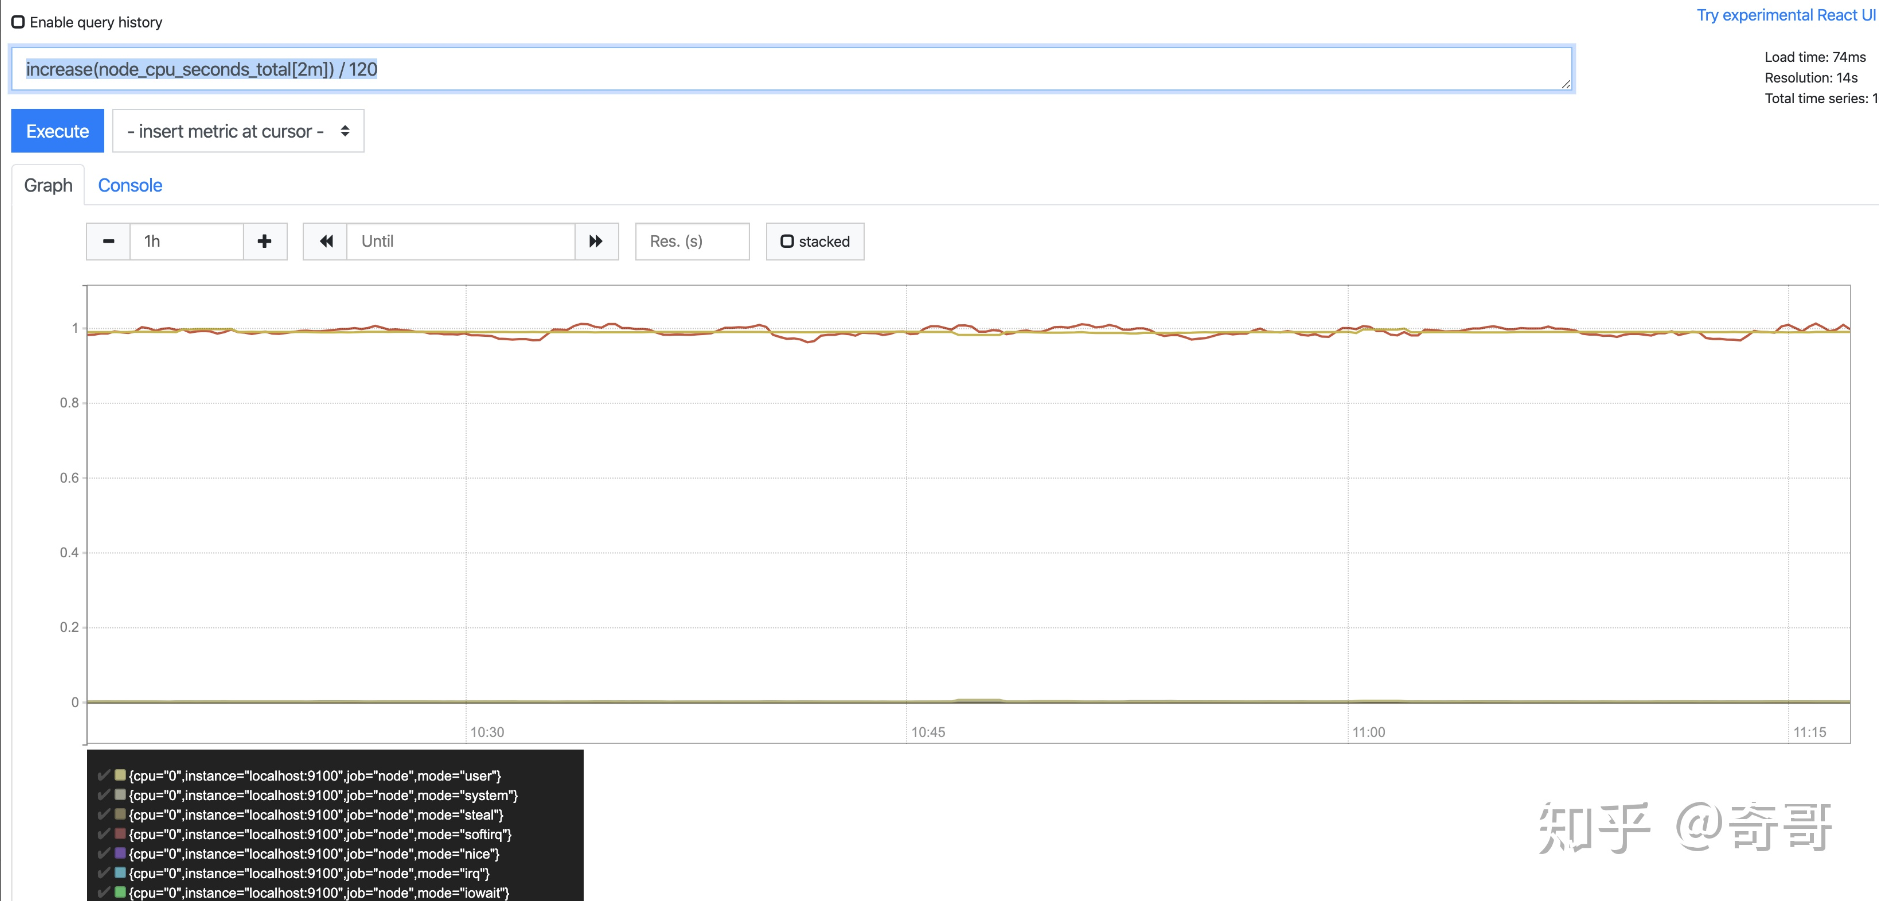
#下面两句话取出来的结果是一样的,只不过rate()是直接算出区间向量的平均速率,而increase()你要自己去除于秒数。
increase(node_cpu_seconds_total[2m]) / 120
rate(node_cpu_seconds_total[2m])
increase函数:这里通过node_cpu_seconds_total[2m]获取时间序列最近两分钟的所有样本,increase计算出最近两分钟的增长量,
最后除以时间120秒得到node_cpu_seconds_total样本在最近两分钟的平均每秒增长率。并且这个值也近似于主机节点最近两分钟内的平均CPU使用率。
rate()函数:该函数配合counter类型数据使用,取counter在这个时间段中的平均每秒增量。比方CPU在2分钟增长了200,那么结果就是200/120。
2)、Gauge
量规是一种度量标准,代表可以任意上下波动的单个数值,用于统计cpu使用率,内存使用率,磁盘使用率,温度等指标,还可以统计上升和下降的计数。如并发请求数等。
例如:
 第1次抓取 memory_usage_bytes{host="master-01"} 100
 第2秒抓取 memory_usage_bytes{host="master-01"} 30
 第3次抓取 memory_usage_bytes{host="master-01"} 50
 第4次抓取 memory_usage_bytes{host="master-01"} 80
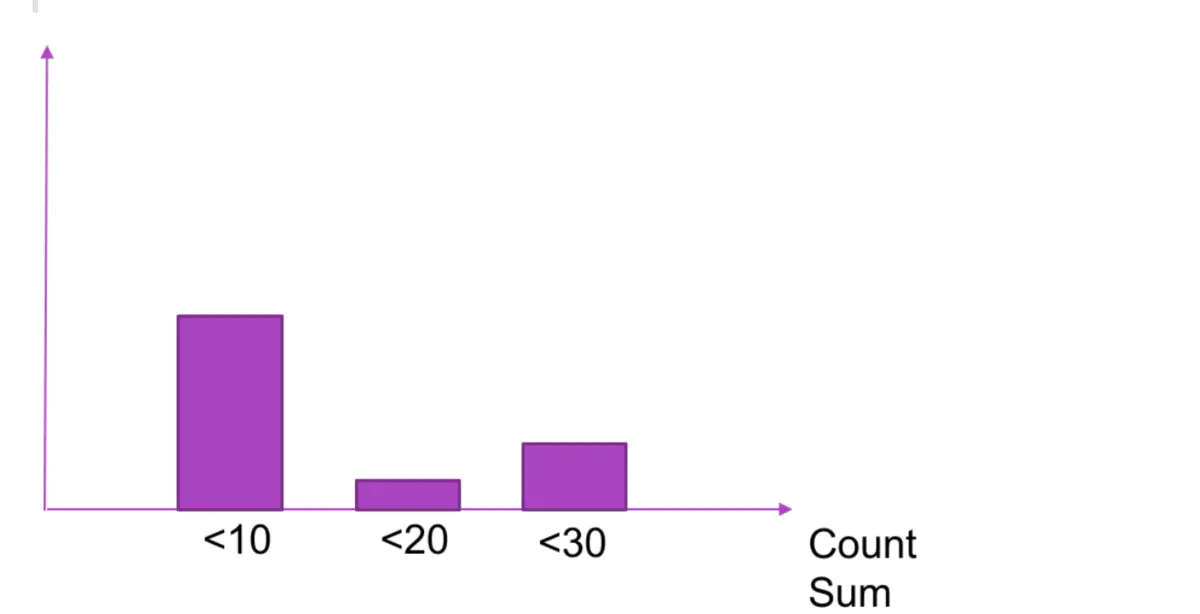
3)、Histogram
统计在一定的时间范围内数据的分布情况。如请求的持续/延长时间,请求的响应大小等,还提供度量指标的总和,数据以直方图显示。Histogram由_bucket{le=""},
转载请注明:张永清,来源于博客园: https://www.cnblogs.com/laoqing/p/16740541.html
_bucket{le="+Inf"}, _sum,_count 组成
如:
apiserver_request_latencies_sum
apiserver_request_latencies_count
apiserver_request_latencies_bucket
histogram_quantile(φ float, b instant-vector) 从 bucket 类型的向量 b 中计算 φ (0 ≤ φ ≤ 1) 分位数(百分位数的一般形式)的样本的最大值。(有关 φ 分位数的详细说明以及直方图指标类型的使用,请参阅直方图和摘要)。向量 b 中的样本是每个 bucket 的采样点数量。每个样本的 labels 中必须要有 le 这个 label 来表示每个 bucket 的上边界,没有 le 标签的样本会被忽略。直方图指标类型自动提供带有 _bucket 后缀和相应标签的时间序列。
可以使用 rate() 函数来指定分位数计算的时间窗口。
例如,一个直方图指标名称为 employee_age_bucket_bucket,要计算过去 10 分钟内 第 90 个百分位数,请使用以下表达式:
histogram_quantile(0.9, rate(employee_age_bucket_bucket[10m]))
返回:
{instance="10.0.86.71:8080",job="prometheus"} 35.714285714285715
这表示最近 10 分钟之内 90% 的样本的最大值为 35.714285714285715。
这个计算结果是每组标签组合成一个时间序列。我们可能不会对所有这些维度(如 job、instance 和 method)感兴趣,并希望将其中的一些维度进行聚合,则可以使用 sum() 函数。例如,以下表达式根据 job 标签来对第 90 个百分位数进行聚合:
## 计算TP95
histogram_quantile(0.95, http_server_requests_seconds_bucket{uri='/recommend'})
4)、Summary
和Histogram直方图类似,主要用于表示一段时间内数据采样结果(通常是请求持续时间或响应大小之类的东西),还可以计算度量值的总和和度量值的分位数以及在一定时间范围内的分位数,由{quantile="<φ>"},_sum,_count 组成
 <dependency>
      <groupId>io.micrometer</groupId>
      <artifactId>micrometer-registry-prometheus</artifactId>
       <version>1.6.1</version>
</dependency>

  <dependency>
      <groupId>io.micrometer</groupId>
       <artifactId>micrometer-spring-legacy</artifactId>
       <version>1.3.15</version>
</dependency>
配置访问地址
#endpoints.prometheus.path=${spring.application.name}/prometheus
management.metrics.tags.application = ${spring.application.name}
2)、Springboot2.X
maven 依赖
 <dependency>
    <groupId>org.springframework.boot</groupId>
    <artifactId>spring-boot-starter-actuator</artifactId>
  </dependency>

      <dependency>
            <groupId>io.micrometer</groupId>
            <artifactId>micrometer-core</artifactId>
        </dependency>

        <dependency>
            <groupId>io.micrometer</groupId>
            <artifactId>micrometer-registry-prometheus</artifactId>
        </dependency>
配置访问地址
#Prometheus springboot监控配置
management:
  endpoints:
    web:
      exposure:
        include: 'prometheus' # 暴露/actuator/prometheus
  metrics:
    tags:
      application: ${spring.application.name} # 暴露的数据中添加application label
指标自定义开发:
import com.slightech.marvin.api.visitor.app.metrics.VisitorMetrics;
import com.slightech.marvin.api.visitor.app.service.VisitorStatisticsService;
import io.micrometer.core.instrument.MeterRegistry;
import org.springframework.beans.factory.annotation.Autowired;
import org.springframework.beans.factory.annotation.Value;
import org.springframework.boot.actuate.autoconfigure.metrics.MeterRegistryCustomizer;
import org.springframework.context.annotation.Bean;
import org.springframework.context.annotation.Configuration;

/**
 * @author wanglu
 */
@Configuration
public class MeterConfig {

    @Value("${spring.application.name}")
    private String applicationName;
    @Autowired
    private VisitorStatisticsService visitorStatisticsService;
    @Bean
    public MeterRegistryCustomizer<MeterRegistry> configurer() {
        return (registry) -> registry.config().commonTags("application", applicationName);
    }

    @Bean
    public VisitorMetrics visitorMetrics() {
        return new VisitorMetrics(visitorStatisticsService);
    }
}
import io.micrometer.core.instrument.Gauge;
import io.micrometer.core.instrument.MeterRegistry;
import io.micrometer.core.instrument.binder.MeterBinder;

/**
 * @author wanglu
 * @date 2019/11/08
 */
public class VisitorMetrics implements MeterBinder {

    private static final String METRICS_NAME_SPACE = "visitor";

    private VisitorStatisticsService visitorStatisticsService;

    public VisitorMetrics(VisitorStatisticsService visitorStatisticsService) {
        this.visitorStatisticsService = visitorStatisticsService;
    }

    @Override
    public void bindTo(MeterRegistry meterRegistry) {
         //公寓获取二维码次数-当天
        //visitor_today_apartment_get_qr_code_count{"application"="xxx", "option"="apartment get qr code"}
        Gauge.builder(METRICS_NAME_SPACE + "_today_apartment_get_qr_code_count", visitorStatisticsService, VisitorStatisticsService::getTodayApartmentGetQrCodeCount)
                .description("today apartment get qr code count")
                .tag("option", "apartment get qr code")
                .register(meterRegistry);
                 //visitor_today_apartment_get_qr_code_count{"application"="xxx", "option"="employee get qr code"}
                 //员工获取二维码次数-当天
        Gauge.builder(METRICS_NAME_SPACE + "_today_employee_get_qr_code_count", visitorStatisticsService, VisitorStatisticsService::getTodayEmployeeGetQrCodeCount)
                .description("today employee get qr code count")
                .tag("option", "employee get qr code")
                .register(meterRegistry);
    }
}
import org.springframework.beans.factory.annotation.Autowired;
import org.springframework.data.redis.core.RedisTemplate;
import org.springframework.scheduling.annotation.Async;
import org.springframework.stereotype.Service;
import java.util.Calendar;
import java.util.Date;
import java.util.concurrent.TimeUnit;
/**
 * 数据统计
 *
 * @author laijianzhen
 * @date 2019/11/08
 */
@Service
public class VisitorStatisticsService {
    /**
     * 公寓获取二维码次数-当天
     */
    private static final String COUNT_TODAY_APARTMENT_GET_QR_CODE_REDIS_KEY = "Visitor:Statistics:CountTodayApartmentGetQrCode";
    /**
     * 员工获取二维码次数-当天
     */
    private static final String COUNT_TODAY_EMPLOYEE_GET_QR_CODE_REDIS_KEY = "Visitor:Statistics:CountTodayEmployeeGetQrCode";

    @Autowired
    private RedisTemplate<String, Object> redisTemplate;

    public int getTodayApartmentGetQrCodeCount() {
        return getCountFromRedis(COUNT_TODAY_APARTMENT_GET_QR_CODE_REDIS_KEY);
    }

    public int getTodayEmployeeGetQrCodeCount() {
        return getCountFromRedis(COUNT_TODAY_EMPLOYEE_GET_QR_CODE_REDIS_KEY);
    }

    @Async
    public void countTodayApartmentGetQrCode() {
        increaseCount(COUNT_TODAY_APARTMENT_GET_QR_CODE_REDIS_KEY);
    }

    @Async
    public void countTodayEmployeeGetQrCode() {
        increaseCount(COUNT_TODAY_EMPLOYEE_GET_QR_CODE_REDIS_KEY);
    }

    private int getCountFromRedis(String key) {
        Object object = redisTemplate.opsForValue().get(key);
        if (object == null) {
            return 0;
        }
        return Integer.parseInt(String.valueOf(object));
    }

    private void increaseCount(String redisKey) {
        Object object = redisTemplate.opsForValue().get(redisKey);
        if (object == null) {
            redisTemplate.opsForValue().set(redisKey, String.valueOf(1), getTodayLeftSeconds(), TimeUnit.SECONDS);
            return;
        }
        redisTemplate.opsForValue().increment(redisKey, 1);
    }

    private long getTodayLeftSeconds() {
        Date nowDate = new Date();
        Calendar midnight = Calendar.getInstance();
        midnight.setTime(nowDate);
        midnight.add(Calendar.DAY_OF_MONTH, 1);
        midnight.set(Calendar.HOUR_OF_DAY, 0);
        midnight.set(Calendar.MINUTE, 0);
        midnight.set(Calendar.SECOND, 0);
        midnight.set(Calendar.MILLISECOND, 0);
        return (midnight.getTime().getTime() - nowDate.getTime()) / 1000;
    }
}
5、Grafana内置参数
$__dashboard
当前dashboard的名称
$__from $__to
时间范围的毫秒值
可自定义格式,比如:{$__from: date :YYYY-MM-DD HH:mm:ss} {$__from: date :seconds}
$__interval
查询的时间间隔,包含单位,比如:30s,2m
$__interval_ms
查询的时间间隔,毫秒值
$__range
查询的时间区间大小,包含单位,比如:2d
$__range_s $__range_ms
查询的时间区间大小,分别是秒数和毫秒数
$__timeFilter
返回当前选择的时间范围表达式,比如:time > now() -7d,常用于数据库作为datasource的时候。

 浙公网安备 33010602011771号