反思视频摘要的评估标准
由本人翻译自原文链接,为追求顺口和易于理解并未严格按照原文翻译,为此也在翻译下方提供了原文。
摘要 Abstract
视频摘要是这样一种技术,其对原始视频进行简短概述,同时还保留了主要故事/内容。随着可用素材(视频)数量的迅猛增长,自动化这一块就大有可为了。公共基准数据集促进了近阶段自动化技术的进展,咱们现在更容易也更公平地比较不同的自动化方法。目前已建立的评估协议, 其将机器生成的摘要与数据集提供的一组参考摘要进行比较。在本文中,我们将使用两个流行的基准测试数据集对该管道进行深入评估。我们惊奇的发现,随机生成的摘要居然与最先进的摘要算法性能相当甚至更好。在某些情况下,随机摘要的表现甚至优于留一法实验中人工生成的摘要。
Video summarization is a technique to create a short skim of the original video while preserving the main stories/content. There exists a substantial interest in automatizing this process due to the rapid growth of the available material. The recent progress has been facilitated by public benchmark datasets, which enable easy and fair comparison of methods. Currently the established evaluation protocol is to compare the generated summary with respect to a set of reference summaries provided by the dataset. In this paper, we will provide in-depth assessment of this pipeline using two popular benchmark datasets. Surprisingly, we observe that randomly generated summaries achieve comparable or better performance to the state-of-the-art. In some cases, the random summaries outperform even the human generated summaries in leave-one-out experiments.
此外,结果表明,视频分割对性能指标的影响最为显著。而通常来说,视频分割是提取视频摘要的固定预处理方法。基于我们的观察,我们提出了评估重要性得分的替代方法,以及估计得分和人工标注之间相关性的直观可视化方法。
Moreover, it turns out that the video segmentation, which is often considered as a fixed pre-processing method, has the most significant impact on the performance measure. Based on our observations, we propose alternative approaches for assessing the importance scores as well as an intuitive visualization of correlation between the estimated scoring and human annotations.
1.介绍 Introduction
随手可得的视频素材数量激增,使得对技术的需求也与日俱增,这样才能使用户能够快速浏览和观看视频。一种补救方法是自动视频摘要,其用来生成一个简短的视频概览,保留原始视频中最重要的内容。例如,体育赛事的原始画面可以压缩成几分钟的摘要,只保留重要事件,如进球、点球等。
The tremendous growth of the available video material has escalated the demand for techniques that enable users to quickly browse and watch videos. One remedy is provided by the automatic video summarization, where the aim is to produce a short video skim that preserve the most important content of the original video. For instance, the original footage from a sport event could be compressed into a few minute summary illustrating the most important events such as goals, penalty kicks, etc.
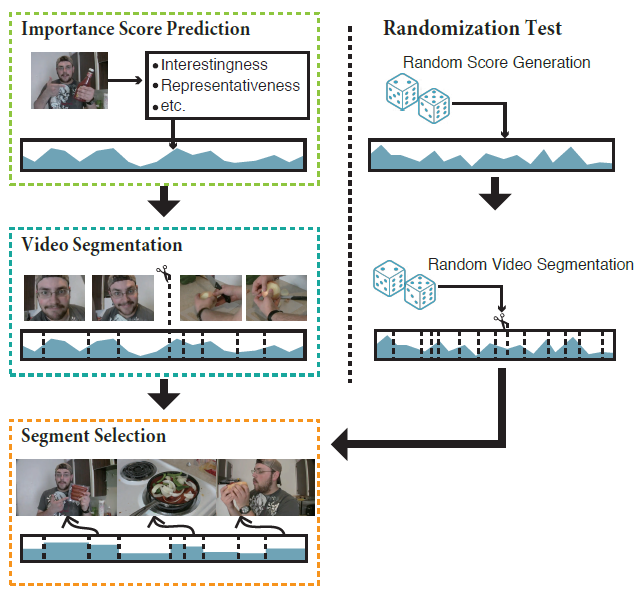
图1: 一个常用的视频摘要管道和我们的随机化测试的说明。我们利用随机总结来验证当前的评估框架。
Figure 1. An illustration of the commonly used video summarization pipeline and our randomization test. We utilize random summaries to validate the current evaluation frameworks.
各种文献中已经提出了许多自动摘要方法。如图1所示,最新的方法,其范式由视频分割、重要性评分预测和视频片段选择组成。该流程中最具挑战性的部分就是是重要性评分预测,其任务是突出显示对视频内容最重要的部分。多种因素都会影响视频部分的重要性,一旦采用的重要性标准不同,单个视频的视频摘要就可能不同。事实上,之前的研究已经提出了多种重要性标准,如视觉趣味性[2,3]、紧凑性(即冗余较小)[28]和多样性[25,29]。
Numerous automatic summarization methods have been proposed in the literature. The most recent methods follow a paradigm that consists of a video segmentation, importance score prediction, and video segment selection as illustrated in Figure 1. The most challenging part of this pipeline is the importance score prediction, where the task is to highlight the parts that are most important for the video content. Various factors affect importance of video parts, and different video summaries are possible for a single video given a different criterion of importance. In fact, previous works have proposed a variety of importance criteria, such as visual interestingness[2, 3], compactness(i.e., smaller redundancy) [28], and diversity [25, 29].
尽管人们对自动视频摘要做了大量的研究,但仍不知道如何评估生成的摘要的合理性。
- 一个直接但令人信服的方法就是主观评价生成的摘要是否合理,然而,收集人类的反应代价昂贵,而且由于人的主观性,实验结果基本不可以重现结果;
- 另一种方法,是将生成的视频摘要与一组由人类标注员准备的固定参考摘要进行比较。为此,会邀请人类标注员手工创建视频摘要,然后这些视频摘要被视为
标准答案(ground truth)。该方法的优点是参考摘要可以重用,即不同的视频摘要方法可以在不反复添加人工标注的情况下进行评估,实验可以重现。
Despite the extensive efforts toward automatic video summarization, the evaluation of the generated summaries is still an unsolved problem. A straightforward but yet convincing approach would be to utilise a subjective evaluation; however, collecting human responses is expensive, and reproduction of the result is almost impossible due to the subjectivity. Another approach is to compare generated video summaries to a set of fixed reference summaries prepared by human annotators. To this end, the human annotators are asked to create video summaries, which are then treated as ground truth. The advantage of this approach is the reusability of the reference summaries, i.e., different video summarization methods can be evaluated without additional annotations and the experiments can be reproduced.
最常用的数据集是SumMe[2]和TVSum[18],这些数据集都用于以参考为基础的评估。他们为每个原始视频都提供了一组视频,此外还提供了多人为这些视频生成的参考摘要(或重要性分数)。两个数据集使用的基本评估方法,就是使用F1评分(F1 Score)来衡量机器生成的摘要与人工生成的参考摘要之间的一致性。SumMe和TVSum自问世以来,在近期的视频综述文献中被广泛采用[3,12,21,25,26,27,29]。然而,基于参考摘要的评估方法是否真的有效,这些文献中并未提及。
The most popular datasets used for reference based evaluations are SumMe[2] and TVSum[18]. These datasets provide a set of videos as well as multiple human generated reference summaries (or importance scores) for each original video. The basic evaluation approach, used with both datasets, is to measure the agreement between the generated summary and the reference summaries using F1 score. Since their introduction, SumMe and TVSum have been widely adopted in the recent video summarization literature [3, 12, 21, 25, 26, 27, 29]. Nevertheless, the validity of reference summary-based evaluation has not been previously investigated.
本文利用SumMe[2]和TVSum[18]数据集,对当前基于参考摘要的评估框架进行了深入研究。我们将首先审查框架,然后应用随机测试来评估结果的质量。我们提出的随机化测试,基于随机重要性评分和随机视频分割来生成视频摘要。这样生成的摘要提供了一个基本分数,可以通过偶然实验获得。
This paper delves deeper into the current reference based evaluation framework using SumMe [2] and TVSum [18] datasets. We will first review the framework and then apply a randomization test to assess the quality of the results. The proposed randomization test generates video summaries based on random importance scores and random video segmentation. Such summaries provide a baseline score that is achievable by chance.
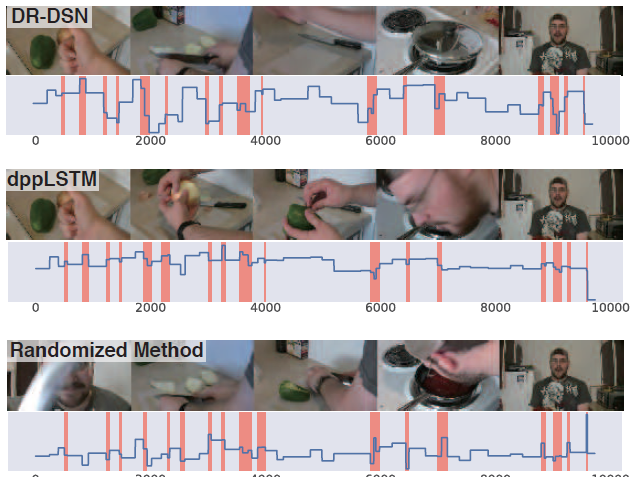
图2:比较两种最近的方法创建的摘要和我们的随机方法所创建的摘要(第4节)。蓝色的线表示
多帧特征(segment level)相对于时间(帧)的重要性得分。橙色区域表示为最终摘要选择的帧。三种方法都使用相同的KTS[14]分割边界。有趣的是,尽管重要性得分明显不同,但所有方法(包括随机方法)产生了非常相似的输出。
Figure 2. Comparison of summaries created by two recent methods and our randomized method (Section 4). The blue line shows thesegment levelimportance scores with respect to time (frames). The orange areas indicate the frames selected for the final summary. All of the three methods use the same segment boundaries by KTS [14]. Interestingly, all methods (including the randomone) produce very similar outputs despite clear differences in the importance scores.
图2说明了我们工作的一个主要发现。结果发现,“随机方法”完全无视视频内容进行重要分数预测,但得出的摘要与最先进的方法几乎相同。更深入的分析表明,虽然重要性分数有差异,但在汇总以得到最终摘要时,这些差异被忽略了。随机化测试揭示了当前视频摘要评估方案的重大缺陷,这促使我们提出了一个新的框架用于评估重要性排名。
Figure 2 illustrates one of the main findings of our work. It turned out that the random method produces summaries that are almost identical to the state-of-the-art despite the fact that it is not using the video content at all for importance score prediction. Deeper analysis shows that while
there are differences in the importance scores they are ignored when assembling the final summary. The randomization test revealed critical issues in the current video summa summarization evaluation protocol, which motivated us to propose a new framework for assessing the importance rankings.
本论文的主要贡献如下:
The main contributions of this paper are as follows:
- 我们评估了当前基于参考摘要的评估框架的有效性,并揭示了这样的事实,即一种随机方法也能够达到与当前最先进的技术相似的性能分数。
We assess the validity of the current reference summary-based evaluation framework and reveal that a random method is able to reach similar performance scores as the current state-of-the-art.
- 我们证明了广泛使用的F1评分主要是由视频片段长度的分布决定的。我们的分析为这一现象提供了一个简单的解释。
We demonstrate that the widely used F1 score is mostly determined by the distribution of video segment lengths. Our analysis provides a simple explanation for this phenomenon.
- 我们演示了使用
预测排序和人类标注员排序之间的相关性,来评估重要性排名。此外,我们还提出了几种可视化方法,让我们能够洞察预测得分与随机得分之间的关系。
We demonstrate evaluating the importance rankings using correlation between the predicted ordering and the ordering by human annotators. Moreover, we propose several visualisations that give insight to the predicted scoring versus random scores.
2. 相关工作 Related Work
2.1. 视频摘要 Video Summarization
文献中提出了一系列不同的视频摘要方法。有一组作品是通过测量视觉趣味性[2]来检测重要镜头,如视觉特征的动态性[8],视觉显著性[11]。Gygli等人[3]结合了多种属性,包括显著性、美学和帧画面中是否有人。
A diverse set of video summarization approaches have been presented in the literature. One group of works aim at detecting important shots by measuring the visual interestingness [2], such as dynamics of visual features [8], and visual saliency [11]. Gygli et al. [3] combined multiple properties including saliency, aesthetics, and presence of people in the frames.
另一组方法通过丢弃冗余镜头[28]来实现紧凑性。最大化输出视频的代表性和多样性,这也是最近的作品中被广泛使用的标准[1,14,25]。这些方法都是基于这样一个假设:一个好的摘要应该具有多样化的内容,采样的镜头还要能解释原视频中的事件。
Another group of methods aims at compactness by discarding redundant shots [28]. Maximization of representativeness and diversity in the output video are also widely used criteria in the recent works [1, 14, 25]. These methods are based on the assumption that a good summary should have diverse content while the sampled shots explain the events in the original video.
最近,人们提出了基于LTSM的深度神经网络模型,可以直接预测人类标注者[26]给出的重要性评分。采用行列式点过程(determinantal point process)[7]对模型进行了扩展,以保证分割选择的多样性。最后,Zhou等人[21]使用强化学习获得了一种帧选择策略,来最大化生成的摘要的多样性和代表性。
Recently, LSTM-based deep neural network models have been proposed to directly predict the importance scores given by the human annotators [26]. The model is also extended with determinantal point process [7] to ensure diverse segment selection. Finally, Zhou et al. [21] applied reinforcement learning to obtain a policy for the frame selection in order to maximize the diversity and representativeness of the generated summary.
尽管这些工作使用不同的重要性标准,但其中许多都使用类似的处理管道。
- 首先,对原始视频中的每一帧进行重要度评分;
- 其次,将得到的视频分割成短片段。
- 最后,通过在背包(背包算法)约束下最大化重要分数来选择视频片段子集,生成输出摘要。
Although these works use various importance criteria, many of them employ a similar processing pipeline. Firstly, the importance scores are produced for each frame in the original video. Secondly, the obtained video is divided into short segments. Finally, the output summary is generated by selecting a subset of video segments by maximising the importance scores with the knapsack constraint.
2.2. 视频摘要评估 Video Summary Evaluation
视频摘要的评估是一项具有挑战性的任务。这主要是由于主观性质的质量标准在作祟,多个观众之间的分歧会导致标准不同,不同的时间点进行评估也会导致标准不同。用于评估的视频和标注数量有限,也进一步放大了模糊性问题。
The evaluation of a video summary is a challenging task. This is mainly due to subjective nature of the quality criterion that varies from viewer to viewer and from one time instant to another. The limited number of evaluation videos and annotations further magnify this ambiguity problem.
大多数早期工作[10,11,19]以及一些近期的工作[22]都采用了用户研究,即观众对每个视频作品[10,15,23]单独的视频摘要的质量进行主观评分。这种方法的关键缺点是相关的成本高和可重复性低。也就是说,即使让同样的观众再次评价同样的视频,也无法得到相同的评价结果。
Most early works [10, 11, 19] as well as some recent works [22] employ user studies, in which viewers subjectively score the quality of output video summaries prepared solely for the respective works [10, 15, 23]. The critical shortcoming in such approach is the related cost and reproducibility. That is, one cannot obtain the same evaluation results, even if the same set of viewers would re-evaluate the same videos.
许多最近的工作反而通过与人工参考摘要进行比较来评价它们生成的摘要。
- Khosla等人[5]提出,在参考摘要和生成的摘要中,使用关键帧之间的像素级距离。
- Lee等人使用包含感兴趣对象的帧数作为相似性度量。
- Gong等人[1]计算由人类标注员选择的关键帧的精确度和召回率。
- Yeung等人[24]提出了不同的方法,其基于文本描述评估摘要的语义相似度,为此,他们生成了一个以自我为中心的长视频数据集,其中的片段用文本描述进行了注释。该框架主要使用场景是:基于用户查询的视频摘要评估[13,16]。
最近,计算人工参考摘要和机器生成摘要之间的重叠,已经成为视频摘要评价的标准框架[2,3,14,17,18,28]。
Many recent works instead evaluate their summaries by comparing them to reference summaries. Khosla et al. [5] proposed to use the pixel-level distance between keyframes in reference and generated summaries. Lee et al. [9] use number of frames that contain objects of interest as a similarity measure. Gong et al. [1] compute precision and recall scores over keyframes selected by human annotators. Yeung et al. [24] propose a different approach and evaluate the semantic similarity of the summaries based on textual descriptions. For this, they generated a dataset with long egocentric videos for which the segments are annotated with textual descriptions. This framework is mainly used to evaluate video summaries based on user queries [13, 16]. More recently, computing overlap between reference and generated summaries has become the standard framework for video summary evaluation [2, 3, 14, 17, 18, 28].
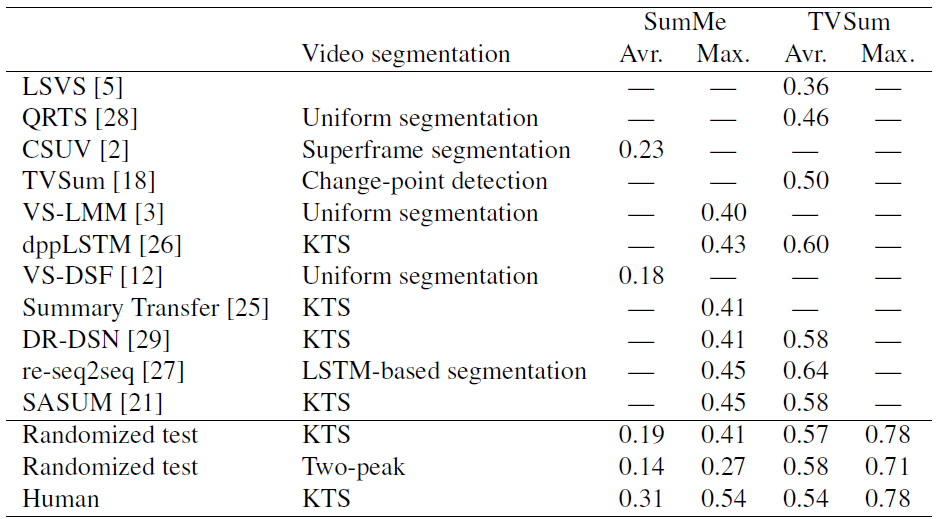
表1。在最近的工作报告中,F1衡量SumMe和TVSum基准。
Average (Avr)表示F1在所有参考摘要中的平均得分,maximum (Max)表示参考摘要[3]中的最高F1得分。此外,我们展示了随机测试和人工标注(留一法测试)的F1值。可以注意到,随机摘要的结果可以与最先进的技术媲美,甚至可以与人工标注媲美。
Table 1. The F1 measures for SumMe and TVSum benchmarks as reported in recent works. Average (Avr) denotes the average of F1 scores over all reference summaries and maximum (Max) denotes the highest F1 score within the reference summaries [3]. In addition, we show the F1 values for our randomized test and human annotations (leave-one-out test). It can be noted that random summaries achieve comparable results to the state-of-the-art and even to human annotations.
本文研究了将生成的摘要与一组人工标注的参考摘要进行比较的评估框架。目前,有两个公共数据集有助于这种类型的评估。SumMe[2]和TVSum[18]数据集提供手动创建的参考摘要,是目前最流行的评估基准。SumMe数据集包含了从人类标注员处收集的个人视频和相应的参考摘要,这样的标注员一般有15-18个。TVSum数据集为YouTube视频提供的镜头级别的重要性得分。大多数文献使用机器生成摘要与人工参考摘要之间的F1测度作为绩效指标。表1显示了两个数据集的报告分数。SumMe数据集大约有15个不同的人工参考摘要,它有两种可能的方法来聚合F1分数:一种是计算所有人工参考摘要上F1度量的平均值,另一种是使用最大分数。
This paper investigates the evaluation framework where generated summaries are compared to a set of human annotated references. Currently, there are two public datasets that facilitate this type of evaluation. SumMe [2] and TVSum [18] datasets provide manually created reference summaries and are currently the most popular evaluation benchmarks. The SumMe dataset contains personal videos and the corresponding reference summaries collected from 15–18 annotators. The TVSum dataset provides shot-level importance scores for YouTube videos. Most of the literature uses the F1 measure between generated summaries and reference summaries as a performance indicator. Table 1 shows reported scores for both datasets. The SumMe dataset, which has around 15 different reference summaries, has two possible ways for aggregating the F1 scores: One is to compute an average of F1 measures over all reference summaries, and the other is to use the maximum score.
3. 目前的评估框架 Current evaluation framework
3.1. SumMe
SumMe是一个视频摘要数据集,包含从YouTube获得的25条个人视频。这些视频是未经编辑或最低限度编辑的。该数据集为每个视频提供了15-18个人工参考摘要。人工标注者单独制作参考摘要,使每个摘要的长度小于原视频长度的15%。为了进行评估,机器生成的摘要在长度上也要受到同样的限制。
SumMe is a video summarization dataset that contains 25 personal videos obtained from the YouTube. The videos are unedited or minimally edited. The dataset provides 15–18 reference summaries for each video. Human annotators individually made the reference summaries so that the length of each summary is less than 15% of the original video length. For evaluation, generated summaries should be subject to the same constraint on the summary length.
3.2. TVSum
TVSum包含50个YouTube视频,每个视频都有一个标题和一个类别标签作为元数据。TVSum数据集不提供人工参考摘要,而是对每个视频进行处理,视频以两秒为单位提供人工标注的重要性评分。为了进行评估,根据这些重要度分数,按照以下步骤生成具有预定义长度的类参考摘要:
- 首先,将视频分成短视频段,短视频段与生成的摘要段长度相同。
- 然后,对视频片段内的重要性得分进行平均,得到一个片段级的重要性得分。
- 最后,通过找到一个片段子集,使摘要中的总重要性得分最大化,生成一个类参考摘要。
这种方法的优点是能够生成所需长度的摘要。
TVSum contains 50 YouTube videos, each of which has a title and a category label as metadata. Instead of providing reference summaries, the TVSum dataset provides human annotated importance scores for every two second of each video. For evaluation, the reference summaries, with a predefined length, are generated from these importance scores using the following procedure: Firstly, videos are divided into short video segments, which are the same as in the generated summary. Then, the importance scores within a video segment are averaged to obtain a segment-level importance score. Finally, a reference summary is generated by finding a subset of segments that maximizes the total importance score in the summary. The advantage of this approach is the ability to generate summaries with desired length.
3.3. 评价指标 Evaluation measure
最常用的评价方法是计算预测和人工参考摘要之间的F1测度(F1 measure)。设 表示一个标签,表示机器从原始视频中选择了哪些帧进入摘要(即,如果第i帧被选择,则 = 1,否则为0)。对于用户参考摘要,给定类似的标签 ,则F1得分定义为
(1)
其中
and (2)
是帧级的精确度和召回率得分。N为原始视频的总帧数。
译者注: 上面的公式可以简化为下面的公式,是用户标注的高光部分,是机器标注的高光部分,而则是用户和机器标注的高光重合部分。
and (2)
The most common evaluation approach is to compute F1 measure between the predicted and the reference summaries.
Let denote a label indicating which frames from the original video is selected to the summary (i.e. = 1 if the i-th frame is selected and otherwise 0). Given similar label for the references summary, the F1 score is defined as
(1)
where
and (2)
are the frame level precision and recall scores. N denotes the total number of frames in the original video.
在实验中,分别计算每个人工参考摘要的F1得分,这些得分汇总方式有两种,要么是视频平均值,要么是视频最大值。前一种方法意味着,生成的摘要应该包含最多的一致片段,而后者认为所有人类标注员都提供了合理的重要性分数。因此,如果机器生成的摘要与至少一个人工参考摘要匹配,那么它应该有较高的分数。
In the experiments, the F1 score is computed for each reference summary separately and the scores are summarised either by averaging or selecting the maximum for each video. The former approach implies that the generated summary should include segments with largest number of agreement, while the latter argue that all human annotators provided reasonable importance scores and thus the generated summary should have high score if it matches at least one of the reference summaries.
4. 随机测试 Randomization test
通常视频摘要管道由三个部分组成;重要性分数估计,视频分割,镜头选择(图1)。我们设计了一个随机测试来评估每个部分对最终评估分数的贡献。在这些实验中,我们利用随机重要分数和随机视频分割生成独立于视频内容的视频摘要。其中,每一帧的重要度得分独立于一个均匀分布[0,1]。当需要时,通过平均池化相应的帧级随机分数来产生段级分数。对于视频分割,我们使用下面这些选项:
Commonly video summarization pipeline consists of three components; importance score estimation, video segmentation, and shot selection (Figure 1). We devise a randomization test to evaluate the contribution of each part to the final evaluation score. In these experiments we generate video summaries that are independent of video content by utilising random importance scores and random video segment boundaries. Specifically, the importance score for each frame is drawn independently from an uniform distribution [0, 1]. When needed, the segment-level scores are produced by average pooling the corresponding frame-level random scores. For video segmentation, we utilise the options defined below.
- 统一分割将视频分割为固定时长的片段。我们在实验中使用了60帧,这大致相当于2秒(SumMe和TVSum数据集的帧率分别为30 fps和25 fps)。
**Uniform segmentation **divides the video into segments of constant duration. We used 60 frames in our experiments, which roughly corresponds to 2 seconds (the frame rates in SumMe and TVSum datasets are 30 fps and 25 fps, respectively).
- 单峰分割从单峰分布中采样每个片段中的帧数。我们假设相邻
镜头边界(shot boundry)之间的帧数服从事件率的泊松分布。
One-peak segmentation samples the number of frames in each segment from an unimodal distribution. We assume that the number of frames between adjacent shot boundaries follow the Poisson distribution with event rate .
- 双峰分割类似于单峰版本,但利用双峰分布,即,两个泊松分布的混合,其事件率分别是和。对于抽样,我们从两个等概率的泊松分布中随机选择一个,然后对帧的数量进行抽样。因此,一个视频被分为较长和较短的片段,但是一个片段中的期望帧数是60帧。除了完全随机的方法,我们还要多评估一种常用的分割方法,及其结合随机分数后的变种方法。
Two-peak segmentation is similar to one-peak version, but utilises bimodal distribution, i.e., a mixture of two Poisson distributions, whose event rates are and ,respectively. For sampling, we randomly choose one of the two Poisson distributions with the equal probability and then sample the number of frames. Consequently, a video is segmented into both longer and shorter segments, yet the expected number of frames in a segment is 60 frames.In addition to the completely random methods, we assess one commonly used segmentation approach and its variation in conjunction with the random scores.
- 基于核的时域分割(KTS)[14]基于视频的视觉内容,它是最近视频摘要文献中应用最广泛的方法(表1)。KTS通过检测视觉特征的变化产生以分割边界。如果视觉特征没有发生显著变化,视频片段往往会很长。
Kernel temporal segmentation (KTS) [14] is based on the visual content of a video and is the most widely used method in the recent video summarization literature (Table 1). KTS produces segment boundaries by detecting changes in visual features. A video segment tends to be long if visual features do not change considerably.
- 随机化KTS首先用KTS分割视频,然后打乱分割顺序;因此,段长分布与KTS完全相同,但分割边界与视觉特征不同步。
Randomized KTS first segments the video with KTS and then shuffles the segment ordering; therefore, the distribution of segment lengths is exactly the same as KTS’s, but the segment boundaries are not synchronized with the visual features.
由这些随机和部分随机的摘要作为基线(这样的基线可以完全由偶然获得),得到F1分数。合理的评估框架,会给产生合理重要性分数的方法打高分。此外,人们会期望,人类生成的标准答案(ground truth)摘要应该会在留一法实验中获得高分。
F1 scores obtained by these randomized (and partially randomized) summaries serve as a baseline that can be achieved completely by chance. Reasonable evaluation framework should produce higher scores for methods that are producing sensible importance scores. Furthermore, one would expect that human generated ground truth summaries should produce top scores in leave one out experiments.
4.1. 对SumMe数据集的分析 Analysis on the SumMe dataset
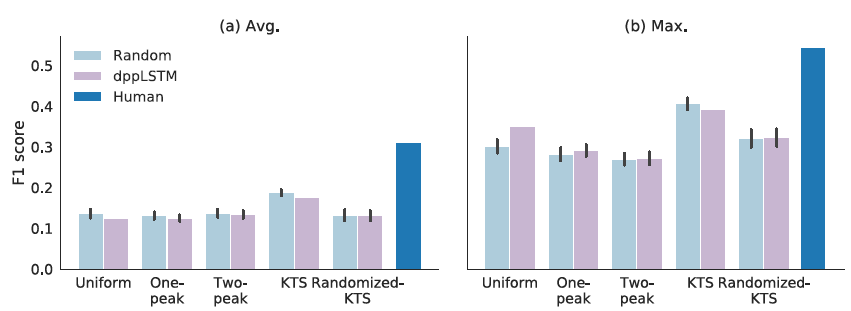
图3:F1为SumMe的不同分割和重要性分数组合。浅蓝色条表示随机摘要,深蓝条表示人工创建的参考摘要的分数(留一法测试)。紫色条表示不同分割方法下DR-DSN重要性评分。左:F1平均分数相对于参考摘要的平均值。右:最大分数的平均值。
Figure 3. F1 scores for different segmentation and importance score combinations for SumMe. Light blue bars refer to random summaries and dark blue bars indicate scores of manually created reference summaries (leave-one-out test). Purple bars show the scores for DR-DSN importance scoring with different segmentation methods. Left: the average of mean F1 scores over reference summaries. Right: the average of the maximum scores.
图3显示了使用我们的随机化方法的不同版本以获得的F1分数(平均值和最大值)(请参阅前面的部分)。我们针对每种 随机的设置,进行了100次试验,黑色条是95%置信区间。此外,同样的图包含每种随机分割方法对应的F1分数,但使用的是最近发布的一种方法DR-DSN[29]的帧级重要性分数。人工参考摘要的性能是通过留一法来实现的。在这种情况下,通过平均每个参考摘要获得的F1分数(avg或max)来计算最终结果。
Figure 3 displays the F1 scores (average and maximum) obtained with different versions of our randomized method (see previous section). We performed 100 trials for every random setting and the black bar is the 95% confidence interval. In addition, the same figure contains the corresponding F1 scores for each random segmentation method, but using frame level importance scores from one recently published methods DR-DSN [29]. The reference performance is obtained using human created reference summaries in leave-one-out scheme. In this case, the final result is calculated by averaging the F1 scores (avg or max) obtained for each reference summary.
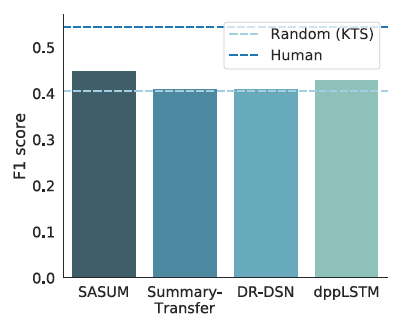
图4:最近报道的SumMe中使用KTS分割方法的F1分数。采用KTS分割的随机摘要的平均得分用浅蓝色虚线表示。
Figure 4. Recently reported F1 scores for methods using KTS segmentation in SumMe. The average score for random summaries with KTS segmentation is represented by a light blue dashed line.
有趣的是,我们观察到性能明显由分割方法决定,并且对重要性评分有很小的影响(如果有的话)。 此外,人类性能和最佳性能的自动方法之间的差异布局在量级上类似于分割方法之间的差异。图4展示了SumMe数据集最新的结果。 令人惊讶的是,具有随机重要性分数的KTS分割获得了与最好的公布方法相当的性能。 第4.3节对此现象提供了可能的解释。
Interestingly, we observe that the performance is clearly dictated by the segmentation method and there is small (if any) impact on the importance scoring. Moreover, the difference between human performance and the best performing automatic method is similar in magnitude to the differences between the segmentation approaches. Figure 4 illustrates the recent state-of-the-art results for SumMe dataset. Surprisingly, KTS segmentation with random importance scores obtains comparable performance to the best published methods. Section 4.3 provides possible explanations for this phenomenon.
4.1.1 人对SumMe的评价 Human Evaluation on SumMe
我们进行了人类评估,以比较SumMe数据集上的摘要。受试者比较两个视频摘要,并决定哪一个视频摘要更好地总结了原始视频。在第一个实验中,我们要求受试者对使用随机重要性评分和DR-DSN评分生成的视频摘要进行评分。两种方法都使用KTS分割。总体而言,随机评分略高于DR-DSN评分,然而,46%的答案都认为他们同样好(或同样差)。这一结果与第4.1节中的观察结果一致,即重要性评分几乎不会影响SumMe数据集上的评估评分。我们还用随机重要性评分比较了KTS分割和均匀分割。因此,对于记录长时间活动的视频,如参观自由女神像、水肺潜水等,被试更倾向于统一分割。另一方面,KTS更适合于有重大事件或活动的视频。对于这类视频,重要部分的歧义性较小,因此根据机器生成的摘要与人类参考摘要的一致性,可以得到较高的F1分数。人体评价的详细结果见补充资料。
We conducted human evaluation to compare summaries on the SumMe dataset. Subjects compare two video summaries and determine which video better summarizes the original video. In the first experiment, we asked subjects to rate video summaries generated using random importance scores and DR-DSN scores. Both methods use KTS segmentation. Overall, random scores got a slightly higher score than DR-DSN, however, 46% of answers were that the summaries are equally good (bad). This result agree with the observation in the Section 4.1 that the importance scoring hardly affects the evaluation score on the SumMe dataset. We also compare KTS and uniform segmentation with random importance scoring. As a result, subjects prefer uniform segmentation for videos recording long activity, e.g., sightseeing of the statue of liberty and scuba diving. On the other hand, KTS works better for videos with notable events or activities. For such videos, the important parts have little ambiguity, therefore the F1 scores based on the agreement between generated summaries and reference summaries can get higher. For the detailed results of the human evaluation, see the supplementary material.
4.2. TVSum数据集分析 Analysis on TVSum dataset
TVSum数据集不包含人类参考摘要,而是包含原始视频中每2秒片段的人工标注的重要性分数。这种方法的主要优点是能够生成任意长度的参考摘要。也可以使用不同的分割方法。基于这些原因,TVSum为研究重要性评分和分割在当前评估框架中的作用,提供了一个很好的工具。
Instead of reference summaries, TVSum dataset contains human annotated importance scores for every 2 second segment in the original video. The main advantage of this approach is the ability to generate reference summaries of arbitrary length. It is also possible to use different segmentation methods. For these reasons, TVSum provides an excellent tool for studying the role of importance scoring and segmentation in the current evaluation framework.

图5。对于TVSum数据集,不同的分割方法结合随机或人工标注的重要性评分(
留一法)的F1分数。浅蓝条表示随机得分,深蓝条表示人工标注。有趣的是,在大多数情况下,随机注释和人工注释获得了类似的F1分数。
Figure 5. F1 scores for different segmentation methods combined to either random or human annotated importance scores (leave-one-out) for TVSum dataset. Light blue bars refer to random scores and dark blue bars indicates human annotations. Interestingly, the random and human annotations obtain similar F1 scores in most cases.
图5显示了不同分割方法的F1评分,其中使用了随机重要性评分和人工标注的重要性评分。在后一种情况下,结果是使用留一法计算的。令人惊讶的是,对于大多数分割方法,随机的重要性分数具有与人工标注相似的性能。另外,完全随机双峰分割与基于内容的KTS分割效果相当。此外,表1中的结果表明,我们的随机结果与文献中报告的最佳结果是相同的(或至少是一个层级,可以一搏的)。统一分割和单峰分割不能达到相同的结果,但在这些情况下,更好的重要性评分似乎是有帮助的。总的来说,取得的结果突出了,当前基于F1的评估框架所面临的挑战。
Figure 5 displays the F1 scores for different segmentation methods using both random and the human annotated importance scores. In the latter case, the results are computed using leave-one-out procedure. Surprisingly, for the most of the segmentation methods, the random importance scores have similar performance as human annotations. In addition, the completely random two-peak segmentation performs equally well as content based KTS segmentation. Furthermore, the results in Table 1 illustrate that our random results are on-par (or at least comparable) with the best reported results in the literature. The uniform and one-peak segmentation do not reach the same results, but in these cases the better importance scoring seems to help.In general, the obtained results highlight the challenges in utilizing the current F1 based evaluation frameworks.
4.3. 讨论 Discussion
正如在前几节中所观察到的,随机摘要产生了惊人的高性能分数。结果与最先进的水平相当,有时甚至超过了人类的水平。特别是当我们用因片段长度而产生较大变化的分割方法(即双峰、KTS和随机KTS)时,更容易产生较高的F1分数。在视频摘要方法中,最常用到的算法是背包算法,在执行背包算法时,通过检验片段长度对选择过程的影响,咱们可以理解这一结果。
As observed in the previous sections, the random summaries resulted in surprisingly high performance scores. The results were on-par with the state-of-the-art and sometimes surpassed even the human level scores. In particular, the segmentation methods that produce large variation in the segment length (i.e. two-peak, KTS, and randomized KTS) produced high F1 scores. The results may be understood by examining how the segment length affects on selection procedure in the knapsack formulation that is most commonly adopted in video summarization methods.
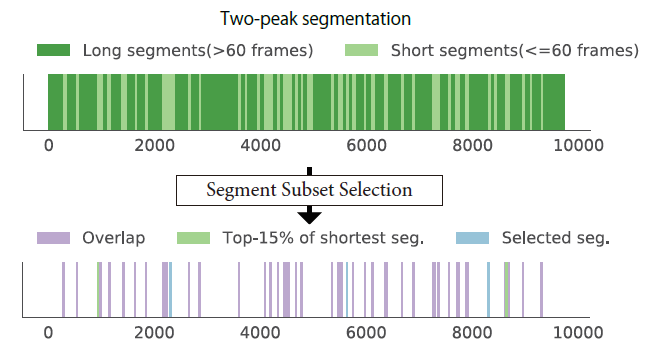
图6:从摘要中隐式丢弃长段,只选择短段。上图:绿色和浅绿色区域显示由
双峰分割方法产生的分段边界。下图为动态规划算法选择的片段(蓝色),以及前15%的最短视频片段(浅绿色),以及它们之间重叠的片段(紫色)。请注意,大多数被选中的部分都在最短的分段中。
Figure 6. Long segments are implicitly discarded from the summary and only short segments are selected. Top: Green and light green areas visualize segment boundaries generated by the twopeak segmentation method. Bottom plot shows segments selected by dynamic programming algorithm (blue), and top 15% of the shortest video segments (light green), and segments overlapping between them (Purple). Notice that the most of the selected parts are within the group of the shortest segments.
通常用于背包算法的动态规划求解器有这样的逻辑:分段只有满足以下条件才会被选择,即,相对于由一组短小分段拼接成的长分段,其对总得分的影响更大。换句话说,只有当如下情况才会选择片段A:即不存在组合长度小于A的片段B+C,且B+C对总分的影响大于或等于A时。
在当前的摘要任务中,较长的片段很少出现这种情况,因此摘要通常只由较短的片段组成。这种现象极大地限制了分段子集选择的合理性。例如,双峰分割模式分别为30帧和90帧的两个分布中提取段长度;因此,我们可以粗略地说,较长的片段占据了总长度的三分之二。如果这些较长的片段都被丢弃,生成的摘要只包含原始视频的剩余三分之一。对于生成长度为原始视频时长15%的摘要,无论相关的重要性分数如何,大多数片段都希望被用于生成和参考摘要的共享。图6说明了这一点。由于同样的原因,如果所有分段都具有相同的长度,那么重要性分数的影响更大(参见图5中统一的单峰结果)。
A dynamic programming solver, commonly used for the knapsack problem, selects a segment only if the corresponding effect on the overall score is larger than that of any combination of remaining segments whose total length is shorter. In other words, a segment A is selected only if there are no segments B and C whose combined length is less than A and the effect to total score is more or equal to A. This is rarely true for longer segments in the current summarization tasks, and therefore the summary is usually only composed of short segments. This phenomenon significantly limits the reasonable choices available for segment subset selection.
For example, two-peak segmentation draws a segment length from two distributions whose modes are 30 frames and 90 frames; therefore, we can roughly say that longer segments occupies two-third of the total length. If these longer segments are all discarded, the generated summary only consists of the rest one-third of the original video.For generating a summary whose length is 15% of the original video duration, most of the segments are expected to be shared for generated and reference summaries regardless of associated importance scores. This is illustrated in Figure 6. Due to the same reason, the importance scores have more impact if all the segments have equal length (see uniform and one-peak results in Figure 5).
使用帧级分数的总和可以缓解挑战;然而,大多数工作采用平均值,因为这大大提高F1在TVSum上的分数。对于摘要而言,人工摘要明显优于随机摘要,但我们仍然可以看到分割方法在最终摘要生成中的重要性。4.1节中对SumMe数据集的结果说明了另一个挑战。对于这个数据集,基于KTS的参考摘要获得了非常高的性能分数。KTS使用时隐隐地包含了小冗余策略,旨在创建一个视觉上无冗余的视频摘要。也就是说,KTS将视觉上相似的帧组合成一个片段。因此,长片段很可能是多余的,不那么生动,因此他们不那么有趣。人类标记者也不愿意在他们的摘要中包含这样的片段。与此同时,动态规划在选择分割子集时,也避免了前面讨论的长分段。因此,生成的摘要往往符合人类的偏好。
Using the sum of frame-level scores may alleviate the challenge; however, most works instead employ averaging because this drastically increases F1 scores on TVSum. With summation, human summary clearly outperforms random ones, but we can still see the effect of segmentation. The results on SumMe dataset in Section 4.1 illustrate another challenge. For this dataset, KTS-based references obtain really high performance scores. The use of KTS implicitly incorporate small-redundancy strategy, which aims to create a visually non-redundant video summary. That is, KTS groups visually similar frames into a single segment. Therefore, long segments are likely to be redundant and less lively and thus they are less interesting. Human annotators would not like to include such segments in their summaries. Meanwhile, the dynamic programming-based segment subset selection tends to avoid long segments as
discussed above. Thus generated summaries tend to match the human preference.
5. 重要性评分评价框架 Importance score evaluation framework
上述挑战表明了,目前的基准并不适用于评估重要性分数的质量。与此同时,近年来的视频综述文献大多针对重要分数的预测提出了相应的方法。为了克服这个问题,我们提出了一种新的评估方法。
The aforementioned challenges render the current benchmarks inapplicable for assessing the quality of the importance scores. At the same time, most of the recent video summarization literature present methods particularly for importance score prediction. To overcome this problem, we present a new alternative approach for the evaluation.
5.1. 使用等级顺序统计量进行评估 Evaluation using rank order statistics
在统计学中,等级相关系数是比较顺序关联(即排名之间的关系)的成熟工具。我们利用这些工具来比较由机器生成的和人类标注的帧级别重要性分数(如[20]),从而测量他们所提供的隐式排名之间的相似性。
In statistics, rank correlation coefficients are well established tools for comparing the ordinal association (i.e. relationship between rankings). We take advantage of these tools in measuring the similarities between the implicit rankings provided by generated and human annotated frame level importance scores as in [20].
更准确地说,我们使用Kendall的[4]和Spearman的[6]相关系数。为了得到结果,我们首先根据机器生成的重要性分数和人工标注的参考分数(每个标注者一个排名)对视频帧进行排序。在第二阶段,我们将生成的排名与每个参考排名进行比较。最后的相关分数是通过平均每个结果得到的。
More precisely, we use Kendall’s [4] and Spearman’s [6] correlation coefficients. To obtain the results, we first rank the video frames according to the generated importance scores and the human annotated reference scores (one ranking for each annotator). In the second stage, we compare the generated ranking with respect to each reference ranking. The final correlation score is then obtained by averaging over the individual results.

表2:在TVSum数据集上,计算不同
重要性得分与人工标注得分之间的 Kendall's 和 Spearman's 相关系数。
Table 2. Kendall’s and Spearman’s correlation coefficients computed between differentimportance scoresandmanually annotated scoreson TVSum dataset.
我们通过评估两种最新的视频摘要方法(dppLSTM[26]和DR-DSN[29])来演示排名相关的度量方法。对于这两种方法,我们都使用了原始作者提供的实现。对于完整性检查,我们还使用随机评分来计算结果,根据定义,它应该产生零平均分数。这些结果是通过为每个原始视频生成100个均匀分布的随机值序列[0,1],并对得到的相关系数进行平均得到的。人的表现是使用留一法产生的。表2总结了从TVSum数据集获得的结果。
We demonstrate the rank order correlation measures, by evaluating two recent video summarization methods (dppLSTM [26] and DR-DSN [29]). For both methods, we utilise the implementations provided by the original authors. For sanity check, we also compute the results using random scoring, which by definition should produce zero average score. These results are obtained by generating 100 uniformly-distributed random value sequences in [0, 1] for each original video and averaging over the obtained correlation coefficients. The human performance is produced using leave-one-out approach. Table 2 summarizes the obtained results for TVSum dataset.
总的来说,测试方法和随机评分之间有明显的区别。此外,人工标注的相关系数显著高于其他任何方法,这证实了人类重要性得分之间存在相关性。从测试方法来看,dppLSTM结果比DR-DSN具有更高的性能。这是有意义的,因为dppLSTM专门用于预测人类标注的重要性分数,而DR-DSN旨在最大限度地增加生成摘要内容的多样性。然而,这两种方法都明显优于随机评分。
Overall, the metric shows a clear difference between tested methods and the random scoring. In addition, the correlation coefficient for human-annotations is significantly higher than for any other method, which confirms that human importance scores correlate to each other. From the tested methods, dppLSTM results in higher performance compared to DR-DSN. This makes sense, since dppLSTM is particularly trained to predict human annotated importance scores, while DR-DSN aims at maximizing the diversity of the content in the generated summaries. However, both methods clearly outperform the random scoring.
我们进一步研究重要性得分的相关度量方法与输出视频摘要质量之间的关系。我们比较了使用两种重要性分数生成的视频摘要,即与人工标注正相关/负相关的的重要性分数。人工评价结果表明,重要性分数为正相关的视频摘要表现优于其他。结果的细节在补充材料中。
We further investigate the relation between the correlation measures for importance scores and the quality of output video summaries. We compare video summaries generated using importance scores which positively correlate with human annotations and those using importance scores with negative correlation. The result of human evaluation demonstrated that video summaries generated using importance scores with positive correlation outperformed others. The details of the result are in the supplementary material.
5.2. 可视化重要性得分相关性 Visualizing importance score correlations
评估视频摘要的主要挑战之一是人工标注之间的不一致性。事实上,虽然人工标注的相关系数在表2中最高,但其绝对值仍然较低。这源于重要分数标注的主观性和模糊性。我们可以想象,视频中重要的东西可能是高度主观的,标注者可能认为其在视频中很重要,也可能认为其不值一提。此外,即使标注者同意某个视频内容很重要,视频中也可能有多个部分以不同的观点和表达方式,展现了相同的内容。从这些部分进行选择可能仍然是模糊的问题。
One of the main challenges in the evaluation of video summaries is the inconsistency between the humanannotations. In fact, although the human annotations result in the highest correlation coefficient in Table 2, the absolute value of the correlation is still relatively low. This stems from subjectivity and ambiguity in the importance score annotation. As we can imagine, what is important in a video can be highly subjective, and the annotators may or may not agree. Furthermore, even if the annotators agree that a certain video content is important, there can be multiple parts in a video that contain the same content in different viewpoints and expressions. Selection from these parts may still be ambiguous problem.
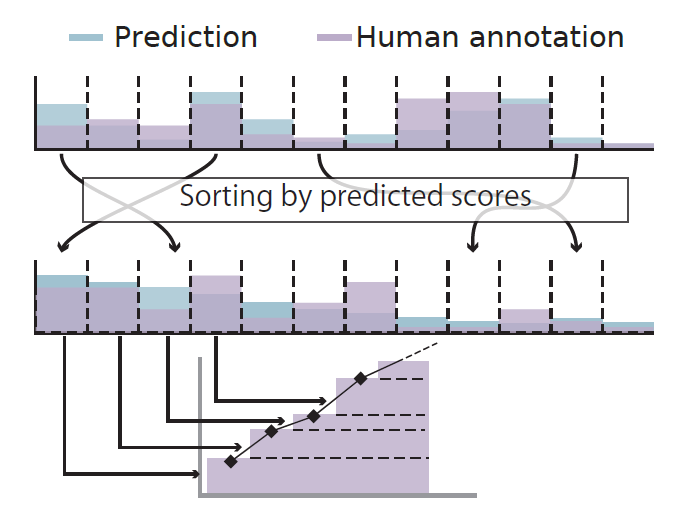
图7:分数曲线形成概述。
Figure 7. Overview of the score curve formation.
为了突出标注中的变化,我们建议,将预测的相对于参考标注的重要性评分,进行排序,进行可视化。为此:
- 我们首先计算相对于人类标注员的
帧级平均得分。 - 在第二阶段,我们根据预测的重要性得分按降序对帧进行排序(图7中)。
- 在最后一步,我们根据第二阶段得到的排名来累积平均的参考分数。更精确地说,
这里面 表示排序后的视频中第i帧的人类标注的平均得分。分母中的标准化因子确保最大值等于1。如图7(下图)所示, 在经过排序的帧上形成单调递增的曲线。如果预测得分与人类得分有很高的相关性,那么曲线会迅速上升。类似的曲线也可以用留一法来计算人类得分。
To highlight the variation in the annotations, we propose to visualize the predicted importance score ranking with respect to the reference annotations. To do this, we first compute the frame level average scores over the human annotators. In the second stage, we sort the frames with respect to the predicted importance scores in descending order (Figure 7, middle). In the final step, we accumulate the averaged reference scores based on the ranking obtained in the second stage. More precisely,
where denotes the average human-annotated score for the i-th frame in the sorted video. The normalization factor in the denominator ensures that the maximum value equals to 1. As shown in Figure 7 (bottom), forms a monotonically increasing curve over the sorted frames. If the predicted scores have high correlation to human scores, the curve should increase rapidly. Similar curves can be produced for the human scores using leave-one-out approach.
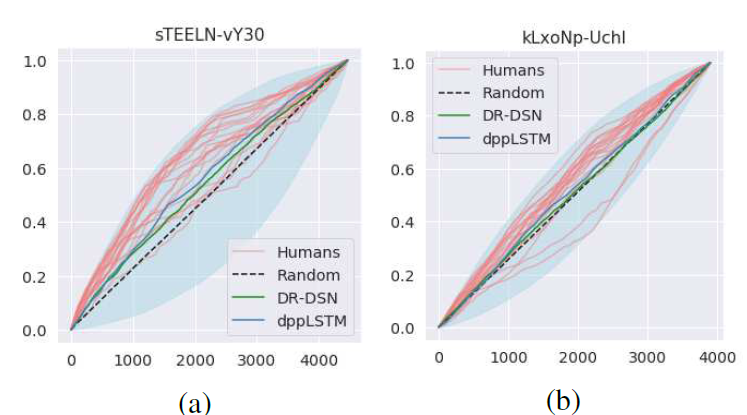
图8:从TVSum数据集为两个视频生成的示例相关曲线(
sTEELN-vY30和kLxoNp-UchI是视频id)。红线表示每个人类标注员的相关曲线,黑色虚线表示随机重要性分数的期望。蓝色和绿色曲线分别为dppLSTM和DR-DSN方法的结果。更多结果请参阅补充材料。
Figure 8. Example correlation curves produced for two videos from TVSum dataset (sTEELN-vY30 and kLxoNp-UchI are video ids). The red lines represent correlation curves for each human annotator and the black dashed line is the expectation for a random importance scores. The blue and green curves show the corresponding results to dppLSTM and DR-DSN methods, respectively. See supplementary material for more results.
图8显示了从TVSum数据集生成的两个视频的相关曲线。红线表示每个人类标注员的at曲线,黑色虚线表示随机重要性分数的期望。蓝色和绿色曲线分别为dppLSTM和DR-DSN方法的结果。浅蓝色表示相关曲线所在的区域。也就是说,当预测的重要性分数与人类标注的平均分数完全一致时,即基于分数的排名相同,曲线位于浅蓝色区域的上界。另一方面,当分数排名与参考顺序相反时,曲线与区域的下界重合。
Figure 8 shows correlation curves produced for two videos from TVSum dataset. The red lines show the at curve for each human annotator and the black dashed line is the expectation for a random importance scores. The blue and green curves show the corresponding results to dppLSTM and DR-DSN methods, respectively. The light-blue colour illustrates the area, where correlation curves may lie. That is, when the predicted importance scores are perfectly concordant with averaged human-annotated scores, i.e., the score based rankings are the same, the curve lies on the upper bound of the light-blue area. On the other hand, a curve coincides with the lower bound of the the area when the ranking of the scores is in a reverse order of the reference.
大多数人类标注员获得的曲线都远高于图8中的随机基线。此外,图8 (a)显示,dppLSTM和DR-DSN都能够预测与人类标注正相关的重要性分数。另一方面,图8 (b)显示了远远低于黑色虚线的两条红线。这意味着这些标注员标记了几乎与总体共识相反的反应。图9中的详细观察显示,事实确实如此。异常值突出了1500和3000帧左右的片段,另一方面,其他标注员对片段的看法几乎相反。所提出的可视化提供的工具,直观地说明了这种趋势。
The most of the human annotators obtain a curve that is well above the random baseline in Figure 8. Moreover, Figure 8 (a) shows that both dppLSTM and DR-DSN are able to predict importance scores that are positively correlated with human annotations. On the other hand, Figure 8 (b) shows two red lines that are well below the black dashed line. This implies that these annotators labelled almost opposite responses to the overall consensus. Detailed observation in Figure 9 reveals that this is indeed the case. The outliers highlighted segments around 1500 and 3000 frames, on the other hand, other annotators showed almost opposite opinion for the segments. The proposed visualization provides intuitive tool for illustrating such tendencies.
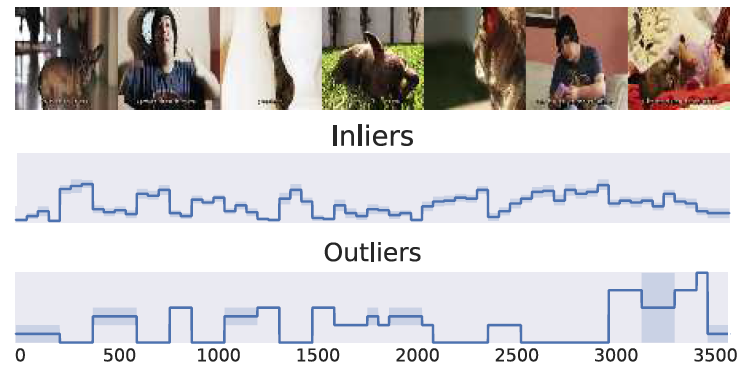
图9:比较人类标注的分数。底部一行显示了所选的两个人类标注员(异常值)的
帧级别重要性得分。中间一行显示了通过平均其他人类注释器(内部人)获得的类似分数。上面一行说明了对应视频中的关键帧。你可以注意到,内部和外部突出显示了视频中几乎完全相反的部分。
Figure 9. Comparison of human-annotated scores. The bottom row shows theframe level importance scoresfor the selected two human annotators (outliers). The middle row displays the similar score obtained by averaging over the remaining human annotators (inliers). The top row illustrates keyframes from the corresponding video. One can notice that inliers and outlier have highlighted almost completely opposite parts of the video.
6、结论 Conclusion
公共基准数据集扮演着重要的角色,因为它们促进了不同方法的简单和公平的比较。基准评估的质量具有很高的影响,因为研究工作通常趋于最大化基准结果。在本文中,我们评估了两个广泛使用的视频摘要基准的有效性。我们的分析表明,目前基于F1评分的评价框架存在严重的问题。
Public benchmark datasets play an important role as they facilitating easy and fair comparison of methods. The quality of the benchmark evaluations have high impact as the research work is often steered to maximise the benchmark results. In this paper, we have assessed the validity of two widely used video summarization benchmarks. Our analysis reveals that the current F1 score based evaluation framework has severe problems.
结果表明,在大多数情况下,随机生成的摘要能够获得与最先进的方法相似甚至更好的性能分数。完全随机方法的性能有时会超过人工标注员。进一步分析发现,得分的形成主要是由视频分割决定的,特别是分段长度的分布。这主要是由于子集选择程序的广泛使用。在大多数情况下,重要分数的贡献被基准测试完全忽略了。 基于我们的观察,我们提出使用预测的重要性分数和人类标注的重要性分数之间的相关性来评估不同方法,而不使用由分割片段子集选择过程给出的最终摘要。引入的评估方法为摘要方法的行为,提供了更多的见解和思路。我们还提出了通过累计分数曲线,从而将相关性可视化的方法,该方法直观地说明了各种人工标注的重要性分数的质量。
In most cases it turned out that randomly generated summaries were able to reach similar or even better performance scores than the state-of-the-art methods. Sometimes the performance of completely random method surpassed that of human annotators. Closer analysis revealed that score formation was mainly dictated by the video segmentation and particularly the distribution of the segment lengths. This was mainly due to the widely used subset selection procedure. In most cases, the contribution of the importance scores were completely ignored by the benchmark tests. Based on our observations, we proposed to evaluate the methods using the correlation between predicted and human-annotated importance scores instead of the final summary given by the segment subset selection process. The introduced evaluation offers additional insights about the behaviour of the summarization methods. We also proposed to visualize the correlations by accumulative score curve, which intuitively illustrates the quality of the importance scores with respect to various human annotations.
我们提处的新评估框架,只包括如何估计帧级重要性分数的方法。它不适用于其他的方法,例如,基于聚类的方法,该方法会挑选出靠近聚类中心的视频片段。此外,我们主要讨论了基于其与人工标注的相关性的评估。视频中故事的可理解性、视觉美感和与用户查询的相关性等其他因素也对各种应用程序有价值。 我们认为,在今后的工作中处理这些方面是很重要的。此外,我们认为需要新的更大的数据集,来推动视频摘要研究的发展。
The proposed new evaluation framework covers only methods that estimate the frame level importance scores. It is not suitable for other approaches such as e.g., clusteringbased methods that pick out video segments close to cluster centres. In addition, we primarily addressed the evaluation based on correlation with human annotations. Other factors like comprehensibility of a story in a video, visual aesthetics and relevance to a user query would also be valuable for various applications. We believe that it would be important to address these aspects in future works. Moreover, we believe that new substantially larger datasets are needed for pushing video summarization research forward.
鸣谢 Acknowledgement
本工作得到了JSPS KAKENHI批准号16K16086和18H03264的部分支持。
This work was partly supported by JSPS KAKENHI Grant Nos. 16K16086 and 18H03264.
引用 References
- [1] B. Gong, W.-L. Chao, K. Grauman, and F. Sha. Diverse sequential subset selection for supervised video summarization. In Advances in Neural Information Processing Systems (NIPS), pages 2069–2077, 2014.
- [2] M. Gygli, H. Grabner, H. Riemenschneider, and L. van Gool. Creating summaries from user videos. In European Conference on Computer Vision (ECCV), pages 505–520, 2014.
- [3] M. Gygli, H. Grabner, and L. Van Gool. Video summarization by learning submodular mixtures of objectives. In IEEE Conference on Computer Vision and Pattern Recognition (CVPR), pages 3090–3098, 2015.
- [4] M. G. Kendall. The treatment of ties in ranking problems. Biometrika, 33(3):239–251, 1945.
- [5] A. Khosla, R. Hamid, C.-J. Lin, and N. Sundaresan. Largescale video summarization using web-image priors. In IEEE Conference on Computer Vision and Pattern Recognition (CVPR), pages 2698–2705, 2013.
- [6] S. Kokoska and D. Zwillinger. CRC standard probability and statistics tables and formulae. Crc Press, 1999.
- [7] A. Kulesza and B. Taskar. Determinantal point processes for machine learning. Foundations and Trends in Machine Learning, 5(2–3), 2012.
- [8] R. Lagani`ere, R. Bacco, A. Hocevar, P. Lambert, G. Pa¨ıs, and B. E. Ionescu. Video summarization from spatio-temporal features. In ACM TRECVid Video Summarization Workshop,
pages 144–148, 2008. - [9] Y. J. Lee, J. Ghosh, and K. Grauman. Discovering important people and objects for egocentric video summarization. In IEEE Conference on Computer Vision and Pattern Recognition (CVPR), pages 1346–1353, 2012.
- [10] Z. Lu and K. Grauman. Story-driven summarization for egocentric video. In IEEE Conference on Computer Vision and Pattern Recognition (CVPR), pages 2714–2721, 2013.
- [11] Y. Ma, L. Lu, H. Zhang, and M. Li. A user attention model for video summarization. In ACM International Conference on Multimedia (MM), pages 533–542, 2002.
- [12] M. Otani, Y. Nakashima, E. Rahtu, J. Heikkil¨a, and N. Yokoya. Video summarization using deep semantic features. In Asian Conference on Computer Vision (ACCV), volume
10115, pages 361–377, 2016. - [13] B. Plummer, M. Brown, and S. Lazebnik. Enhancing video summarization via vision-language embedding. In IEEE Conference on Computer Vision and Pattern Recognition (CVPR), pages 5781–5789, 2017.
- [14] D. Potapov, M. Douze, Z. Harchaoui, and C. Schmid. Category-specific video summarization. In European Conference on Computer Vision (ECCV), pages 540–555, 2014.
- [15] J. Sang and C. Xu. Character-based movie summarization. In ACM International Conference on Multimedia (MM), pages 855–858, 2010.
- [16] A. Sharghi, B. Gong, and M. Shah. Query-focused extractive video summarization. In European Conference on Computer Vision (ECCV), pages 3–19, 2016.
- [17] Y. Song. Real-time video highlights for yahoo esports. In Neural Information Processing Systems (NIPS) Workshops,5 pages, 2016.
- [18] Y. Song, J. Vallmitjana, A. Stent, and A. Jaimes. TVSum: Summarizing web videos using titles. In IEEE Conference on Computer Vision and Pattern Recognition (CVPR), pages 5179–5187, 2015.
- [19] C. M. Taskiran, Z. Pizlo, A. Amir, D. Ponceleon, and E. E. J. Delp. Automated video program summarization using speech transcripts. IEEE Transactions on Multimedia, 8(4):775–790, 2006.
- [20] A. B. Vasudevan, M. Gygli, A. Volokitin, and L. Van Gool. Query-adaptive video summarization via quality-aware relevance estimation. In ACM International Conference on Multimedia (MM), pages 582–590, 2017.
- [21] H. Wei, B. Ni, Y. Yan, H. Yu, X. Yang, and C. Yao. Video Summarization via Semantic Attended Networks. In AAAI Conference on Artificial Intelligence, pages 216–223, 2018.
- [22] T. Yao, T. Mei, and Y. Rui. Highlight detection with pairwise deep ranking for first-person video summarization. In IEEE Conference on Computer Vision and Pattern Recognition (CVPR), 2016.
- [23] T. Yao, T. Mei, and Y. Rui. Highlight detection with pairwise deep ranking for first-person video summarization. In IEEE Computer Society Conference on Computer Vision and Pattern Recognition (CVPR), 2016.
- [24] S. Yeung, A. Fathi, and L. Fei-fei. VideoSET : Video summary evaluation through text. arXiv preprint arXiv:1406.5824v1, 2014.
- [25] K. Zhang, W.-L. Chao, F. Sha, and K. Grauman. Summary transfer: Exemplar-based subset selection for video summarization.In IEEE Conference on Computer Vision and Pattern Recognition (CVPR), pages 1059–1067, 2016.
- [26] K. Zhang, W.-L. Chao, F. Sha, and K. Grauman. Video summarization with long short-term memory. In European Conference on Computer Vision (ECCV), pages 766–782, may 2016.
- [27] K. Zhang, K. Grauman, and F. Sha. Retrospective Encoders for Video Summarization. In European Conference on Computer Vision (ECCV), pages 383–399, 2018.
- [28] B. Zhao and E. P. Xing. Quasi real-time summarization for consumer videos. In IEEE Conference on Computer Vision and Pattern Recognition (CVPR), pages 2513–2520, 2014.
- [29] K. Zhou, Y. Qiao, and T. Xiang. Deep reinforcement learning for unsupervised video summarization with diversityrepresentativeness reward. 2018.


【推荐】国内首个AI IDE,深度理解中文开发场景,立即下载体验Trae
【推荐】编程新体验,更懂你的AI,立即体验豆包MarsCode编程助手
【推荐】抖音旗下AI助手豆包,你的智能百科全书,全免费不限次数
【推荐】轻量又高性能的 SSH 工具 IShell:AI 加持,快人一步
· 地球OL攻略 —— 某应届生求职总结
· 周边上新:园子的第一款马克杯温暖上架
· Open-Sora 2.0 重磅开源!
· 提示词工程——AI应用必不可少的技术
· .NET周刊【3月第1期 2025-03-02】