rugarch包与R语言中的garch族模型
来源:http://www.dataguru.cn/article-794-1.html
rugarch包是R中用来拟合和检验garch模型的一个包。该包最早在http://rgarch.r-forge.r-project.org上发布,现已发布到CRAN上。简单而言,该包主要包括四个功能:
- 拟合garch族模型
- garch族模型诊断
- garch族模型预测
- 模拟garch序列
- 拟合序列分布
下面分别说一下。
一、拟合garch族模型
拟合garch族模型分三个步骤:
(1)通过ugarchspec函数设定模型形式
(2)通过ugarchfit函数拟合模型
设定模型形式
一个典型的garch(p,q)模型如下:


该模型由三个部分构成,均值方程对应式(1),分布假设对应(2),方差方程对应式(3),对三个部分进行适当的变形后可以形成egarch模型,egarch-ged模型,egarch-t模型,Igarch模型,garch-m模型和Qgarch模型等。因此,设定模型形式就是分别设定均值方程、方差方程和分布。
rugarch包的优越之处正在于这里。ugarchspec函数的参数也被分解为为三个主要部分,分别是variance.model,对应式(3),mean.model,对应式(1),distribution.model对应式(2)中的$\epsilon$。用户通过对三个部分的参数的分别设定从而构造出自己想用的模型。
举个例子:
variance.model = list(model = "sGARCH", garchOrder = c(1, 1),submodel = NULL, external.regressors = NULL, variance.targeting = FALSE),
表示拟合的方差模型为sGARCH,方差模型的自回归阶数是(1,1),方差模型中未引入外生变量。
mean.model = list(armaOrder = c(1, 1), include.mean = TRUE, archm = FALSE, archpow = 1, arfima = FALSE, external.regressors = NULL, archex = FALSE)
表示均值方程为arma(1,1)模型,方程自变量中包含均值,未引入外生变量。
distribution.model = "norm"
表示模型分布假设为正态分布。
将三个部分装入ugarchspec的参数中就可以完成一个sgarch(1,1)-norm模型的模型设定。
myspec=ugarchspec(
variance.model = list(model = "sGARCH", garchOrder = c(1, 1), submodel = NULL, external.regressors = NULL, variance.targeting = FALSE),
mean.model = list(armaOrder = c(1, 1), include.mean = TRUE, archm = FALSE, archpow = 1, arfima = FALSE, external.regressors = NULL, archex = FALSE),
distribution.model = "norm"
)
拟合模型
拟合模型的函数是ugarchfit。ugarchfit的参数如下:
ugarchfit(spec, data, out.sample = 0, solver = "solnp", solver.control = list(),fit.control = list(stationarity = 1, fixed.se = 0, scale = 0), ...)
其中,spec为ugarchspec函数的结果,data为数据对象。solver为优化算法。solver.control设定优化参数,fit.control设定拟合参数。
接上面的例子:
myfit=ugarchfit(myspec,data=sp500ret,solver="solnp")
到这里一个garch模型就完成了。
查看结果
键入下列代码查看模型的拟合结果:
提取模型结果
rugarch包中模型结果的提取要依靠as.data.frame函数。比如提取模型的拟合值
as.data.frame(myfit,which="fitted")
提取残差序列:
as.data.frame(myfit,which=" residuals")
提取方差序列:
as.data.frame(myfit,which="sigma")
当然,也可以同时查看所有:
as.data.frame(myfit,which=all)
或者
as.data.frame(myfit)
两个语句等价。
二、模型诊断
通过plot(myfit)可以对模型结果进行图形诊断:
> plot(myfit)
Make a plot selection (or 0 to exit):
1:   Series with 2 Conditional SD Superimposed
2:   Series with 2.5% VaR Limits (with unconditional mean)
3:   Conditional SD
4:   ACF of Observations
5:   ACF of Squared Observations
6:   ACF of Absolute Observations
7:   Cross Correlation
8:   Empirical Density of Standardized Residuals
9:   QQ-Plot of Standardized Residuals10:   ACF of Standardized Residuals11:   ACF of Squared Standardized Residuals12:   News-Impact CurveSelection: 1
三、模型预测
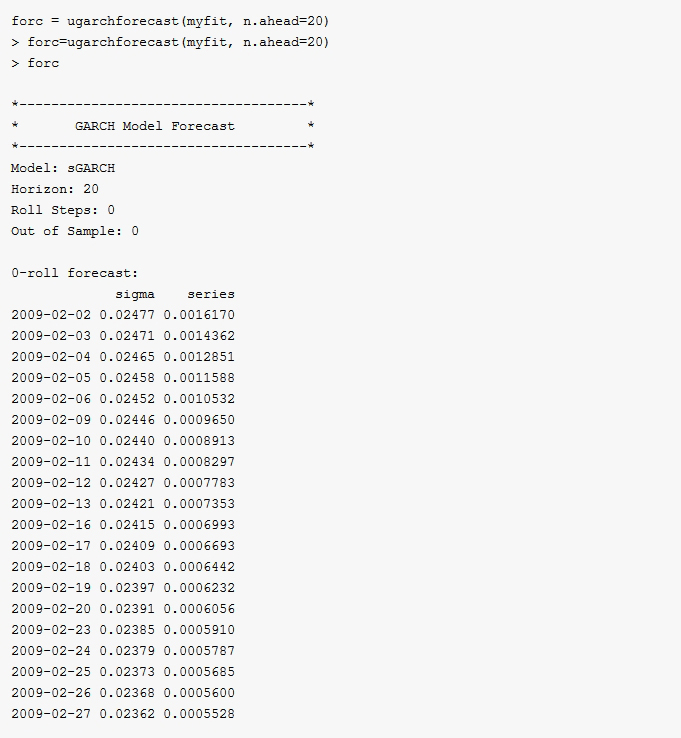
如果模型通过检验,可以用ugarchforcast函数对未来进行预测:
可以用fpm或者plot来查看模型的预测结果。比如:
> plot(fore)
Make a plot selection (or 0 to exit):
1:   Time Series Prediction (unconditional)
2:   Time Series Prediction (rolling)
3:   Conditional SD PredictionSelection: 1


 浙公网安备 33010602011771号