8.图像变换技术
经过图像变换后,一方面能够更有效地反映图像自身的特征,另一方面也可使能量集中在少量数据上,更有利于图像的存储、传输和处理。
从检测器获取投影数据的过程,就是图像中的Radon变换。
8.1.1 Radon正变换

 1 %对图像进行0°和45°方向上的Radon变换
 2 clear all; close all;
 3 I=zeros(200, 200); %建立图像
 4 I(50:150, 50:150)=1;
 5 [R, xp]=radon(I, [0, 45]); %Radon变换
 6 figure;
 7 subplot(131);imshow(I);
 8 subplot(132);plot(xp, R(:, 1)); %0° Radon变换结果
 9 subplot(133);plot(xp, R(:, 2)); %45° Radon变换结果
10
11 %对图像从0°到180°每隔10°做Radon变换
12 clear all; close all;
13 I=zeros(200, 200);
14 I(50:150, 50:150)=1;
15 theta=0:10:180; %角度值
16 [R, xp]=radon(I, theta); %Radon变换
17 figure;
18 subplot(121);imshow(I);
19 subplot(122);imagesc(theta, xp, R); %绘制各个角度变换结果
20 colormap(hot); %设置调色板
21 colorbar; %添加颜色条
22
23 %Radon变换检测直线
24 clear all; close all;
25 I=fitsread('solarspectra.fts');
26 J=mat2gray(I); %转换为灰度图像
27 BW=edge(J); %获取边缘
28 figure;subplot(121);imshow(J);
29 subplot(122);imshow(BW);
30 theta=0:179; %角度
31 [R, xp]=radon(BW, theta); %Radon变换
32 figure;imagesc(theta, xp, R); %绘制各个角度变换结果
33 colormap(hot); %设置调色板
34 colorbar; %添加颜色条
35 Rmax=max(max(R)) %获取最大值
36 [row, column]=find(R>=Rmax) %获取行和列值
37 x=xp(row) %获取位置
38 angel=theta(column) %获取角度
 1 %Radon反变换恢复图像
 2 clear all; close all;
 3 I=imread('circuit.tif');
 4 theta=0:2:179;
 5 [R, xp]=radon(I, theta); %Radon变换
 6 J=iradon(R, theta); %Radon反变换
 7 figure;
 8 subplot(131);imshow(uint8(I));
 9 subplot(132);imagesc(theta, xp, R);
10 axis normal;
11 subplot(133);imshow(uint8(J));
iradon()函数利用R矩阵各列的投影来构造图像I的近似值。投影数越多,重建后的图像越接近原始的图像。为了获取准确的图像,尽量使用较多的投影值。
 1 %投影角度的多少对Radon变换和Radon反变换的影响
 2 clear all; close all;
 3 I=phantom(256); %读入图像
 4 figure;
 5 imshow(I);
 6 theta1=0:10:170;
 7 theta2=0:5:175;
 8 theta3=0:2:178;
 9 [R1, xp]=radon(I, theta1);
10 [R2, xp]=radon(I, theta2);
11 [R3, xp]=radon(I, theta3);
12 figure;
13 imagesc(theta3, xp, R3);
14 colormap hot;
15 colorbar;
16 J1=iradon(R1, 10);
17 J2=iradon(R2, 5);
18 J3=iradon(R3, 2);
19 figure;
20 subplot(131);imshow(J1);
21 subplot(132);imshow(J2);
22 subplot(133);imshow(J3);
8.2 图像傅里叶变换
数学意义:将一个图像转换为一系列周期函数来处理
物理意义:傅里叶变换将图像从空间域转换到频率域,逆变换将图像从频率域转换到空间域
实际上对图像进行二维傅里叶变换得到频谱图,就是图像梯度的分布图。频谱图上看到的明暗不一的亮点,对应图像上某一点与邻域点差异的强弱,即梯度大小。如果频谱图中暗点数多,实际图像比较柔和,反之,如果频谱图中亮点多,那么实际图像一定是尖锐的,边界分明且边界两边像素差异较大。
8.2.1 傅里叶变换的定义与性质
一维连续傅里叶变换:

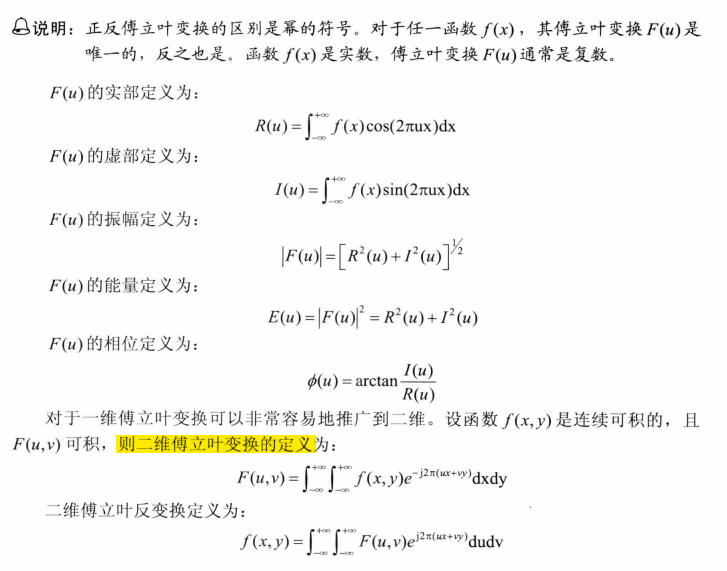
离散傅里叶变换:
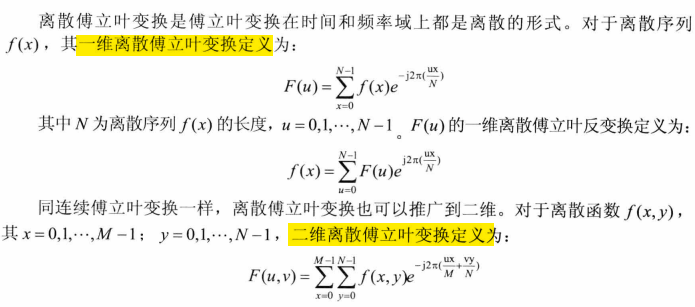
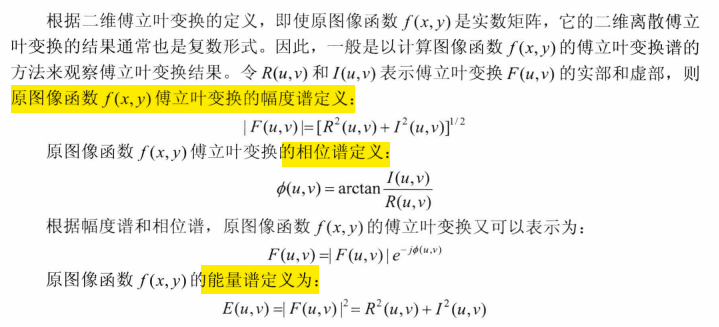
二维离散傅里叶变换的性质
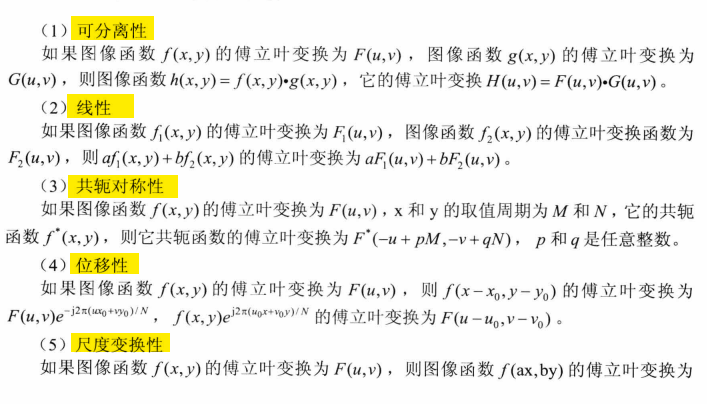
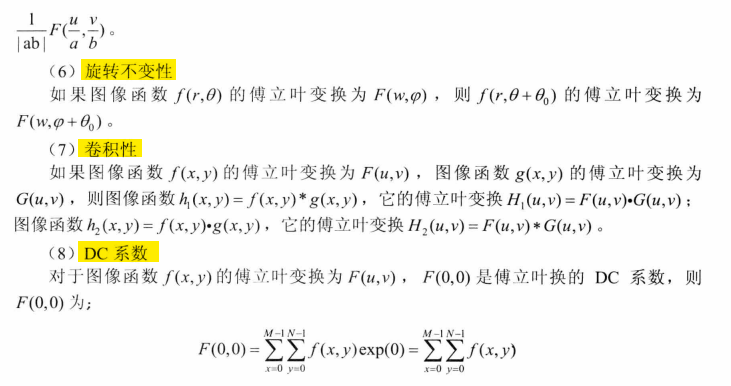
 1 %矩阵的二维离散傅里叶变换
 2 clear all; close all;
 3 I1=ones(4) %建立矩阵
 4 I2=[2 2 2 2;1 1 1 1; 3 3 0 0; 0 0 0 0]
 5 J1=fft2(I1) %傅里叶变换
 6 J2=fft2(I2)
 7
 8 %图像的二维离散傅里叶变换
 9 clear all; close all;
10 I=imread('cameraman.tif'); %读入图像
11 J=fft2(I); %傅里叶变换
12 K=abs(J/256);
13 figure;
14 subplot(121);imshow(I);
15 subplot(122);imshow(uint8(K));

 1 %通过函数ffthsift()进行平移
 2 clear all; close all;
 3 N=0:4
 4 X=fftshift(N) %平移
 5 Y=fftshift(fftshift(N)) %再平移
 6 Z=ifftshift(fftshift(N)) %反平移
 7
 8 %图像进行傅里叶变换和平移
 9 %图像的能量主要集中在低频
10 clear all; close all;
11 I=imread('peppers.png');
12 J=rgb2gray(I);
13 K=fft2(J); %傅里叶变换
14 K=fftshift(K); %平移
15 L=abs(K/256);
16 figure;
17 subplot(121);imshow(J);
18 subplot(122);imshow(uint8(L));
19
20 %图像变亮后进行傅里叶变换
21 %中央低频部分变大了,频谱图的中央低频部分代表了灰度图像的平均亮度
22 clear all; close all;
23 I=imread('peppers.png');
24 J=rgb2gray(I);
25 J=J*exp(1); %变亮
26 J(find(J>255))=255;
27 K=fft2(J);
28 K=fftshift(K);
29 L=abs(K/256);
30 figure;
31 subplot(121);imshow(J);
32 subplot(122);imshow(uint8(L));
33
34 %图像旋转后进行傅里叶变换
35 clear all; close all;
36 I=imread('peppers.png');
37 J=rgb2gray(I);
38 J=imrotate(J,45,'bilinear'); %图像旋转
39 K=fft2(J); %傅里叶变换
40 K=fftshift(K); %旋转
41 L=abs(K/256);
42 figure;
43 subplot(121);imshow(J);
44 subplot(122);imshow(uint8(L));
45
46 %图像中添加高斯噪声后进行傅里叶变换
47 clear all; close all;
48 I=imread('peppers.png');
49 J=rgb2gray(I);
50 J=imnoise(J, 'gaussian', 0, 0.01);
51 K=fft2(J);
52 K=fftshift(K);
53 L=abs(K/256);
54 figure;
55 subplot(121);imshow(J);
56 subplot(122);imshow(uint8(L));

 1 %灰度图像的傅里叶变换和反变换
 2 clear all; close all;
 3 I=imread('onion.png');
 4 J=rgb2gray(I);
 5 K=fft2(J); %傅里叶变换
 6 L=fftshift(K); %平移
 7 M=ifft2(K); %傅里叶反变换
 8 figure;
 9 subplot(121);imshow(uint8(abs(L)/198)); %显示频谱图
10 subplot(122);imshow(uint8(M)); %显示反变换得到的图像
11
12 %灰度图像的复制谱和相位谱
13 clear all; close all;
14 I=imread('peppers.png');
15 J=rgb2gray(I);
16 K=fft2(J);
17 L=fftshift(K);
18 fftr=real(L);
19 ffti=imag(L);
20 A=sqrt(fftr.^2+ffti.^2); %幅度谱
21 A=(A-min(min(A)))/(max(max(A))-min(min(A)))*255; %归一化到0-255
22 B=angle(K); %相位谱
23 figure;
24 subplot(121);imshow(A); %显示幅度谱
25 subplot(122);imshow(real(B)); %显示相位谱
26
27 %编程实现二维离散傅里叶变换
28 clear all; close all;
29 I=imread('onion.png');
30 J=rgb2gray(I);
31 J=double(J);
32 s=size(J);
33 M=s(1); N=s(2); %获取图像的行数和列数
34 for u=0:M-1
35     for v=0:N-1
36         k=0;
37         for x=0:M-1
38             for y=0:N-1
39                 k=J(x+1, y+1)*exp(-j*2*pi*(u*x/M+v*y/N))+k; %二维离散傅里叶变换公式
40             end
41         end
42         F(u+1, v+1)=k; %傅里叶变换结果
43     end
44 end
45 K=fft2(J); %采用了快速傅里叶变换算法,运算速度较快
46 figure;
47 subplot(121);imshow(K);%显示结果
48 subplot(122);imshow(F);
 1 %傅里叶变换识别图像中的字符
 2 clear all; close all;
 3 I=imread('text.png'); %读入图像
 4 a=I(32:45, 88:98); %模板
 5 figure;imshow(I); %显示原图像
 6 figure;imshow(a); %显示模板
 7 c=real(ifft2(fft2(I).*fft2(rot90(a, 2), 256, 256))); %傅里叶变换
 8 figure;imshow(c, []); 显示卷积后的结果
 9 max(c(:)) %取最大值
10 thresh=60; %设置阈值
11 figure;imshow(c>thresh) %显示识别结果
巴特沃斯滤波器
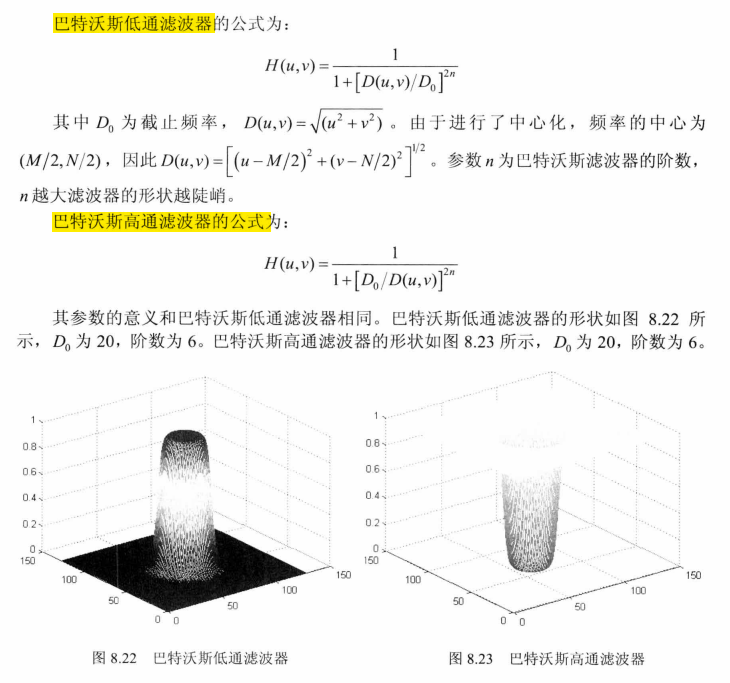
 1 %对图像进行巴特沃斯低通滤波
 2 clear all; close all;
 3 I=imread('cameraman.tif');
 4 I=im2double(I);
 5 J=fftshift(fft2(I)); %傅里叶变换与平移
 6 [x, y]=meshgrid(-128:127, -128:127); %产生离散数据
 7 z=sqrt(x.^2+y.^2);
 8 D1=10;  D2=30; %滤波器的截至频率
 9 n=6; %滤波器的阶数
10 H1=1./(1+(z/D1).^(2*n)); %滤波器
11 H2=1./(1+(z/D2).^(2*n)); %滤波器
12 K1=J.*H1; %滤波
13 K2=J.*H2; %滤波
14 L1=ifft2(ifftshift(K1)); %傅里叶反变换
15 L2=ifft2(ifftshift(K2)); %傅里叶反变换
16 figure;
17 subplot(131);imshow(I); %原图像
18 subplot(132);imshow(real(L1)); %结果图像
19 subplot(133);imshow(real(L2)); %截止频率月底,图像变得越模糊
20
21 %对图像进行巴特沃斯高通滤波
22 clear all; close all;
23 I=imread('cameraman.tif');
24 I=im2double(I);
25 J=fftshift(fft2(I));
26 [x, y]=meshgrid(-128:127, -128:127);
27 z=sqrt(x.^2+y.^2);
28 D1=10;  D2=40; %截止频率
29 n1=4;  n2=8; %滤波器阶数
30 H1=1./(1+(D1./z).^(2*n1));
31 H2=1./(1+(D2./z).^(2*n2));
32 K1=J.*H1; %滤波
33 K2=J.*H2;
34 L1=ifft2(ifftshift(K1)); %傅里叶反变换
35 L2=ifft2(ifftshift(K2));
36 figure;
37 subplot(131);imshow(I);
38 subplot(132);imshow(real(L1));
39 subplot(133);imshow(real(L2)); %高通滤波保持了图像的边缘信息
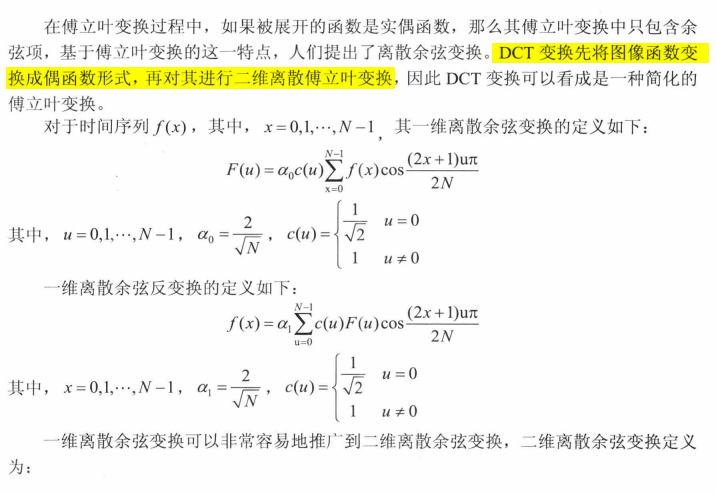
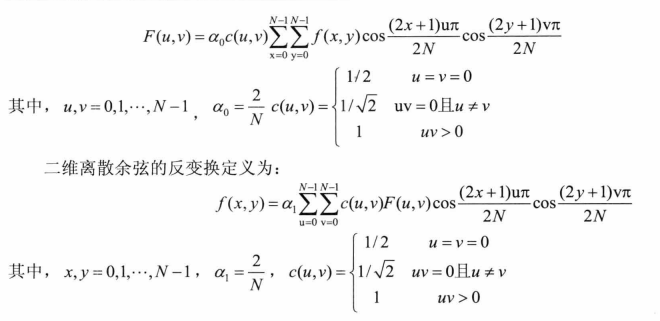
1 %对图像进行二维离散余弦变换
2 clear all; close all;
3 I=imread('coins.png');
4 I=im2double(I);
5 J=dct2(I); %二维离散余弦变换
6 figure;
7 subplot(121);imshow(I);
8 subplot(122);imshow(log(abs(J)), []); %显示变换系数,系数中的能量主要集中在左上角,其余大部分系数接近0

 1 %dctmtx()生成离散余弦变换矩阵
 2 clear all; close all;
 3 A=[1 1 1 1; 2 2 2 2; 3 3 3 3] %建立矩阵
 4 s=size(A);
 5 M=s(1); %矩阵的行数
 6 N=s(2); %矩阵的列数
 7 P=dctmtx(M) %离散余弦变换矩阵
 8 Q=dctmtx(N) %离散余弦变换矩阵
 9 B=P*A*Q' %离散余弦变换
10
11 %利用dctmtx()进行图像的离散余弦变换
12 clear all; close all;
13 I=imread('cameraman.tif');
14 I=im2double(I);
15 s=size(I);
16 M=s(1);
17 N=s(2);
18 P=dctmtx(M);
19 Q=dctmtx(N);
20 J=P*I*Q'; %离散余弦变换
21 K=dct2(I); %离散余弦变换
22 E=J-K; %变换系数之差
23 find(abs(E)>0.000001) %查找系数差大于0.000001
24 figure;
25 subplot(121);imshow(J); %显示离散余弦系数
26 subplot(122);imshow(K); %显示离散余弦系数

 1 %图像的二维离散余弦反变换
 2 clear all; close all;
 3 I=imread('cameraman.tif');
 4 I=im2double(I);
 5 J=dct2(I); %二维离散余弦变换
 6 J(abs(J)<0.1)=0; %绝对值小于0.1的系数设置为0
 7 K=idct2(J); %二维离散余弦反变换
 8 figure;
 9 subplot(131);imshow(I); %显示原图像
10 subplot(132);imshow(J); %变换系数
11 subplot(133);imshow(K); %显示结果图像
 1 %通过函数blkproc()对图像进行块操作
 2 clear all; close all;
 3 I=imread('cameraman.tif');
 4 fun1=@dct2; %函数句柄
 5 J1=blkproc(I, [8 8], fun1); %块操作
 6 fun2=@(x) std2(x)*ones(size(x)); %函数句柄
 7 J2=blkproc(I, [8 8], fun2); %块操作
 8 figure;
 9 subplot(121);imagesc(J1);
10 subplot(122);imagesc(J2);
11 colormap gray; %设置调色板


 1 %通过离散余弦变换进行图像压缩
 2 clear all; close all;
 3 I=imread('rice.png'); %读入图像
 4 J=im2double(I);
 5 T=dctmtx(8); %计算离散余弦变换矩阵
 6 K=blkproc(J, [8 8], 'P1*x*P2', T, T');  %对每个小方块进行离散余弦变换
 7 mask=[ 1  1  1  1  0  0  0  0
 8             1  1  1  0  0  0  0  0
 9             1  1  0  0  0  0  0  0
10             1  0  0  0  0  0  0  0
11             0  0  0  0  0  0  0  0
12             0  0  0  0  0  0  0  0
13             0  0  0  0  0  0  0  0
14             0  0  0  0  0  0  0  0 ];
15 K2=blkproc(K, [8 8], 'P1.*x', mask); %系数选择
16 L=blkproc(K2, [8 8], 'P1*x*P2', T', T); %对每个小方块进行离散余弦反变换
17 figure;
18 subplot(121);imshow(J);
19 subplot(122);imshow(L);
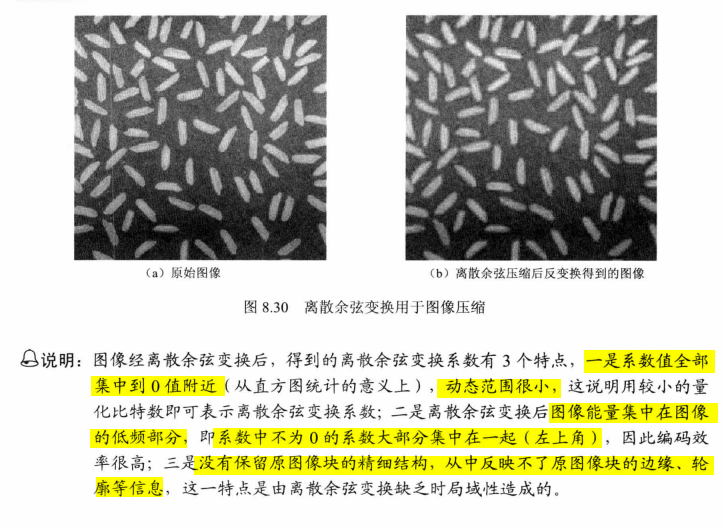
8.4 其他图像变换
8.4.1 Hadamard变换
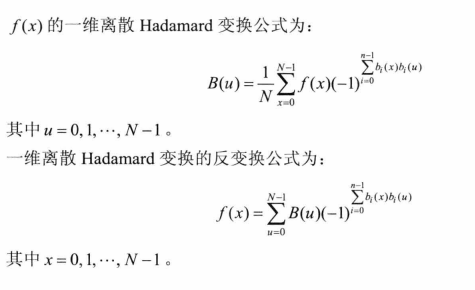
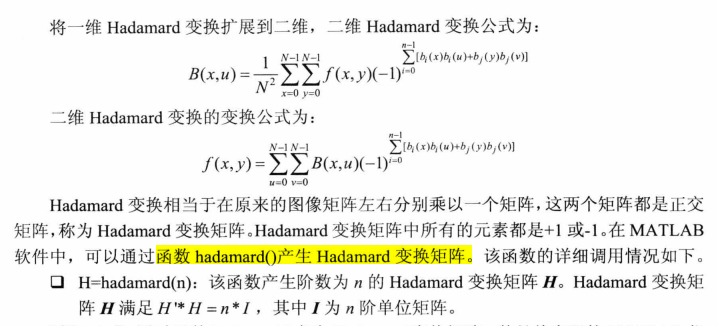
 1 %通过函数hadamard()产生Hadamard变换矩阵
 2 clear all; close all;
 3 H1=hadamard(2) %产生2阶Hadamard变换矩阵
 4 H2=hadamard(4) %产生4阶Hadamard变换矩阵
 5 H3=H2'*H2
 6
 7 %对图像进行Hadamard变换
 8 clear all; close all;
 9 I=imread('peppers.png'); %读入rgb图像
10 I=rgb2gray(I); %转换为灰度图像
11 I=im2double(I);
12 h1=size(I, 1); %行
13 h2=size(I, 2); %列
14 H1=hadamard(h1); %Hadamard变换矩阵
15 H2=hadamard(h2); %Hadamard变换矩阵
16 J=H1*I*H2/sqrt(h1*h2); %Hadamard变换
17 figure;
18 set(0,'defaultFigurePosition',[100,100,1000,500]);
19 set(0,'defaultFigureColor',[1 1 1])
20 subplot(121);imshow(I); %原图像
21 subplot(122);imshow(J); %Hadamard变换结果
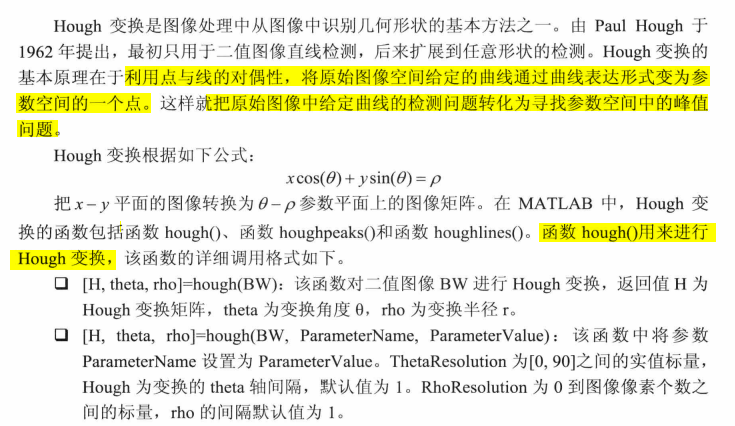
 1 %对图像进行Hough变换
 2 clear all; close all;
 3 I=imread('circuit.tif');
 4 I=im2double(I);
 5 BW=edge(I, 'canny'); %边缘检测
 6 [H, Theta, Rho]=hough(BW, 'RhoResolution', 0.5, 'ThetaResolution', 0.5); %Hough变换
 7 figure;
 8 set(0,'defaultFigurePosition',[100,100,1000,500]);
 9 set(0,'defaultFigureColor',[1 1 1])
10 subplot(121);imshow(BW);
11 subplot(122);imshow(imadjust(mat2gray(H)));
12 axis normal; %设置坐标轴
13 hold on;
14 colormap hot; %设置调色板

 1 %通过图像的Hough变换检测直线
 2 clear all; close all;
 3 I=imread('gantrycrane.png');
 4 I=rgb2gray(I);
 5 BW=edge(I, 'canny'); %获取图像边缘
 6 [H, Theta, Rho]=hough(BW, 'RhoResolution', 0.5, 'Theta', -90:0.5:89.5);%Hough变换
 7 P=houghpeaks(H, 5, 'threshold', ceil(0.3*max(H(:)))); %获取5个最值点
 8 x=Theta(P(:, 2)); %横坐标
 9 y=Rho(P(:, 1)); %纵坐标
10 figure;
11 set(0,'defaultFigurePosition',[100,100,1000,500]);
12 set(0,'defaultFigureColor',[1 1 1])
13 subplot(121);
14 imshow(imadjust(mat2gray(H)), 'XData', Theta, 'YData', Rho,...
15     'InitialMagnification', 'fit'); %绘制Hough变换结果
16 axis on;  %设置坐标轴
17 axis normal;
18 hold on;
19 plot(x, y, 's', 'color', 'white');
20 lines=houghlines(BW, Theta, Rho, P, 'FillGap', 5, 'MinLength', 7); %检测直线
21 subplot(122);imshow(I);
22 hold on;
23 maxlen=0;
24 for k=1:length(lines) %绘制多条直线
25     xy=[lines(k).point1; lines(k).point2];
26     plot(xy(:,1), xy(:, 2), 'linewidth', 2, 'color', 'green');
27     plot(xy(1,1), xy(1, 2), 'linewidth', 2,  'color', 'yellow');
28     plot(xy(2,1), xy(2, 2), 'linewidth', 2,  'color', 'red');
29     len=norm(lines(k).point1-lines(k).point2);
30     if (len>maxlen) %获取最长直线坐标
31         maxlen=len;
32         xylong=xy;
33     end
34 end
35 hold on;
36 plot(xylong(:, 1), xylong(:, 2), 'color', 'blue'); %绘制最长的直线


