7. 图像分割技术
7.1 边缘分割技术
7.1.1图像中的线段
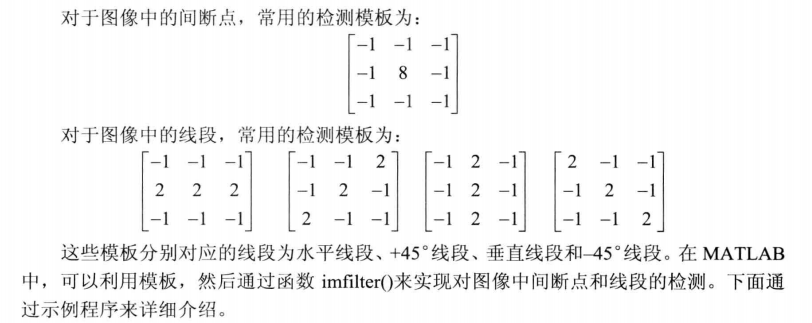
 1 %检测图像中的线段
 2 clear all; close all;
 3 I=imread('gantrycrane.png');
 4 I=rgb2gray(I); %转换为灰度图像
 5 h1=[-1, -1. -1; 2, 2, 2; -1, -1, -1]; %模板
 6 h2=[-1, -1, 2; -1, 2, -1; 2, -1, -1];
 7 h3=[-1, 2, -1; -1, 2, -1; -1, 2, -1];
 8 h4=[2, -1, -1; -1, 2, -1; -1, -1, 2];
 9 J1=imfilter(I, h1); %线段检测
10 J2=imfilter(I, h2);
11 J3=imfilter(I, h3);
12 J4=imfilter(I, h4);
13 J=J1+J2+J3+J4; %四条线段叠加
14 figure;
15 subplot(121);  imshow(I);
16 subplot(122);  imshow(J);
7.1.2微分算子
Roberts算子
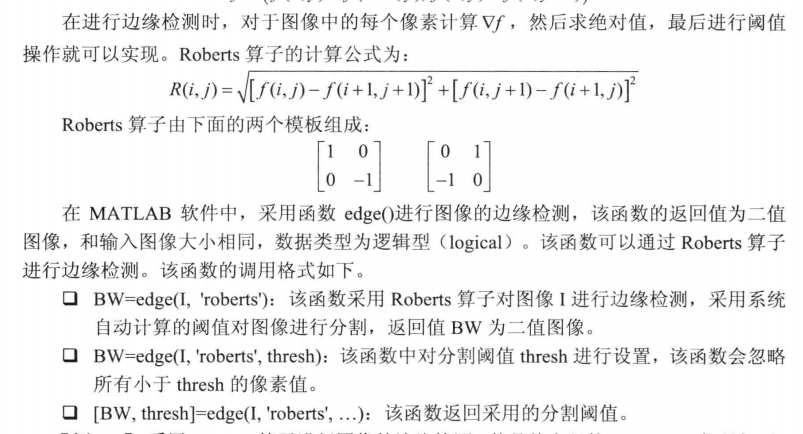
Prewit算子
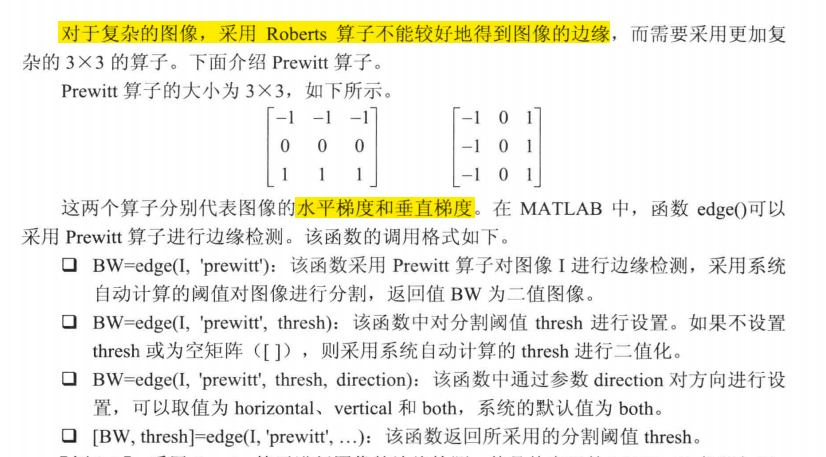
Soble算子
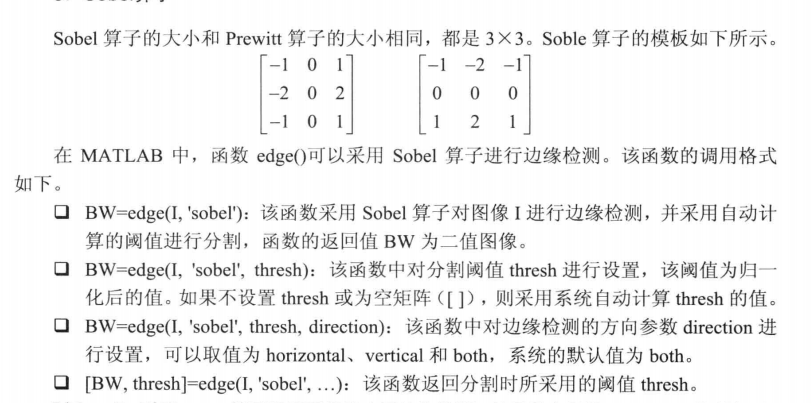
 1 %----------Roberts算子----------
 2 clear all; close all;
 3 I=imread('rice.png');
 4 I=im2double(I);
 5 [J, thresh]=edge(I, 'roberts', 35/255); %边缘检测
 6 figure;
 7 subplot(121);  imshow(I);
 8 subplot(122);  imshow(J);
 9
10 %----------Prewit算子----------
11 clear all; close all;
12 I=imread('cameraman.tif');
13 I=im2double(I);
14 [J, thresh]=edge(I, 'prewitt', [], 'both');
15 figure;
16 subplot(121);  imshow(I);
17 subplot(122);  imshow(J);
18
19 %----------Soble算子----------
20 clear all; close all;
21 I=imread('gantrycrane.png');
22 I=rgb2gray(I);
23 I=im2double(I);
24 [J, thresh]=edge(I, 'sobel', [], 'horizontal');
25 figure;
26 subplot(121);  imshow(I);
27 subplot(122);  imshow(J);
28
29 % 采用fspecial()产生预定义的模板
30 clear all;  close all;  clc;
31 format rat;
32 hsobel=fspecial('sobel') %sobel算子
33 hprewitt=fspecial('prewitt') %prewitt算子
34 hlaplacian=fspecial('laplacian') %laplacian算子
35 hlog=fspecial('log', 3) %log算子
36 format short; %设置输出数据格式
37
38 % 采用fspecial()和imfilter()提取图像的边缘
39 clear all; close all;
40 I=imread('cameraman.tif');
41 I=im2double(I);
42 h=fspecial('laplacian');
43 J=imfilter(I, h, 'replicate');
44 K=im2bw(J, 80/255); %变成二值图像
45 figure;
46 subplot(121);  imshow(J);
47 subplot(122);  imshow(K);
7.1.3 Canny算子
Canny算子具有低误码率、高精度和抑制虚假边缘等优点
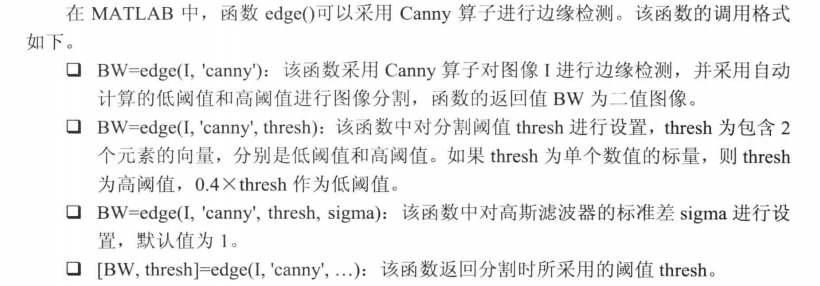
1 %采用Canny算子对含有噪声的图像进行边缘检测
2 clear all; close all;
3 I=imread('rice.png');
4 I=im2double(I);
5 J=imnoise(I, 'gaussian', 0, 0.01);
6 [K, thresh]=edge(J, 'canny'); %canny算子检测边缘
7 figure;
8 subplot(121);  imshow(J);
9 subplot(122);  imshow(K);
7.1.4 LOG算子
首先采用Gaussian函数对图像进行平黄,然后采用Laplacian算子根据二阶导数过零点来检测图像边缘,称为LOG算子
拉普拉斯算子是一种不依赖于边缘方向的二阶微分算子,是标量,具有旋转不变的性质;
对图像的噪声比较敏感;
优点:定位精度高,抗干扰能力强,连续性好
调用格式:

1 %采用log算子对含有噪声的图像进行边缘检测
2 clear all; close all;
3 I=imread('cameraman.tif');
4 I=im2double(I);
5 J=imnoise(I, 'gaussian', 0, 0.005);
6 [K, thresh]=edge(J, 'log', [], 2.3); %log算子检测边缘
7 figure;
8 subplot(121);  imshow(J);
9 subplot(122);  imshow(K);
7.2 阈值分割技术
7.2.1 全局阈值
 1 %采用全局阈值对图像进行分割
 2 I=imread('rice.png');
 3 J=I>120; %阈值为120
 4 [width, height]=size(I);
 5 for i=1:width
 6     for j=1:height
 7         if (I(i, j)>130) %阈值为130
 8             K(i, j)=1;
 9         else
10             K(i, j)=0;
11         end
12     end
13 end
14 figure;
15 subplot(121);  imshow(J);
16 subplot(122);  imshow(K);
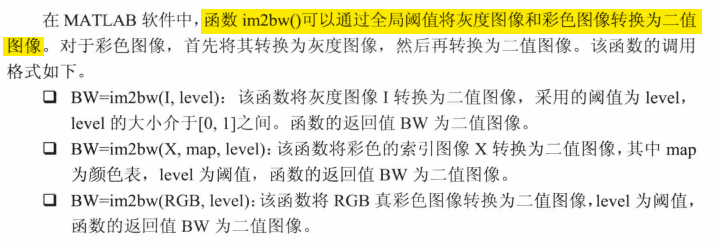
1 %采用im2bw()进行彩色图像分割
2 [X, map]=imread('trees.tif');
3 J=ind2gray(X, map); %索引图像转换为灰度图像
4 K=im2bw(X, map, 0.4); %图像分割
5 figure;
6 subplot(121);  imshow(J);
7 subplot(122);  imshow(K);
7.2.2 Otsu阈值分割
该算法是在灰度直方图的基础上采用最小二乘法原理推导出来的,具有统计意义上的最佳分割。基本原理是以最佳阈值将图像的灰度值分为两个部分,使两部分之间的方差最大,即具有最大的分离性。

1 %采用Otsu算法进行图像分割
2 I=imread('coins.png');
3 I=im2double(I);
4 T=graythresh(I); %获取阈值
5 J=im2bw(I, T); %图像分割
6 figure;
7 subplot(121);  imshow(I);
8 subplot(122);  imshow(J);
7.2.3 迭代式阈值分割
 1 %采用迭代式阈值进行图像分割
 2 I=imread('cameraman.tif');
 3 I=im2double(I);
 4 T0=0.01; %参数T0
 5 T1=(min(I(:))+max(I(:)))/2;
 6 r1=find(I>T1);
 7 r2=find(I<=T1);
 8 T2=(mean(I(r1))+mean(I(r2)))/2;
 9 while abs(T2-T1)<T0 %迭代求阈值
10     T1=T2;
11     r1=find(I>T1);
12     r2=find(I<=T1);
13     T2=(mean(I(r1))+mean(I(r2)))/2;
14 end
15 J=im2bw(I, T2); %图像分割
16 figure;
17 subplot(121);  imshow(I);
18 subplot(122);  imshow(J);
7.3 区域分割技术
7.3.1 区域生长法
一种串行区域分割的图像分割方法。区域生长的基本思想是将具有相似性质的像素集合起来构成区域。区域增长方法根据同一物体区域内像素的相似性质来聚集像素点的方法,从初始区域开始将相邻的即便有同样性质的像素或其他区域归并到目前的区域中从而逐步增长区域,直至没有可以归并的点或其他的小区域为止。区域内像素的相似度量可以包括平均灰度值、纹理和颜色等信息。
可用来分割比较复杂的图像,如自然景物。缺点是采用迭代的方法,空间和时间开销比较大,往往会照成过度分割,即将图像分割成过多的区域。
区域生长的好坏取决于第三类,第一类为初始种子的选取,第二类为生长规则,第三类为终止条件。
7.3.2 分水岭分割
借鉴了形态学理论。将一幅图像堪称是一个地形图,灰度值对应地形的高度值,高灰度值对应着山峰,低灰度值对应山谷。水总是朝着地势低的地方流动,直到某个局部低洼处,这个低洼就是盆地。最终所有的水会处于不同的盆地,盆地之间的山脊称为分水岭。

1 %采用分水岭算法分割图像
2 I=imread('circbw.tif');
3 J=watershed(I, 8); %分水岭分割
4 figure;
5 subplot(121);  imshow(I);
6 subplot(122);  imshow(J);


