
《DSP using MATLAB》Problem 2.20
代码:
%% ------------------------------------------------------------------------
%% Output Info about this m-file
fprintf('\n***********************************************************\n');
fprintf(' <DSP using MATLAB> Problem 2.20 \n\n');
banner();
%% ------------------------------------------------------------------------
b = [1, -1]; a = [1];
%% -------------------------------------------------
%% 3 input sequence
%% -------------------------------------------------
n1 = [0:30];
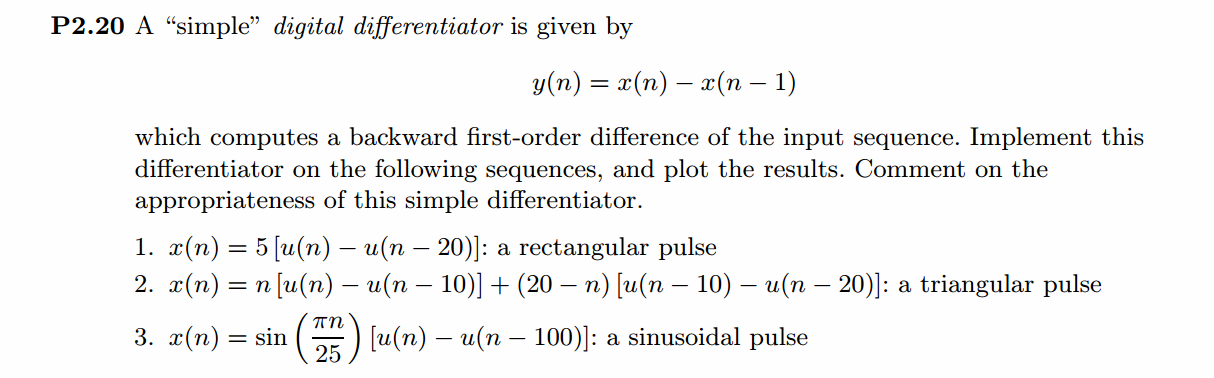
x1 = 5 * (stepseq(0, 0, 30) - stepseq(20, 0, 30));
n2 = [-1:30];
x2 = n2 .* (stepseq(0, -1, 30)-stepseq(10, -1, 30)) + (20-n2) .* (stepseq(10, -1, 30)-stepseq(20, -1, 30));
n3= [-1:110];
x3 = sin(pi*n3/25) .* (stepseq(0, -1, 110)-stepseq(100, -1, 110));
%% ------------------------------------------------
%% 3 output sequence
%% ------------------------------------------------
y1 = filter(b, a, x1);
y2 = filter(b, a, x2);
y3 = filter(b, a, x3);
figure('NumberTitle', 'off', 'Name', 'Problem 2.20')
set(gcf,'Color',[1,1,1]) % 改变坐标外围背景颜色
subplot(2,1,1); stem(n1, x1); title('x1');
xlabel('n'); ylabel('x1(n)') ;
grid on
subplot(2,1,2); stem(n1, y1); title('y1');
xlabel('n'); ylabel('y1(n)');
grid on;
figure('NumberTitle', 'off', 'Name', 'Problem 2.20')
set(gcf,'Color',[1,1,1]) % 改变坐标外围背景颜色
subplot(2,1,1); stem(n2, x2); title('x2');
xlabel('n'); ylabel('x2(n)') ;
grid on
subplot(2,1,2); stem(n2, y2); title('y2');
xlabel('n'); ylabel('y2(n)');
grid on;
figure('NumberTitle', 'off', 'Name', 'Problem 2.20')
set(gcf,'Color',[1,1,1]) % 改变坐标外围背景颜色
subplot(2,1,1); stem(n3, x3); title('x3');
xlabel('n'); ylabel('x3(n)') ;
grid on
subplot(2,1,2); stem(n3, y3); title('y3');
xlabel('n'); ylabel('y3(n)');
grid on;
%% ---------------------------------------------
%% stability
%% ---------------------------------------------
x4 = impseq(0, 0, 10);
y4 = filter(b, a, x4);
fprintf('\nsum(abs(h)) = %f \n', sum(abs(y4)));
figure('NumberTitle', 'off', 'Name', 'Problem 2.20 Zero-Pole')
set(gcf,'Color',[1,1,1]) % 改变坐标外围背景颜色
pzmap(b, a);
z = roots(a); magz = abs(z)
运行结果:
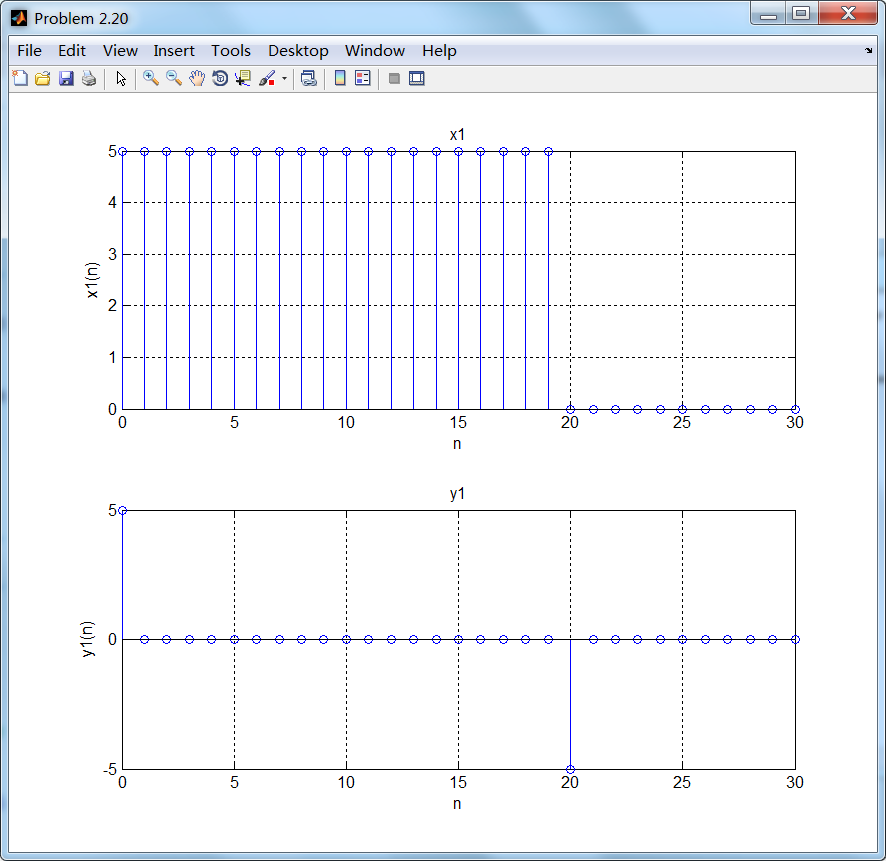
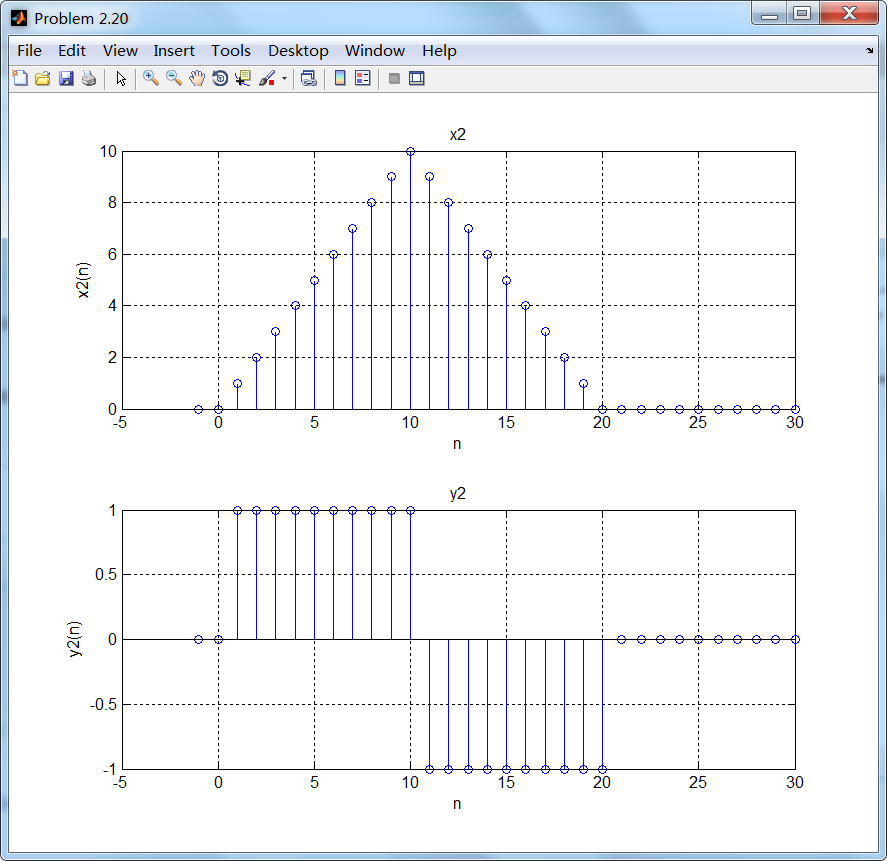
上图看出,三角波信号的微分结果是方波。正弦信号的微分当然就是余弦信号了,见下图:
微分器的脉冲响应序列是绝对可和的,所以系统是稳定的。
牢记:
1、如果你决定做某事,那就动手去做;不要受任何人、任何事的干扰。2、这个世界并不完美,但依然值得我们去为之奋斗。
